3432
Combined Visual Analysis of Myocardial Strain and Intra-Ventricular Blood Flow1New York University School of Medicine, New York, NY, United States, 2Charité Universitätsmedizin Berlin, Berlin, Germany, 3Fraunhofer MEVIS, Bremen, Germany
Synopsis
Intra-ventricular blood flow dynamics are closely related to both ventricle and valve geometry and to the contraction pattern of the myocardial wall. The interaction mechanisms between contraction forces inside the myocardium and hydrodynamic forces are highly complex and have not yet been fully understood, especially in the presence of pathology. We propose a visual analysis framework for the integrated assessment of ventricle and valve morphology, blood flow and local myocardial function. This is a first step to enable better understanding of the different mechanical factors involved in hypertrophic cardiomyopathy (HCM) and their combined contributions to the formation of obstructive HCM.
Introduction
The blood flow dynamics inside the left ventricle (LV) are influenced both by the geometry of the ventricle and of the valve apparatus, and by the contraction within the myocardium. The interactions between contraction forces inside the myocardial wall and hydrodynamic forces are highly complex and have not yet been fully understood, especially in the presence of pathology. Hypertrophic cardiomyopathy (HCM) is a relatively common condition, in which the interactions between myocardial geometry, contraction forces, the mitral valve (MV) and the blood flow pattern can induce LV outflow tract (LVOT) obstruction1. This condition can be treated medically using negative inotropes, which decrease the force of myocyte contraction, or surgically by resection or alcohol ablation of the hypertrophied septum and modification of the mitral apparatus.2 A better quantitative assessment of the mechanisms behind obstructive HCM can potentially improve therapy decisions, for patients unresponsive to negative inotropes. MRI can provide extensive information about the cardiac function, geometry, and local wall mechanics, as well as the blood flow patterns inside the LV. However, the different kinds of data are currently separately analyzed, as there are limited available software solutions suitable for joint analysis and visualization of these multidimensional data. We propose an integrated analysis framework for the joint assessment of blood flow and local myocardial function, as a way to enable better understanding of the different mechanical factors involved in HCM and their contributions to the formation of LVOT obstruction.Methods
As a first proof of concept, standard cine MRI was acquired for a healthy volunteer on a 3T Prisma (Siemens, Erlangen, Germany) for a stack of short-axis slices (SAX) and in three-chamber (3CH) orientation, with 1.33x1.33x6mm spatial and $$$\approx$$$40ms temporal resolution. The myocardium geometry was automatically segmented3 and manually corrected from the SAX. The MV was interactively delineated in the 3CH cine series and automatically tracked over the cardiac cycle.
SPAMM-tagged MRI4 was acquired in a single 3CH slice, with 1.33x1.33x6mm spatial and$$$\,\approx$$$40ms temporal resolution. A time-resolved wall deformation vector field was extracted from the 3CH tagged MRI series (Fig.1.), using a non-rigid registration approach based on local phase (Morphon),5 which is robust to temporal intensity changes and tag fading. The 2D Green-Lagrange strain tensor $$E=\begin{bmatrix}E_{xx}&E_{xy}\\E_{yx}&E_{yy}\end{bmatrix}$$ was computed for the myocardium, based on the integrated deformation field and was projected onto the first and second principal components. 4D-flow MRI was also acquired using a Siemens work-in-progress sequence, for a slab centered around the 3CH slice position containing the heart (venc=150, spatial resolution 2.375x2.375x2.5mm, temporal resolution $$$\approx$$$40ms). The LV flow pattern was computed from the velocity field by particle tracing with Runge-Kutta integration in MeVisLab.6 The virtual particles were seeded approximately in the planes of the aortic valve, for systole, and MV, for diastole.
Results
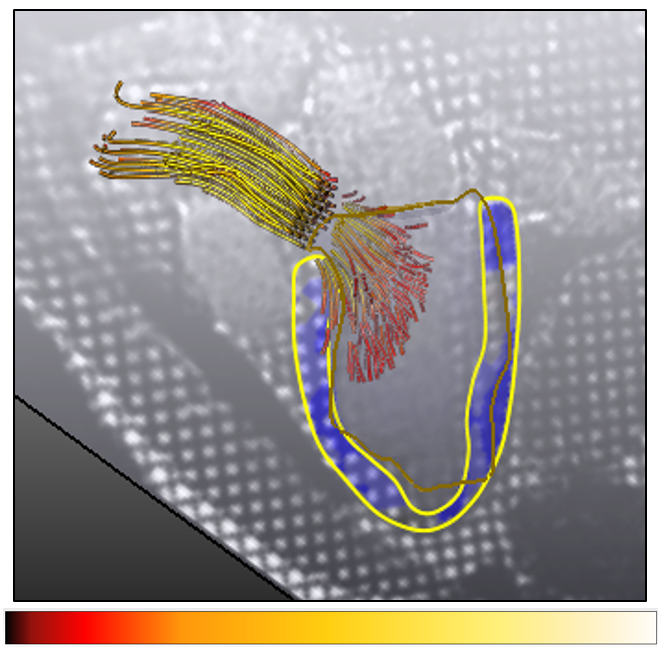
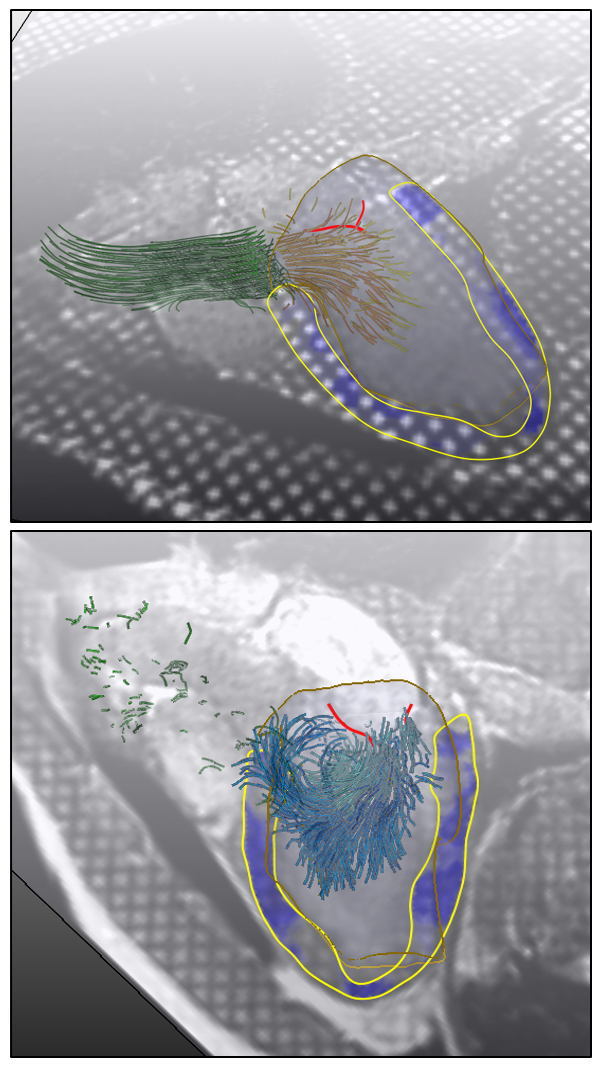
The myocardial strain map is displayed in a combined visualization with the corresponding 4D flow pattern. Either the myocardial strain components or the total relative deformation can be toggled and overlaid on the 3CH image series, using a semi-transparent color map. The color map for the flow path lines can be used to display either their origin or the magnitude of the velocity vectors (Fig.2.). The LV geometry can be added as a transparent volumetric mesh that can be additionally enhanced with 3D silhouettes or texture mapping. The segmented and tracked MV leaflets are also displayed, for a comprehensive data overview. Fig.3. shows snapshots from the combined interactive visualization for a normal volunteer during systole and diastole.Discussion
Interactive and integrated visual analysis of the joint information from different types of data (flow and function) in a cardiac MRI exam can provide a useful means of integrating and interpreting the information contained in the separate independent datasets. By integrating flow visualization with local LV and valve geometry, it is possible to assess the relative contributions to obstruction of aspects such as the relation of vortical structures to displacement of the valve leaflets, and of the correlation between local changes in myocardial strain and the corresponding blood flow features. Since LVOT obstruction is not a linear phenomenon, a small change in the forces acting on the leaflets can have a large impact on the occurrence or severity of the obstruction, underscoring the importance of better understanding them.
Conclusion
An interactive visual analysis framework for multidimensional cardiac MRI data is a first step towards a better understanding and modeling of the complex interactions between the contractile forces in the myocardial wall, hydrodynamic forces in the underlying blood flow and the MV, which can potentially lead to better therapy planning for patients with LVOT obstruction.Acknowledgements
No acknowledgement found.References
1. Ro R, Halpern D, Sahn DJ, Homel P, Arabadjian M, Lopresto C, et al. Vector Flow Mapping in Obstructive Hypertrophic Cardiomyopathy to Assess the Relationship of Early Systolic Left Ventricular Flow and the Mitral Valve. J Am Coll Cardiol 2014; 64:1984-1995.
2. Sherrid MV, Shetty A, Winson G, Kim B, et al. Treatment of obstructive hypertrophic cardiomyopathy symptoms and gradient resistant to first-line therapy with beta-blockade or verapamil. Circ Heart Fail 2013; 6:694-702.
3. Chitiboi T, Hennemuth A, Tautz L, Huellebrand M, Frahm J, Linsen L, Hahn H. Context-based segmentation and analysis of multi-cycle real-time cardiac MRI. IEEE 11th International Symposium on Biomedical Imaging (ISBI) 2014; pp.943-946.
4. Axel L and Dougherty L. Heart wall motion: improved method of spatial modulation of magnetization for MR imaging. Radiology 1989; 172:349-50.
5. Tautz L, Hennemuth A, Peitgen HO. Motion analysis with quadrature filter based registration of tagged MRI sequences. International Workshop on Statistical Atlases and Computational Models of the Heart 2011; pp. 78-87.
6. Hennemuth A, Friman O, Schumann C, Bock J, Drexl J, Huellebrand M, Markl M, Peitgen HO. Fast interactive exploration of 4D MRI flow data. Medical Imaging 2011: Visualization, Image-Guided Procedures, and Modeling; 7964:79640E.
Figures