3431
A Methodology Towards Registering Prostate Histology and Radiologic Imaging to Validate Prostate Cancer Detection in 2D1Urology, University of Illinois at Chicago College of Medicine, Chicago, IL, United States, 2Bioengineering, University of Illinois at Chicago, Chicago, IL, United States, 3Pathology, University of Illinois at Chicago College of Medicine, Chicago, IL, United States
Synopsis
In-vivo radiological imaging is used globally to detect possible cancers and inform treatment decisions, but difficulties arise when attempting to compare radiological findings to the gold-standard of diagnosis, histopathology. Standard imaging protocols have documented success but to determine the reliability of new imaging sequences and modalities, correlation to histopathology must be made. Several methods have been proposed for registration in both 2D and 3D, but these have shown limited effectiveness and often require unique equipment or proprietary algorithms. In this study, we attempt to complete an accurate registration in 2D in order to validate different imaging modalities.
Introduction
Multi-parametric magnetic resonance imaging (mpMRI) is currently in standard use for men with suspicion of prostate cancer (PCa) to inform treatment decisions1. Matching in-vivo mpMRI to embedded radical prostatectomy (RP) sections, however, is a challenging process due to the vast differences in resolution and scale. In order to evaluate new imaging modalities, the correlation between imaging and histology is critical. Previous studies2,3,4 have proposed matching internal landmarks, the use of cutting devices, fiducials, landmark creation, and matching contours; these methods are generally not reliable, require atypical equipment, or can potentially harm the diagnostic integrity of the specimen. In this study we demonstrate the ability to register histological images (HI) to their corresponding radiologic image (RI) and use Gleason score (GS) annotations to perform pixel-by-pixel validation.Methods
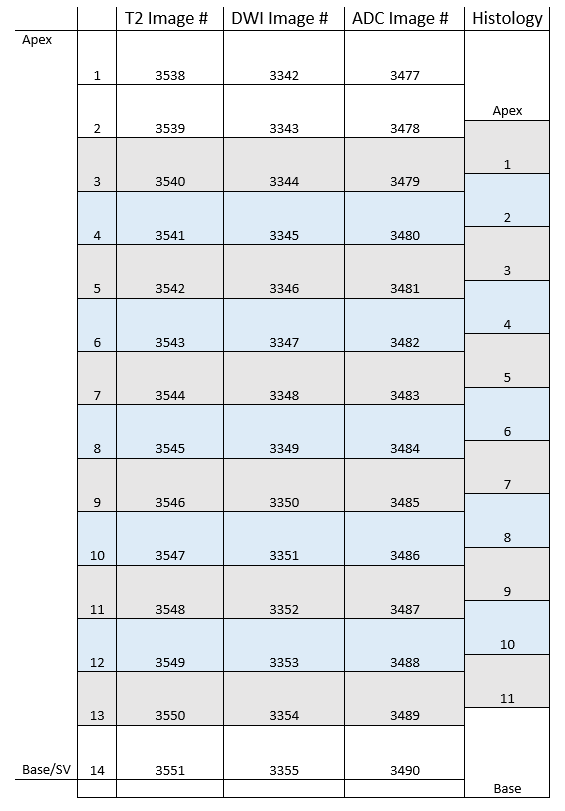
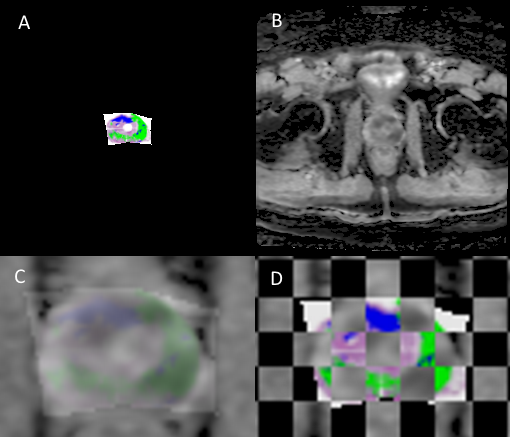
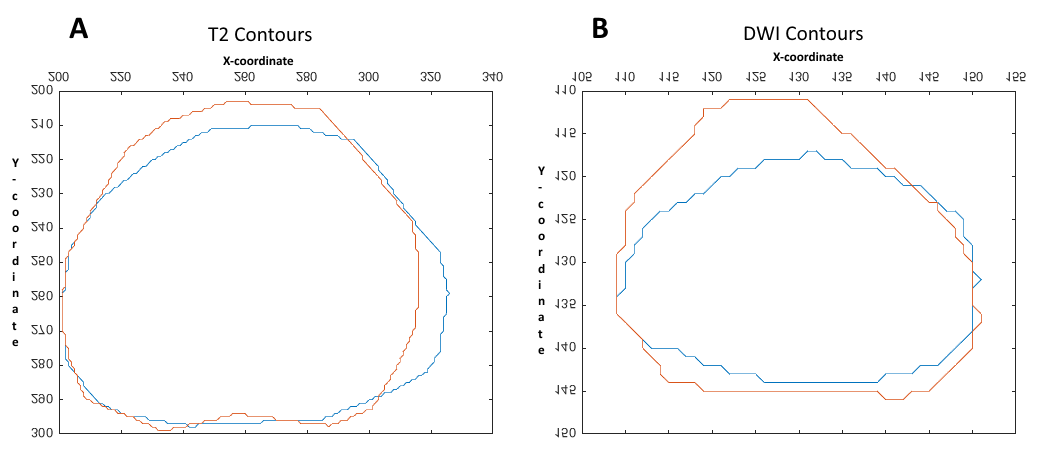
Cohort: A patient with a pre-RP 3T mpMRI (GE Healthcare, Discovery 750 MRI) was identified. Pathological Processing: The prostate was fixed before sectioning to ensure even slices and enable thinner levels (3mm). Quartered levels were embedded in paraffin and stained with Hematoxylin and Eosin (H&E) before placement in glass slides which were scanned at 20X (Scanscope CS, Aperio Technologies) and digitally annotated (Aperio ImageScope, Leica Biosystems) by a board-certified pathologist. The quarters were annotated in pure RGB colors by GS (3, 4 and 5) and for orientation (clock face positions). Pure colors are chosen to be reliably detected in MATLAB v2017b (MathWorks, Natick, MA). A pseudo-whole mount (PWM) slice can be reconstructed from the collective quarters. Histological/Radiological Slice Matching: Slice location is determined with consideration to slice thickness and relative location from the apex. 3mm MRI slices create a reference by which histological levels can be iteratively compared to, shown in Figure 1, consistent with previous work5. Diffusion Value Calculations: Diffusion-weighted MRI (DWI) uses a single exponential signal decay model, S = S0exp[-b*ADC], to generate a spatial map of the apparent diffusion coefficient (ADC). To quantify tissue heterogeneity in the brain, Bennett et al.6 proposed a stretched-exponential model, S = S0exp[-(b*DDC)α], where DDC is the distributed diffusion coefficient, and α (0 < α < 1) is a heterogeneity index, characterizing the multi-exponential nature of diffusion-related signal decay7; here we apply it to prostate. α, DDC, and D were calculated on a pixel-by-pixel basis by fitting the DWI signal intensities (SIs) to the stretched- or mono-exponential model, respectively. T2 (T2 weighted image) SI values were generated with the “dicomread” function in MATLAB. Registration Function: “process_H” was created in MATLAB for registration. The scale (mm) of the PWM was determined using ImageScope and applying a fixation correction factor (1.047)8,9. Manual control point registration (“cpselect”, MATLAB) applies a linear piecewise affine non-rigid transformation. “process_H” outputs the transformed HI (Figure 2A) and qualitative assessments (Figure 2C & D). Registration Accuracy: Accuracy of registration was tested by contour matching, shown in Figure 3, and percent area overlap of HI to RI. MRI Validation: ROC curves were generated for a single slice. Masks were created demarking GS ≥3 (all tumors) and GS ≥4 (clinically significant tumors)10 from the processed HI, providing Boolean diagnosis designations for ROC comparison, pixel by pixel.Results
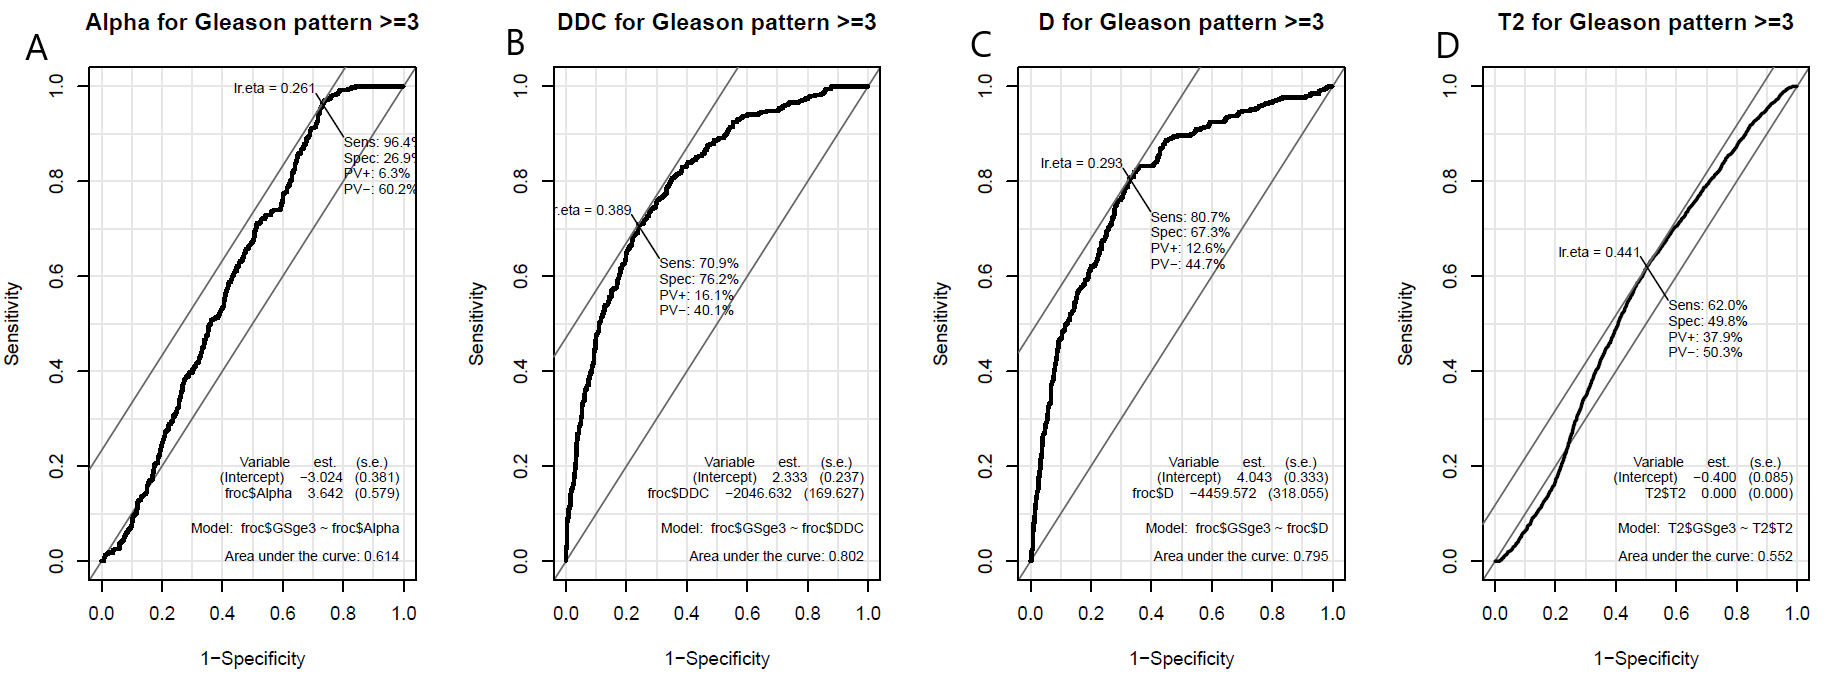
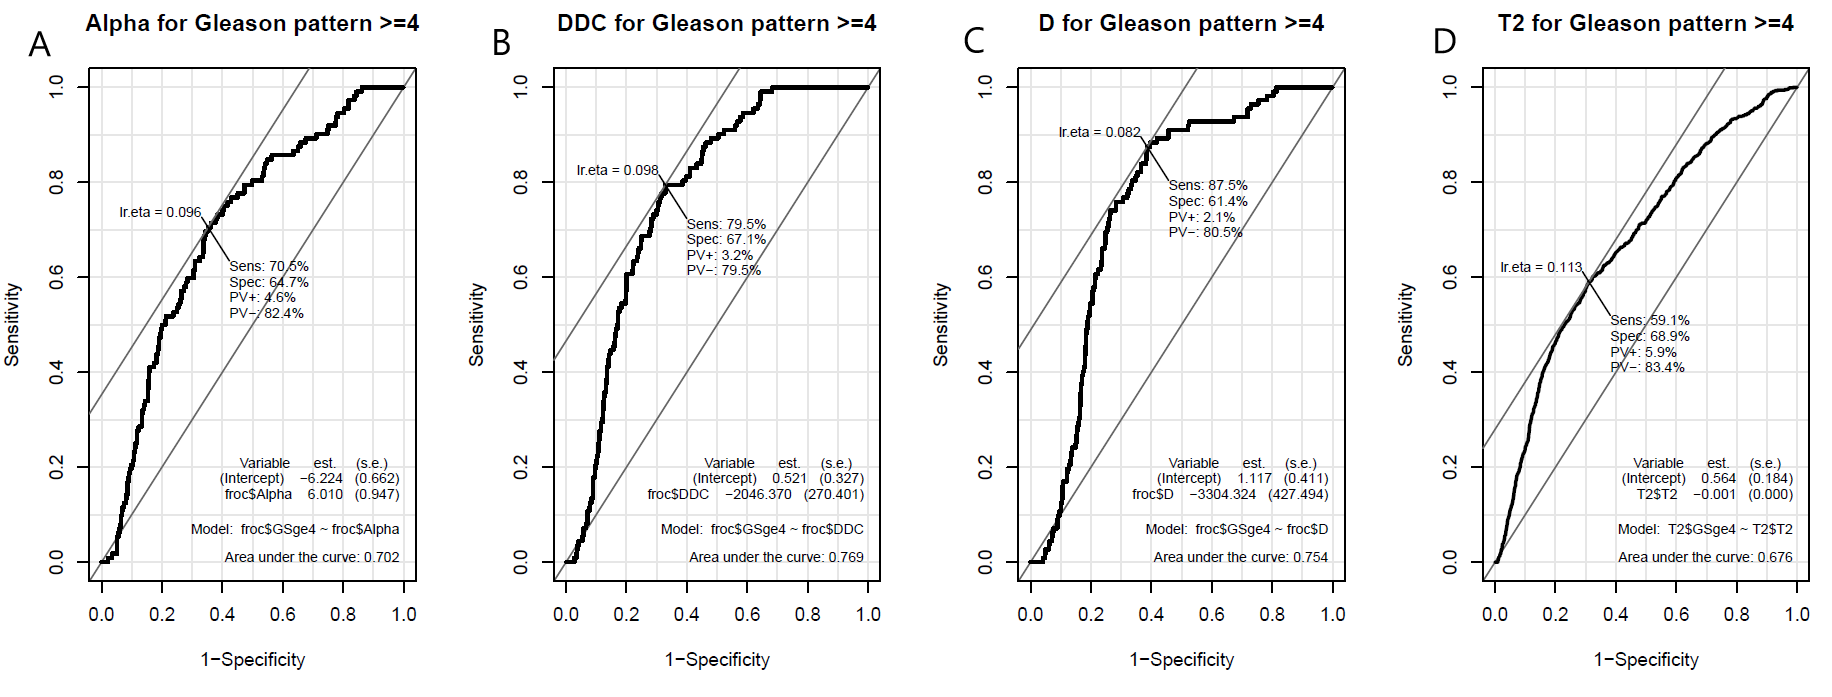
Figures 4 and 5 show ROC results generated (“Epi,” “pROC,” R3.4.0, RFSCP) for each imaging modality as compared to GS ≥3 (Figure 4) and GS ≥4 (Figure 5). When compared to GS ≥3, DDC provided the highest AUC (0.802) and specificity (76.2%); α provided the highest sensitivity (96.4%). When compared to GS ≥4, DDC provided the highest AUC (0.769), T2 provided the highest specificity (68.9%), and D provided the highest sensitivity (87.5%). Only α and T2 increased AUC when compared to GS ≥4 (0.614 to 0.702 and 0.552 to 0.676, respectively). Area-based comparison showed 75.8 % and 90.38% area overlap for the DWI-based and T2-based registrations, respectively.Discussion and Conclusion
Except for T2 vs GS ≥3, all comparison AUC values were more than 0.60, demonstrating a level of success in validating RI modalities. Increases in AUC from GS ≥3 to GS ≥4 are promising for those modalities (α and T2) to preferentially detect higher grade tumors and avoid overtreatment. Limitations in this study include distortion from catheter placement, conceded because the peripheral zone is the most likely to develop PCa11, and HI slices are cut ~5µm thick so it is not reasonable to assume a true 1:1 slice match. Accurate registration will allow for the determination of an imaging modality or a combination of modalities that will best stage and detect PCa. Future work includes automation, a larger cohort, and 3D registration.Acknowledgements
This research was supported by Department of Defense PRTA W81XWH-15-1-0346 (Abern).References
[1] Barentsz JO, Richenberg J, Futterer JJ, et al. ESUR prostate MR guidelines 2012. Eur Radiol. 2012;22(4):746-57
[2] Park H, Piert M, Meyer C. Registration methodology for histological sections and in vivo imaging of human prostate. Acad Radiol 2008; 15:1027-1039
[3] Yamamoto H, BChir MB, Chandra A, et al. A workflow to improve the alignment of prostate imaging with whole-mount histopathology. Acad Radiol. 2014;21:1009-1019
[4] Commandeur F, Acosta O, Crevoisier R, et al. Prsotate whole-mount histology reconstruction and registration to MRI for correlating in-vivo observations with biological findings. IEEE Eng. Med. Biol. Soc. 2015;2015:2399-2402
[5] Guzman L, Commandeur F, Crevoisier R, et al. Slice correspondence estimation using SURF descriptors and context-based search for prostate whole-mount histology MRI registration. IEEE Eng Med Biol Soc. 2016 Aug;2016:1163-1166
[6] Bennett, K. M., et al. Models of diffusion signal decay in magnetic resonance imaging: capturing complexity. Magn. Reson. Med. 50 (2003): 727-734
[7] Berbian- Santos, M.N. et al. Mathematical functions for the analysis of luminescence decays with underlying distributions 1. Kohlrausch decay function (stretched exponential). Chem. Phys. 315 (2005): 171-182
[8] Jonmarker S, Valdman A, Egevad L, et al. Tissue shrinkage after fixation with formalin injection of prostatectomy specimens.Virchows Arch. 2006 Sep; 449(3): 297–301
[9] Schned AR, Karlya WJ, Harris RJ, et al. Tissue shrinkage correction factor in the calculation of prostate cancer volume. The American Journal of Surgical Pathology. 1996 Dec;20(12):1501-1506
[10] Miah S, Ahmed H, Emberton M. Does true Gleason pattern 3 merit its cancer descriptor? Nature Reviews Urology. 2016 Aug;13:541-548
[11] McNeal JE, Redwine EA, Freiha FS, Stamey TA. Zonal distribution of prostatic adenocarcinoma. Correlation with histologic pattern and direction of spread. Am J Surg Pathol. 1988;12:897-906
Figures