3430
Detection of Liver Fibrosis using Strain-Encoding MRI and Support Vector Machine1School of communication and Information Technology, Nile University, Cairo, Egypt, 2Systems and Biomedical Engineering Department, Cairo University, Cairo, Egypt, 3Biomedical Engineering Department, King’s College, London, United Kingdom, 4Liver Diseases Branch, National Institute of Diabetes and Digestive and Kidney Diseases, Bethesda, MD, United States, 5Biomedical and Metabolic Imaging Branch, National Institute of Diabetes and Digestive and Kidney Diseases, Bethesda, MD, United States
Synopsis
This study proposes a device-free semi-automatic liver fibrosis identification system based on Strain Encoded (SENC) MRI. SENC-MRI was applied to quantify liver deformation induced by the heart motion over the cardiac cycle. Twenty-two patients with different stages of biopsy proven liver fibrosis and ten healthy subjects were imaged using SENC-MRI. A Support Vector Machine (SVM) classification system was used to classify the strain and strain rate for both the patients and healthy subjects. Based on leave-one-out cross validation. Strain and strain rate were more robust than the peak-to-peak value based classification, which has bias towards the sensitivity. The proposed method showed classification accuracy of 87.5% with sensitivity and specificity of 90.0% and 90%, respectively.
Purpose
Early diagnosis of the liver fibrosis is prominent to prevent further liver damage liver and support potential tissue reversibility1. Currently, liver biopsy is the diagnostic reference standard to assess the first-presentation patients with a chronic liver disorder, fibrosis stage, and liver cirrhosis. Nevertheless, it is considered invasive for the routine follow-up examinations2. Recently, Harouni et al.3 developed a method to assess the liver fibrosis using the intrinsic strain provided by the cardiac motion as a fundamental source of motion instead of an external driver using fast strain encoding (fSENC) MRI.
Although, peak liver strain showed a significant difference between normal and fibrotic liver tissues, the method is potentially affected by the strength of the heart contraction. In addition, it cannot capture the changes of the strain values along cardiac cycle, to evaluate the effect of change in strain along the complete cycle.
In this study, we propose a semi-automatic module to identify the fibrotic from the normal liver subjects using SENC and fSENC MRI with different tagging frequencies. New feature set, based on the strain and strain rate pattern of these elected ROI, are employed to classify the normal and abnormal patterns using Support Vector Machine (SVM) classifier.
Methods
Dataset Description
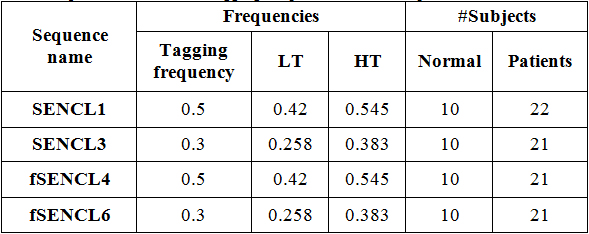
Thirty-two subjects signed informed consent to participate in this Institutional Review Board (IRB) approved study. Twenty-two patients had biopsy-proved liver fibrosis and ten were healthy controls. All subjects were scanned in the supine position using a 3T MRI Philips Achieva using a 32-channel cardiac-abdominal coil to acquire axial-view SENC and fSENC. The experimental parameters for the ECG-Gated spiral GRE Sequence were as follows: TR/TE = 20/0.77 ms; slice thickness = 8 mm; FOV = 350×350 mm2; scan matrix =320×320 voxels; and flip angles = 30°. The images were acquired in 18-24 minutes. The sequence was applied with different tagging, low and high tunes, frequencies, listed in Table 1.
Calculation of the liver strain image
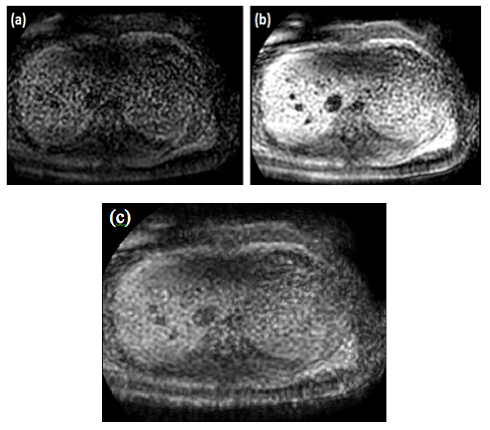
To produce a SENC image at any given time in the cardiac cycle, two images with two different tuning frequencies, named low- and high-tuning, are acquired, as shown in figure 1. The magnitude images acquired with the two tuning frequencies are subsequently combined to generate a time series of SENC images4. A SENC time series is generated with N – 1 time frames. By combining the two images using the center-of-mass method, the local spatial frequency of a particular pixel at a time t was calculated and the local strain and strain rate as functions of time of any point were calculated4.
ROI Selection
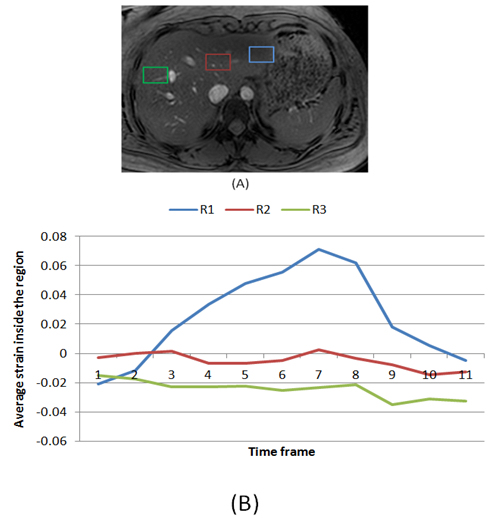
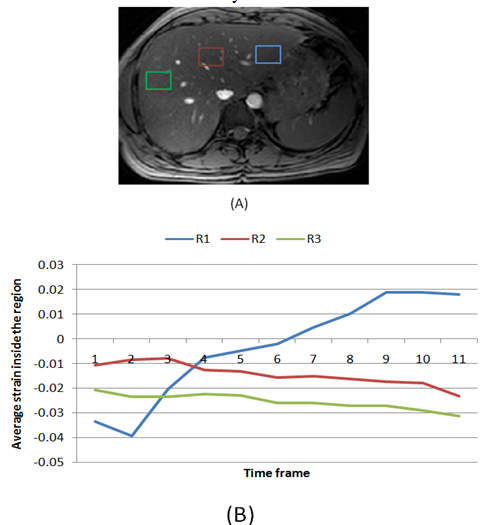
Regions of interest (ROI) close to the heart were selected that capture the changes in the liver tissue strain during the cardiac contraction. Figure 2 shows the strain profile of a normal case for different regions. The strain profile near the heart in region R1 (blue), is following the reverse characteristics of the circumferential cardiac strain. The two other regions show very low strain. In the fibrotic liver, as shown in figure 3, strain range was low in all regions and no region was following the heart strain. Consequently, the strain inside the first region (close to the heart) is selected to be the fundamental feature that describe the differences between normal and fibrotic liver.
Classification and Performance
Evaluation Support Vector Machine (SVM)5 was selected to automatically classify normal and fibrotic strain and strain rate curves. leave-one-out cross validation was employed the classification process to ensure the robustness of the classification6. The performance of the classification was then evaluated based on the average sensitivity, specificity and accuracy. In addition, the strain and strain rate features were compared with the Peak to Peak liver strain feature3.
Results and Discussion
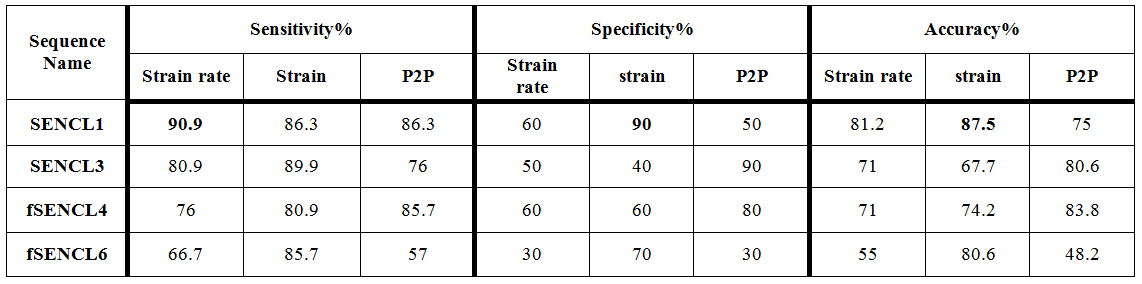
SVM results using strain and strain rate time profiles, and Peak-to-Peak (P2P) feature as demonstrated in Table 2. Strain and strain rate time profiles were more accurate and can perform higher sensitivity than P2P. In case of SENCL1 sequence, the sensitivity of strain rate feature outperformed the other features.
As shown in Table 2, the sensitivity, specificity and accuracy of the proposed system for strain and strain rate features were 90.9% sensitivity achieved using strain rate feature for SENCL1 sequence, and 87.5% accuracy using strain feature. The overall performance for the features in comparison was higher using SENCL1 and fSENCL4 sequences, which can give the intuition that the tagging frequency of the SENCL1 and fSENCL4 are better matching the liver’s strain frequencies than SENCL3 and fSENCL6.
Conclusion
A method for classifying liver fibrosis was presented based on the analysis of liver deformation induced by the heart motion and SVM. The proposed method was able to identify cases with liver fibrosis with high accuracy and sensitivity.Acknowledgements
This work was partially funded by the intramural program of The National Institute of Diabetes and Digestive and Kidney Diseases, NIH, USA and by Newton-Musharafa grant, British council, UK and STDF agency, Egypt.References
1. Ramón Bataller, David A. Brenner, "Liver Fibrosis", Science in Medicine, vol. 115, no. 2, pp. 209- 218, 2005.
2. Vasilios Papastergiou, Emmanuel Tsochatzis, Andrew K. Burroughs, "Non-invasive assessment of liver fibrosis", Annals of Gastroenterology, vol. 25, pp. 218-231, 2012.
3. A. A. Harouni, A. M. Gharib, N. F. Osman, C. Morse, T. Heller, and K. Z. Abd-Elmoniem, "Assessment of liver fibrosis using fast strain-encoded MRI driven by inherent cardiac motion," Magn Reson Med, vol. 74, pp. 106–114 Jul 31 2015.
4. Pan L, Stuber M, Kraitchman DL, Fritzges DL, Gilson WD, OsmaNF,"Real-time imaging of regional myocardial function using fast SENC", Magnetic Resonance in Medicine Journal, vol. 55, pp. 386-395.
5. Furey, Terrence S., et al. "Support vector machine classification and validation of cancer tissue samples using microarray expression data." Bioinformatics vol.16, no.10,pp. 906-914.,2000.
6. Kohavi, Ron. "A study of cross-validation and bootstrap for accuracy estimation and model selection." Ijcai. vol. 14. no. 2. 1995.
Figures