3429
Feature Extraction and Analysis for Characterization of Breast Lesion Type using Multi-parametric MRI1Centre for Biomedical Engineering, Indian Institute of Technology Delhi, New Delhi, India, 2C-DOT India, New Delhi, India, 3Computer Science and Engineering, Indian Institute of Technology Delhi, New Delhi, India, 4Department of Radiology and Imaging, Fortis Memorial Research Institute, Gurgaon, India, New Delhi, India, 5Department of Biomedical Engineering, All India Institute of Medical Sciences Delhi, New Delhi, India
Synopsis
Quantitative analysis of T1-perfusion data provides estimation of hemodynamic and physiological parameters of tissue. Texture analysis uses mathematical approach to distinguish the spatial distribution of signal intensity variations. In this study, we computed different texture and quantitative parameters in terms of characterizing histological types (lobular and ductal) of invasive breast cancer. Experimental results revealed that combination of texture and quantitative features provided highest sensitivity and specificity to differentiate IDC and ILC breast lesions.
Introduction:
Breast cancer is leading cancer in women both in the developed and the developing countries1. The two common pathologic types of invasive breast cancer are invasive ductal carcinoma(IDC) which accounts for 80% of all breast cancers, and invasive lobular carcinoma(ILC) accounting upto 10%–15% of all diagnosed breast carcinomas2. The different characteristics of IDC and ILC are also reflected in the diagnosis and clinical treatment strategies3. Quantitative features from T1-perfusion MRI data are obtained to evaluate physiological characteristics of lesions5 whereas texture features use a mathematical approach which is related to the local spatial distribution of the grey levels in the MR image6. Several studies suggest that ILC enhances later after contrast medium injection. The use of enhancement characteristics may misdiagnosis ILC as benign lesions4. The objective of this study was to investigate quantitative values and texture features (obtained from T1-Perfusion images as well as quantitative maps) in terms of characterizing histological types(lobular and ductal) of breast cancer lesion.METHODS:
All the MRI experiments were performed at 3T-whole body Ingenia MRI system (Philips-Healthcare, The Netherlands) using a 7 channel biopsy compatible breast coil. In this study, we included sixteen patients with histologically confirmed breast lesions(6-lobular and 10-ductal) for both data giving total 96 tumors ROIs(6 ROIs/patient).
MRI Data acquisition: After a localizer, 2D T1-weighted(W), T2-W and PD-W images with and without fat suppression were acquired using turbo spin echo(TSE) pulse sequence for multiple slices. For PD-W and T2-W images echo train length(ETL) of 20 and for T1-W images ETL of 5 was used. FOV=338×338mm2 and matrix size=452×338(interpolated matrix 512×512) were used for T1-(W), T2-W and PD-W. For PD-W, TR/TE=2974ms/30ms was used. For T2-W, TR/TE= 2974ms/100ms was used. For T1 -W, TR/TE=603ms/10ms was used. T1-perfusion MRI was performed using 3-dimensional fast field echo(3D-FFE) sequence (TR/TE=3.0ms/1.5ms, flip angle=12o, FOV=338×338mm2, slice thickness=3mm, matrix size=228×226(interpolated matrix 512×512) and acquisition time 3 minute 42 second). Gd-BOPTA(Multihance, Bracco, Italy) in a dose of 0.1mmol/kg body weights was administered intravenously with the help of a power injector at a rate of 3.0mL/sec, followed by a bolus injection of a 30mL saline flush. A series of 2400 images at 40 dynamics for 60 slices were acquired with a temporal resolution of 5.4seconds.
Data Processing: Data were processed using in house
developed codes in MATLAB 2014a (Texture analysis tool named as Radiomics (https://github.com/mvallieres/radiomics)).
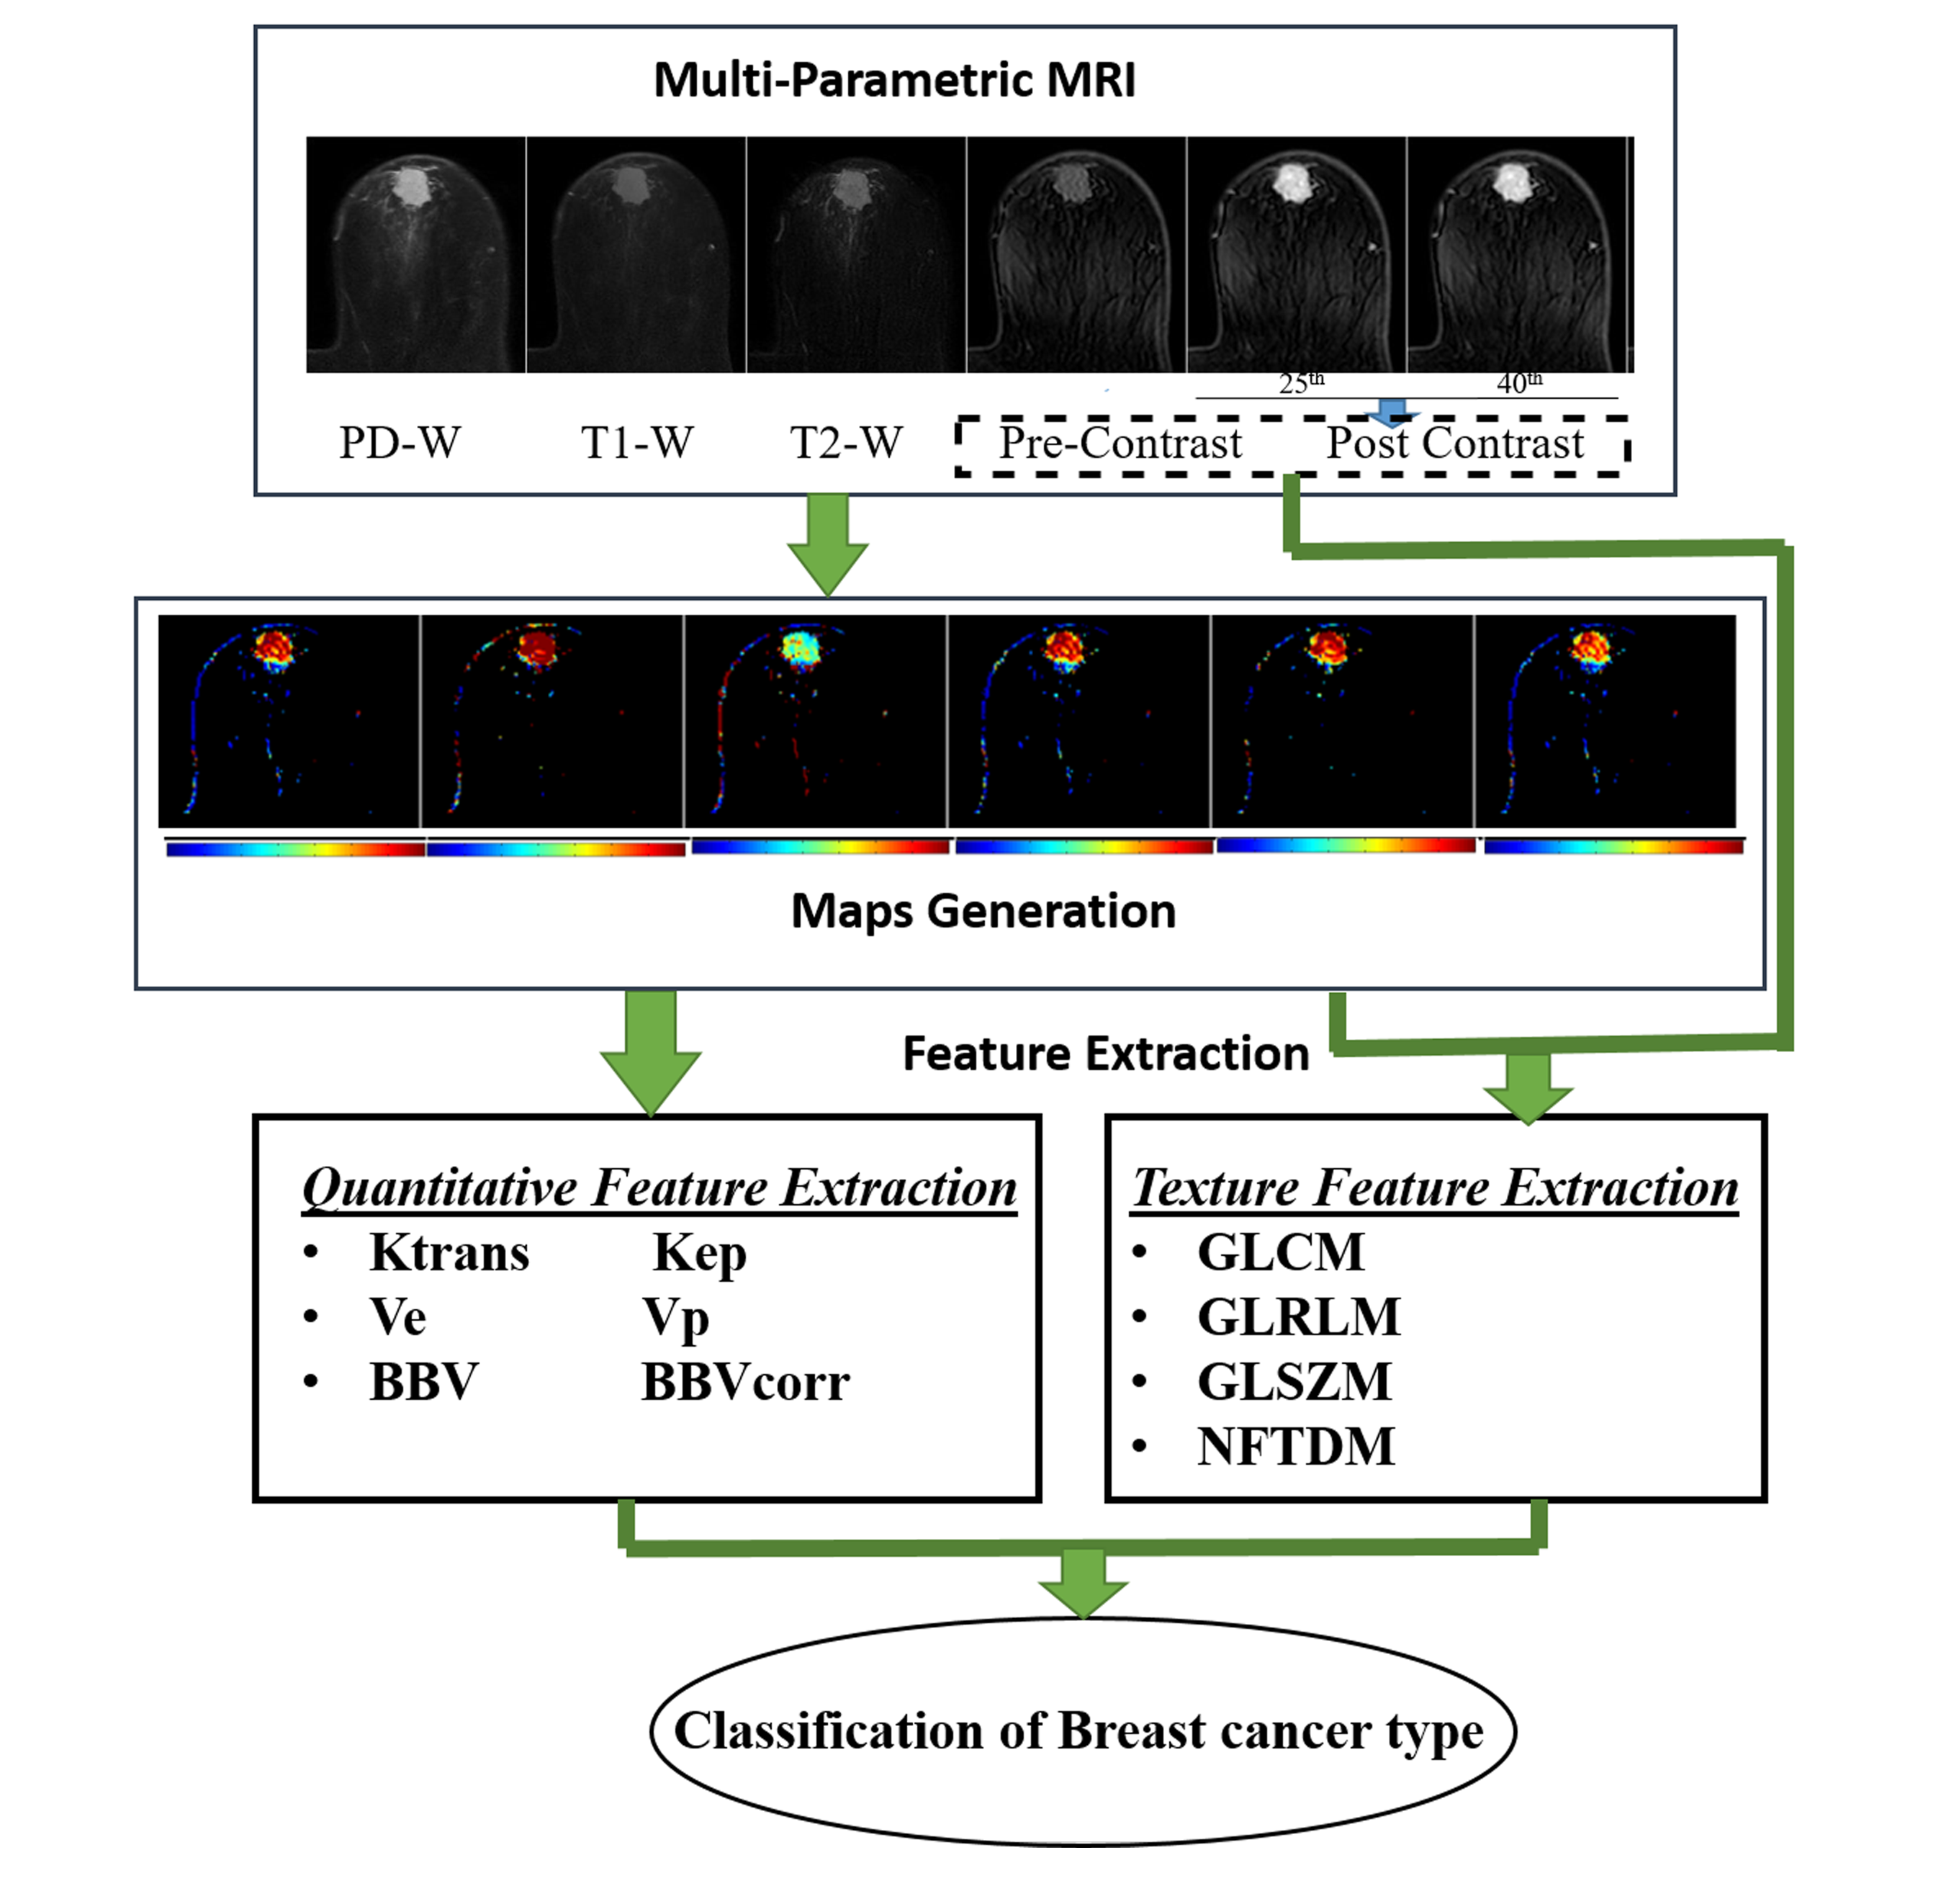
Tracer kinetic5(Ktrans,Kep Ve, Vp) and hemodynamic
parameters(Breast blood volume(BBV),Leakage corrected BBV(BBVcorr), breast blood flow(BBF)) were computed on T1-perfusion images and their
corresponding quantitative maps were generated(Figure-1). After tumor segmentation,
Texture analysis(7-10) were performed on pre-contrast, 25th,
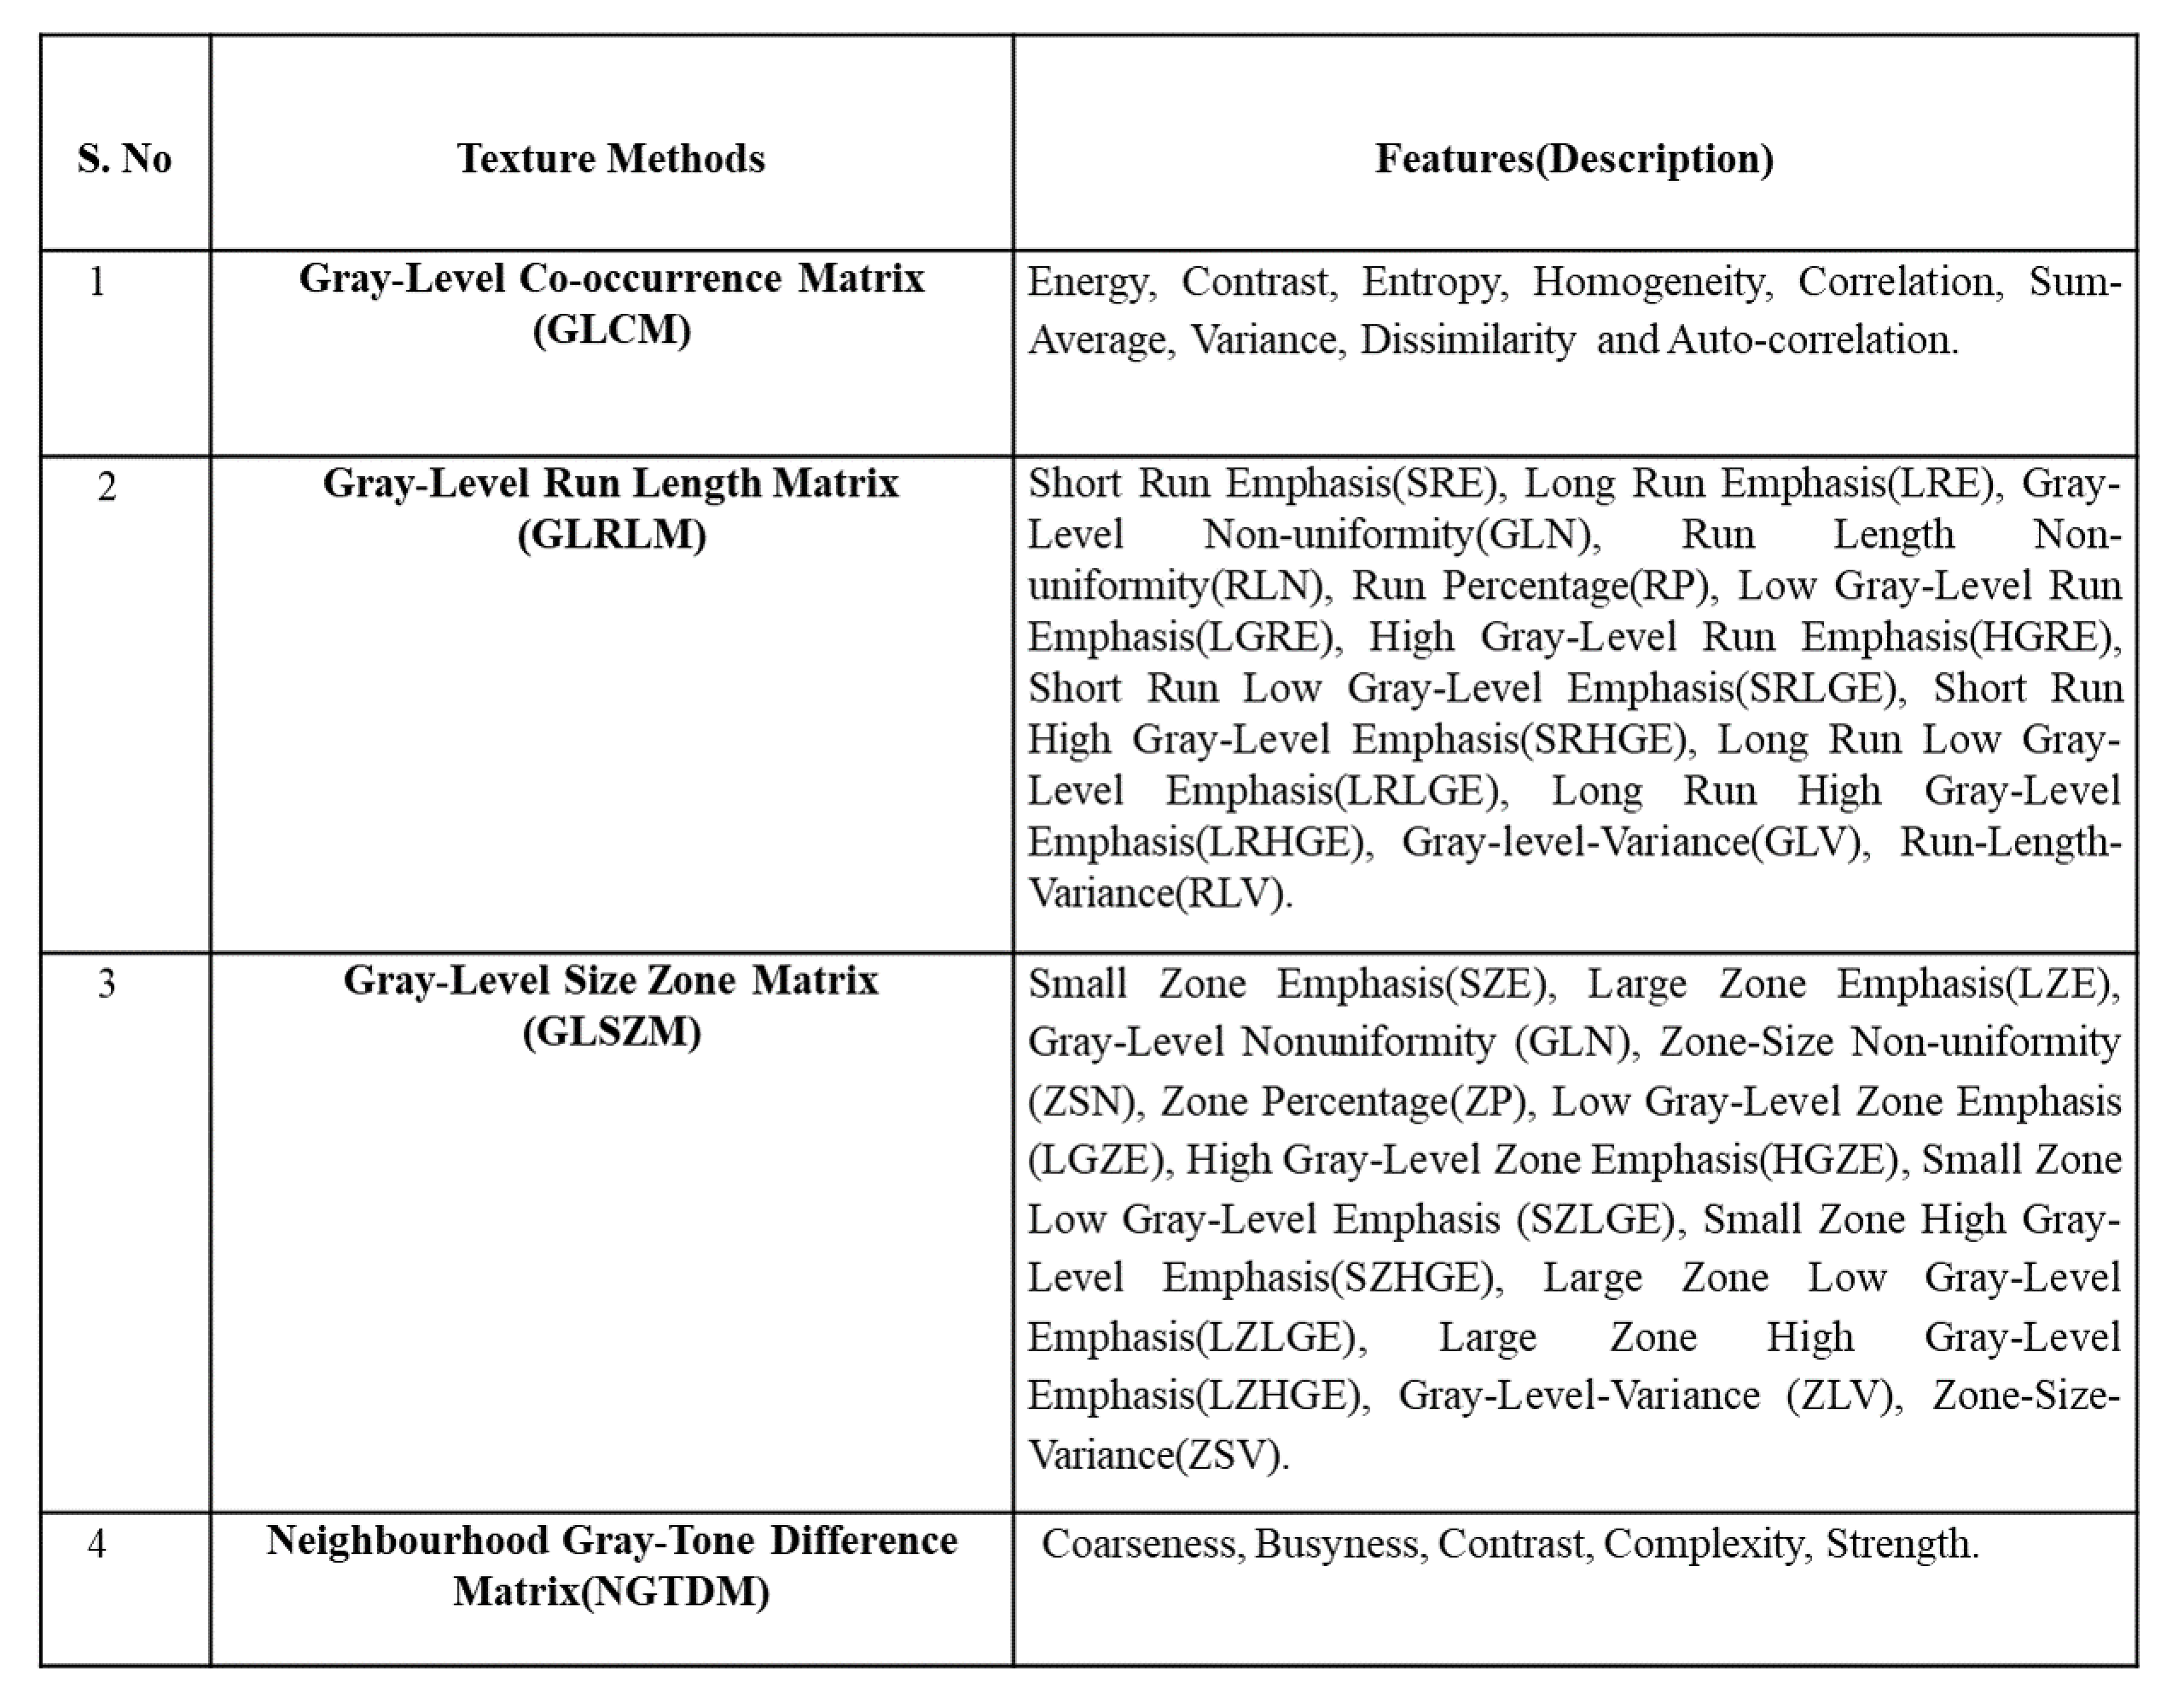
40th dynamics series of DCE MRI images and quantitative maps. A total of 40 texture features
were acquired. The description of these textures features are shown in Table-I.
The mean and standard deviation of hemodynamic and tracer kinetic parameters were
calculated by placing the elliptical regions of interest where the lesion
appeared to have maximum values of the respective perfusion metrics. Receiver
operating characteristic(ROC) curve and T-test
were used for statistical analysis using
SPSS v.15.0 software.
RESULTS:
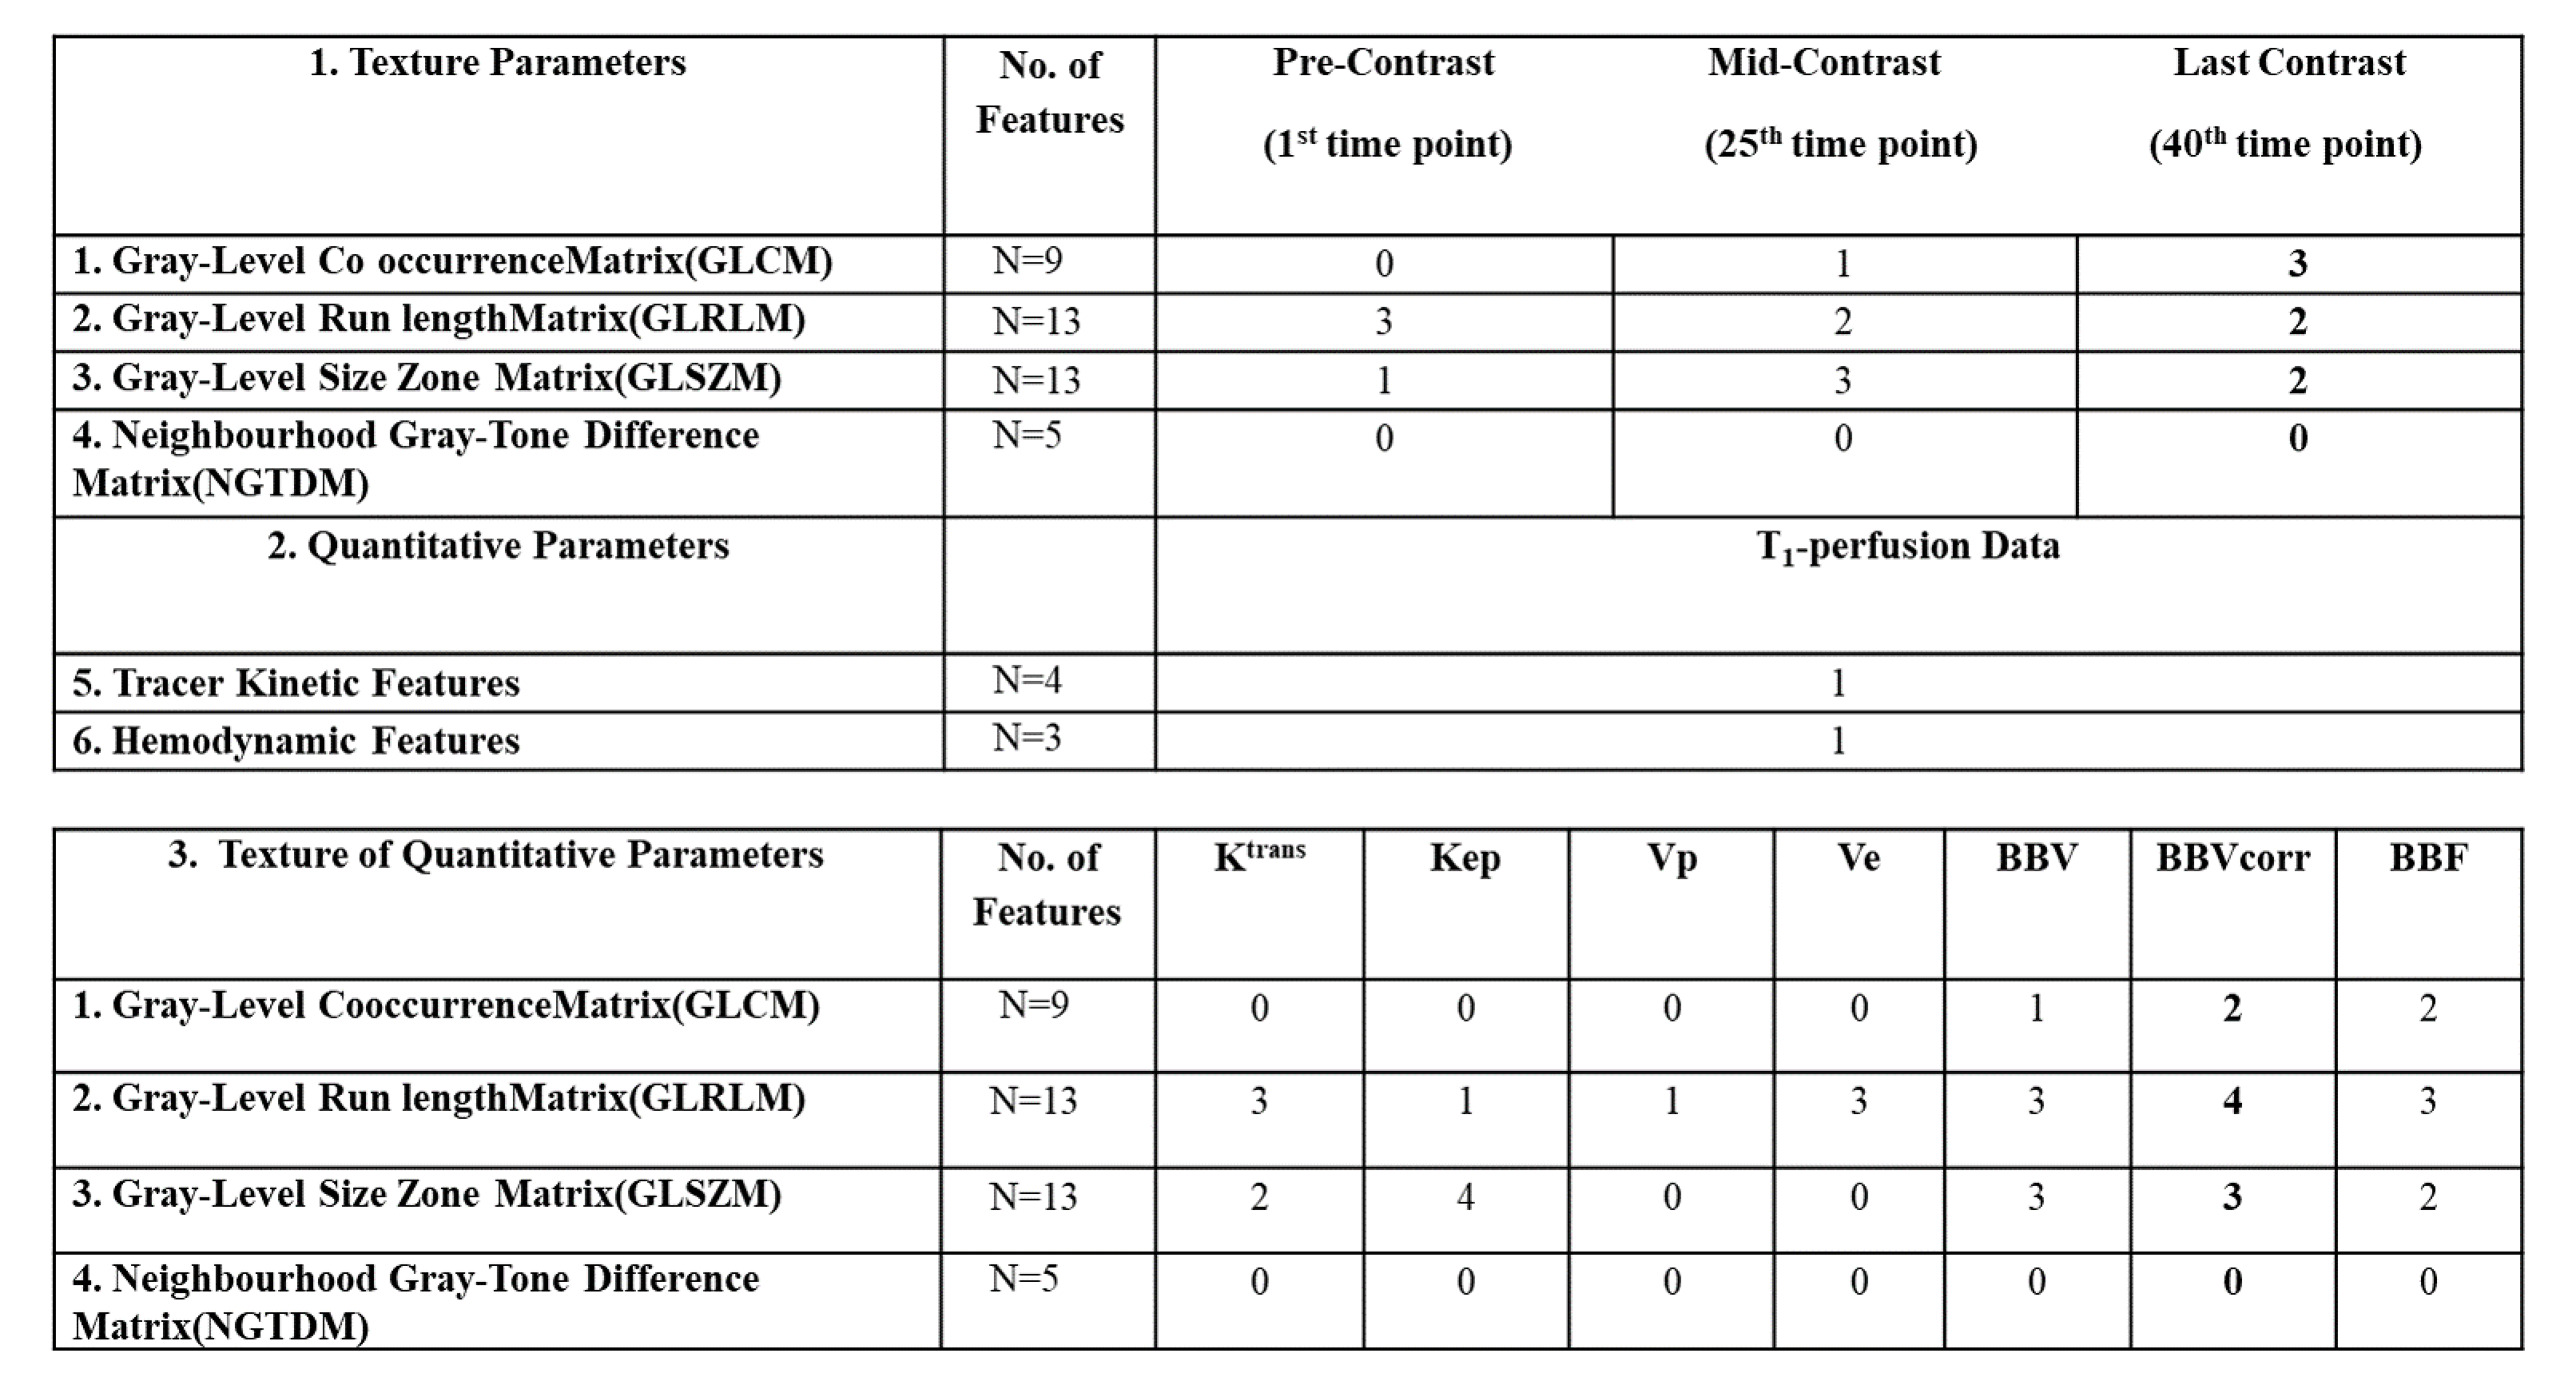
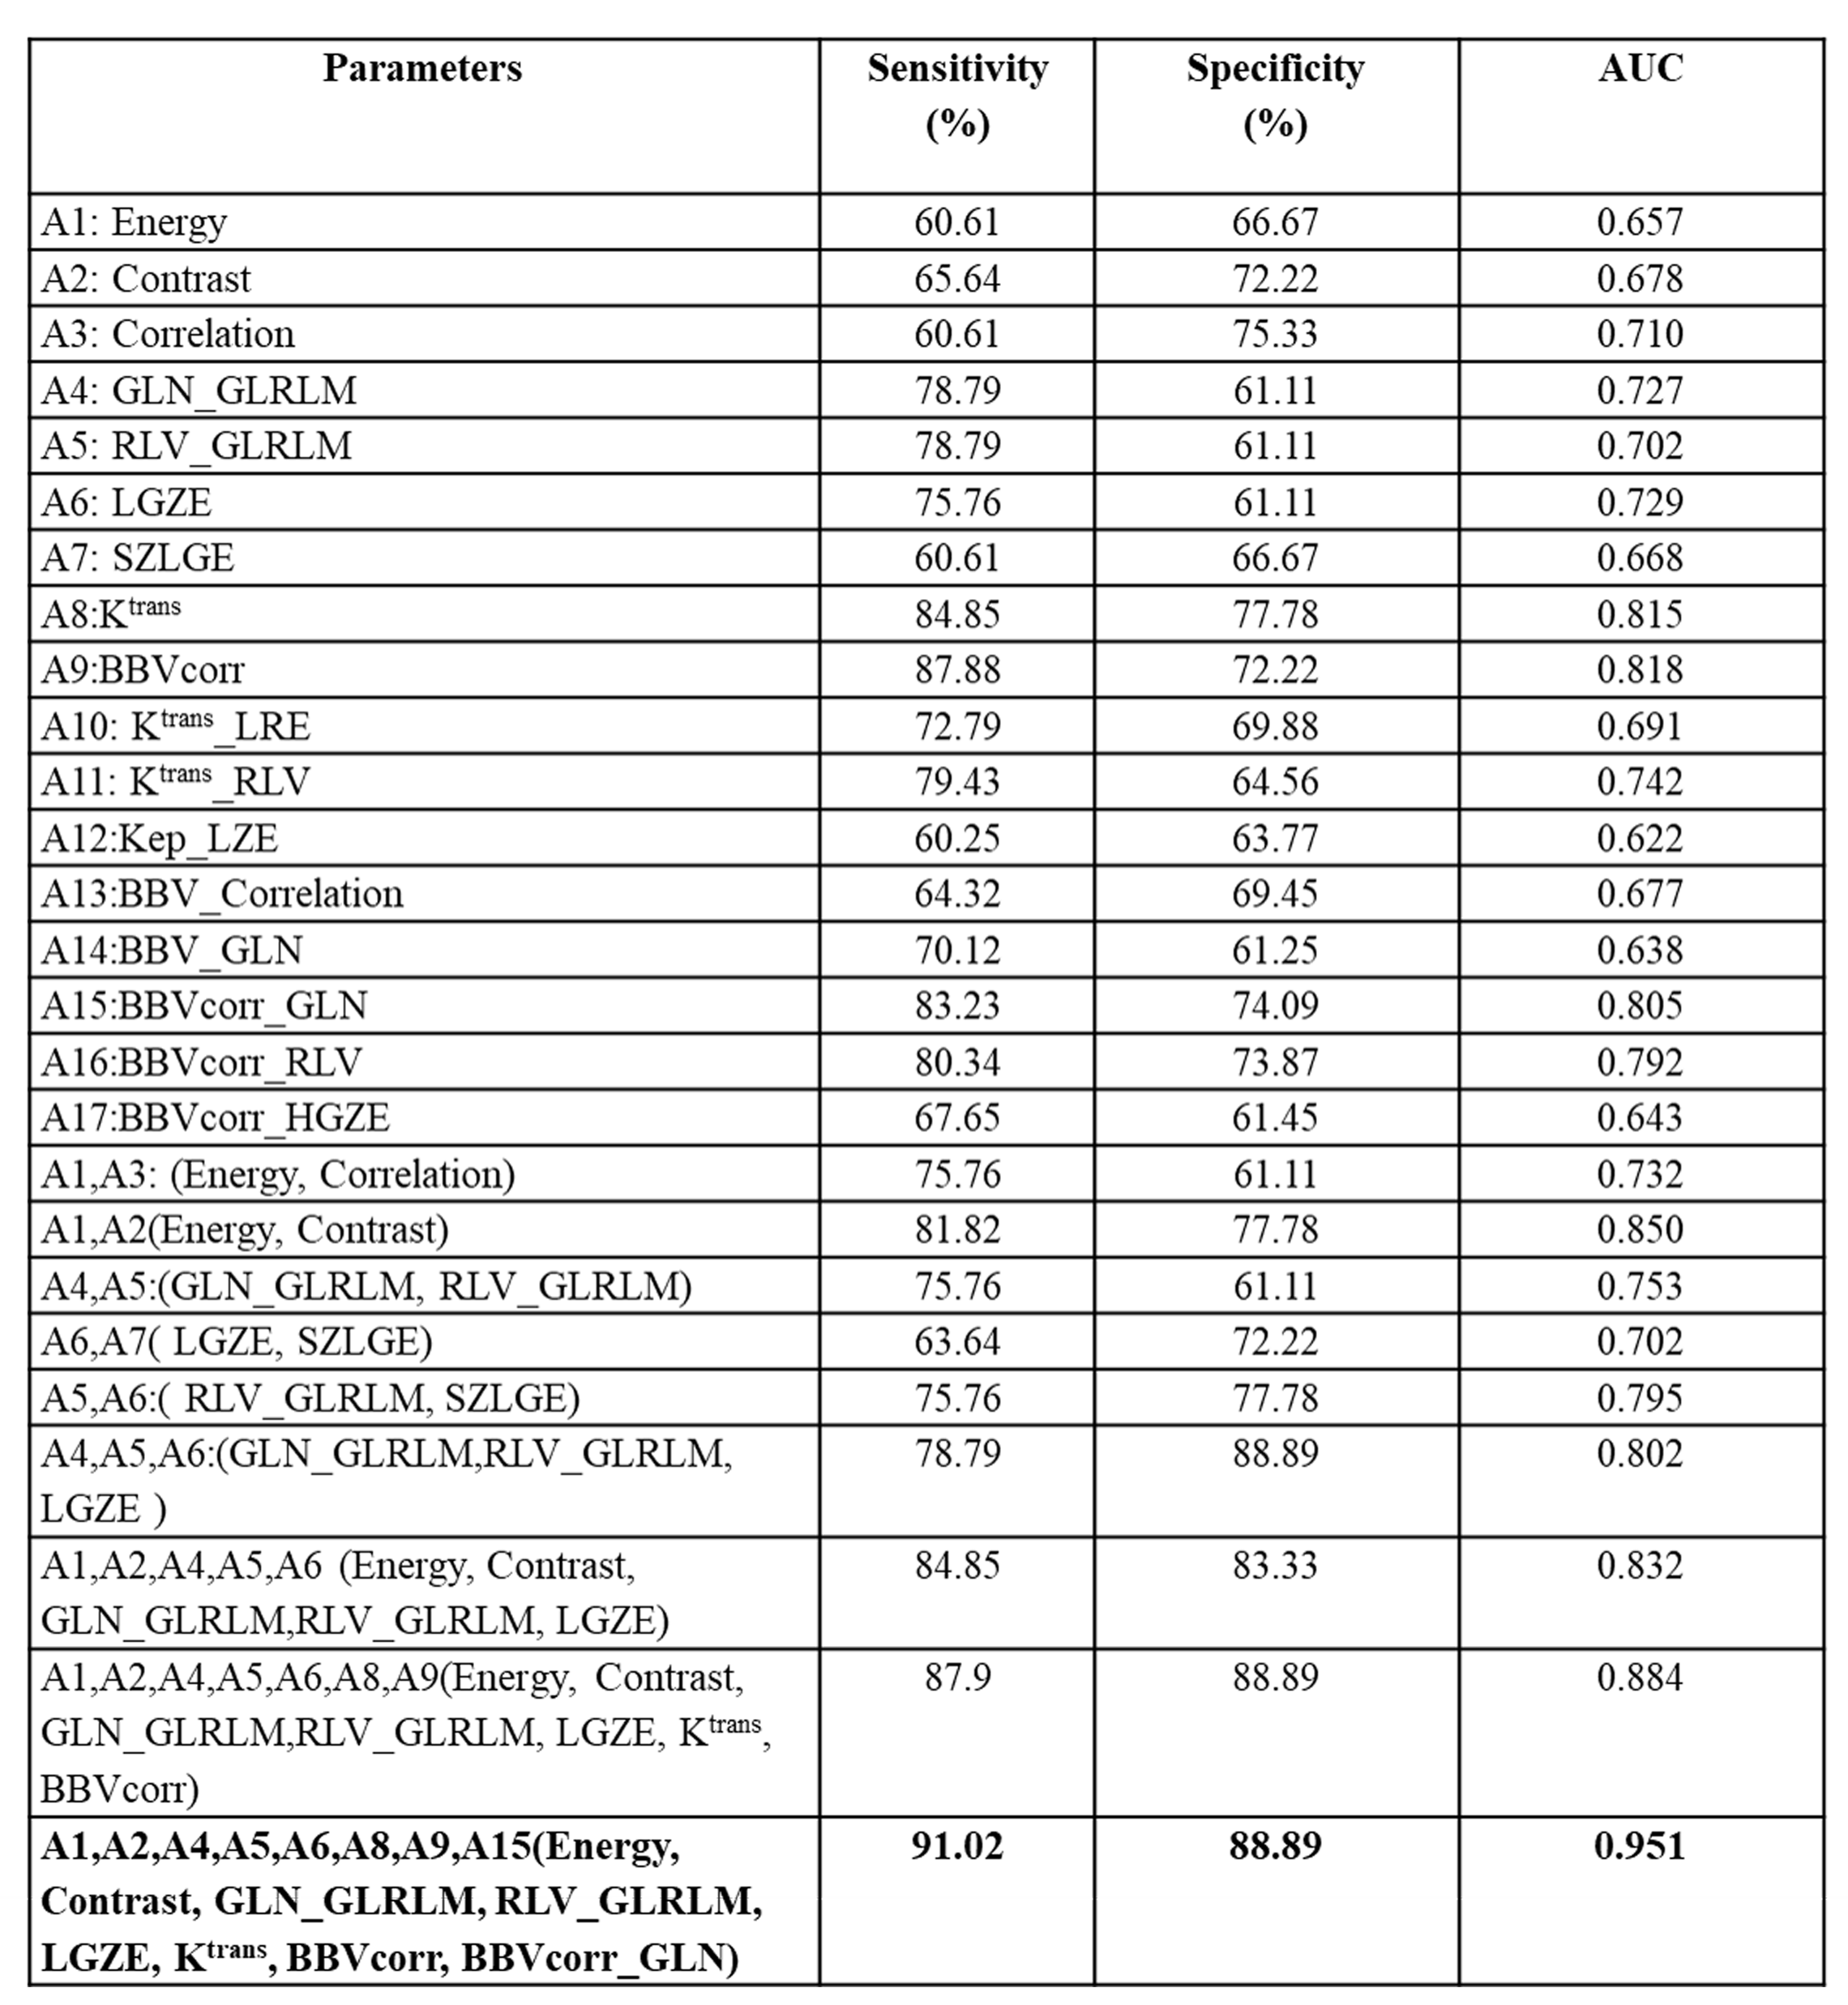
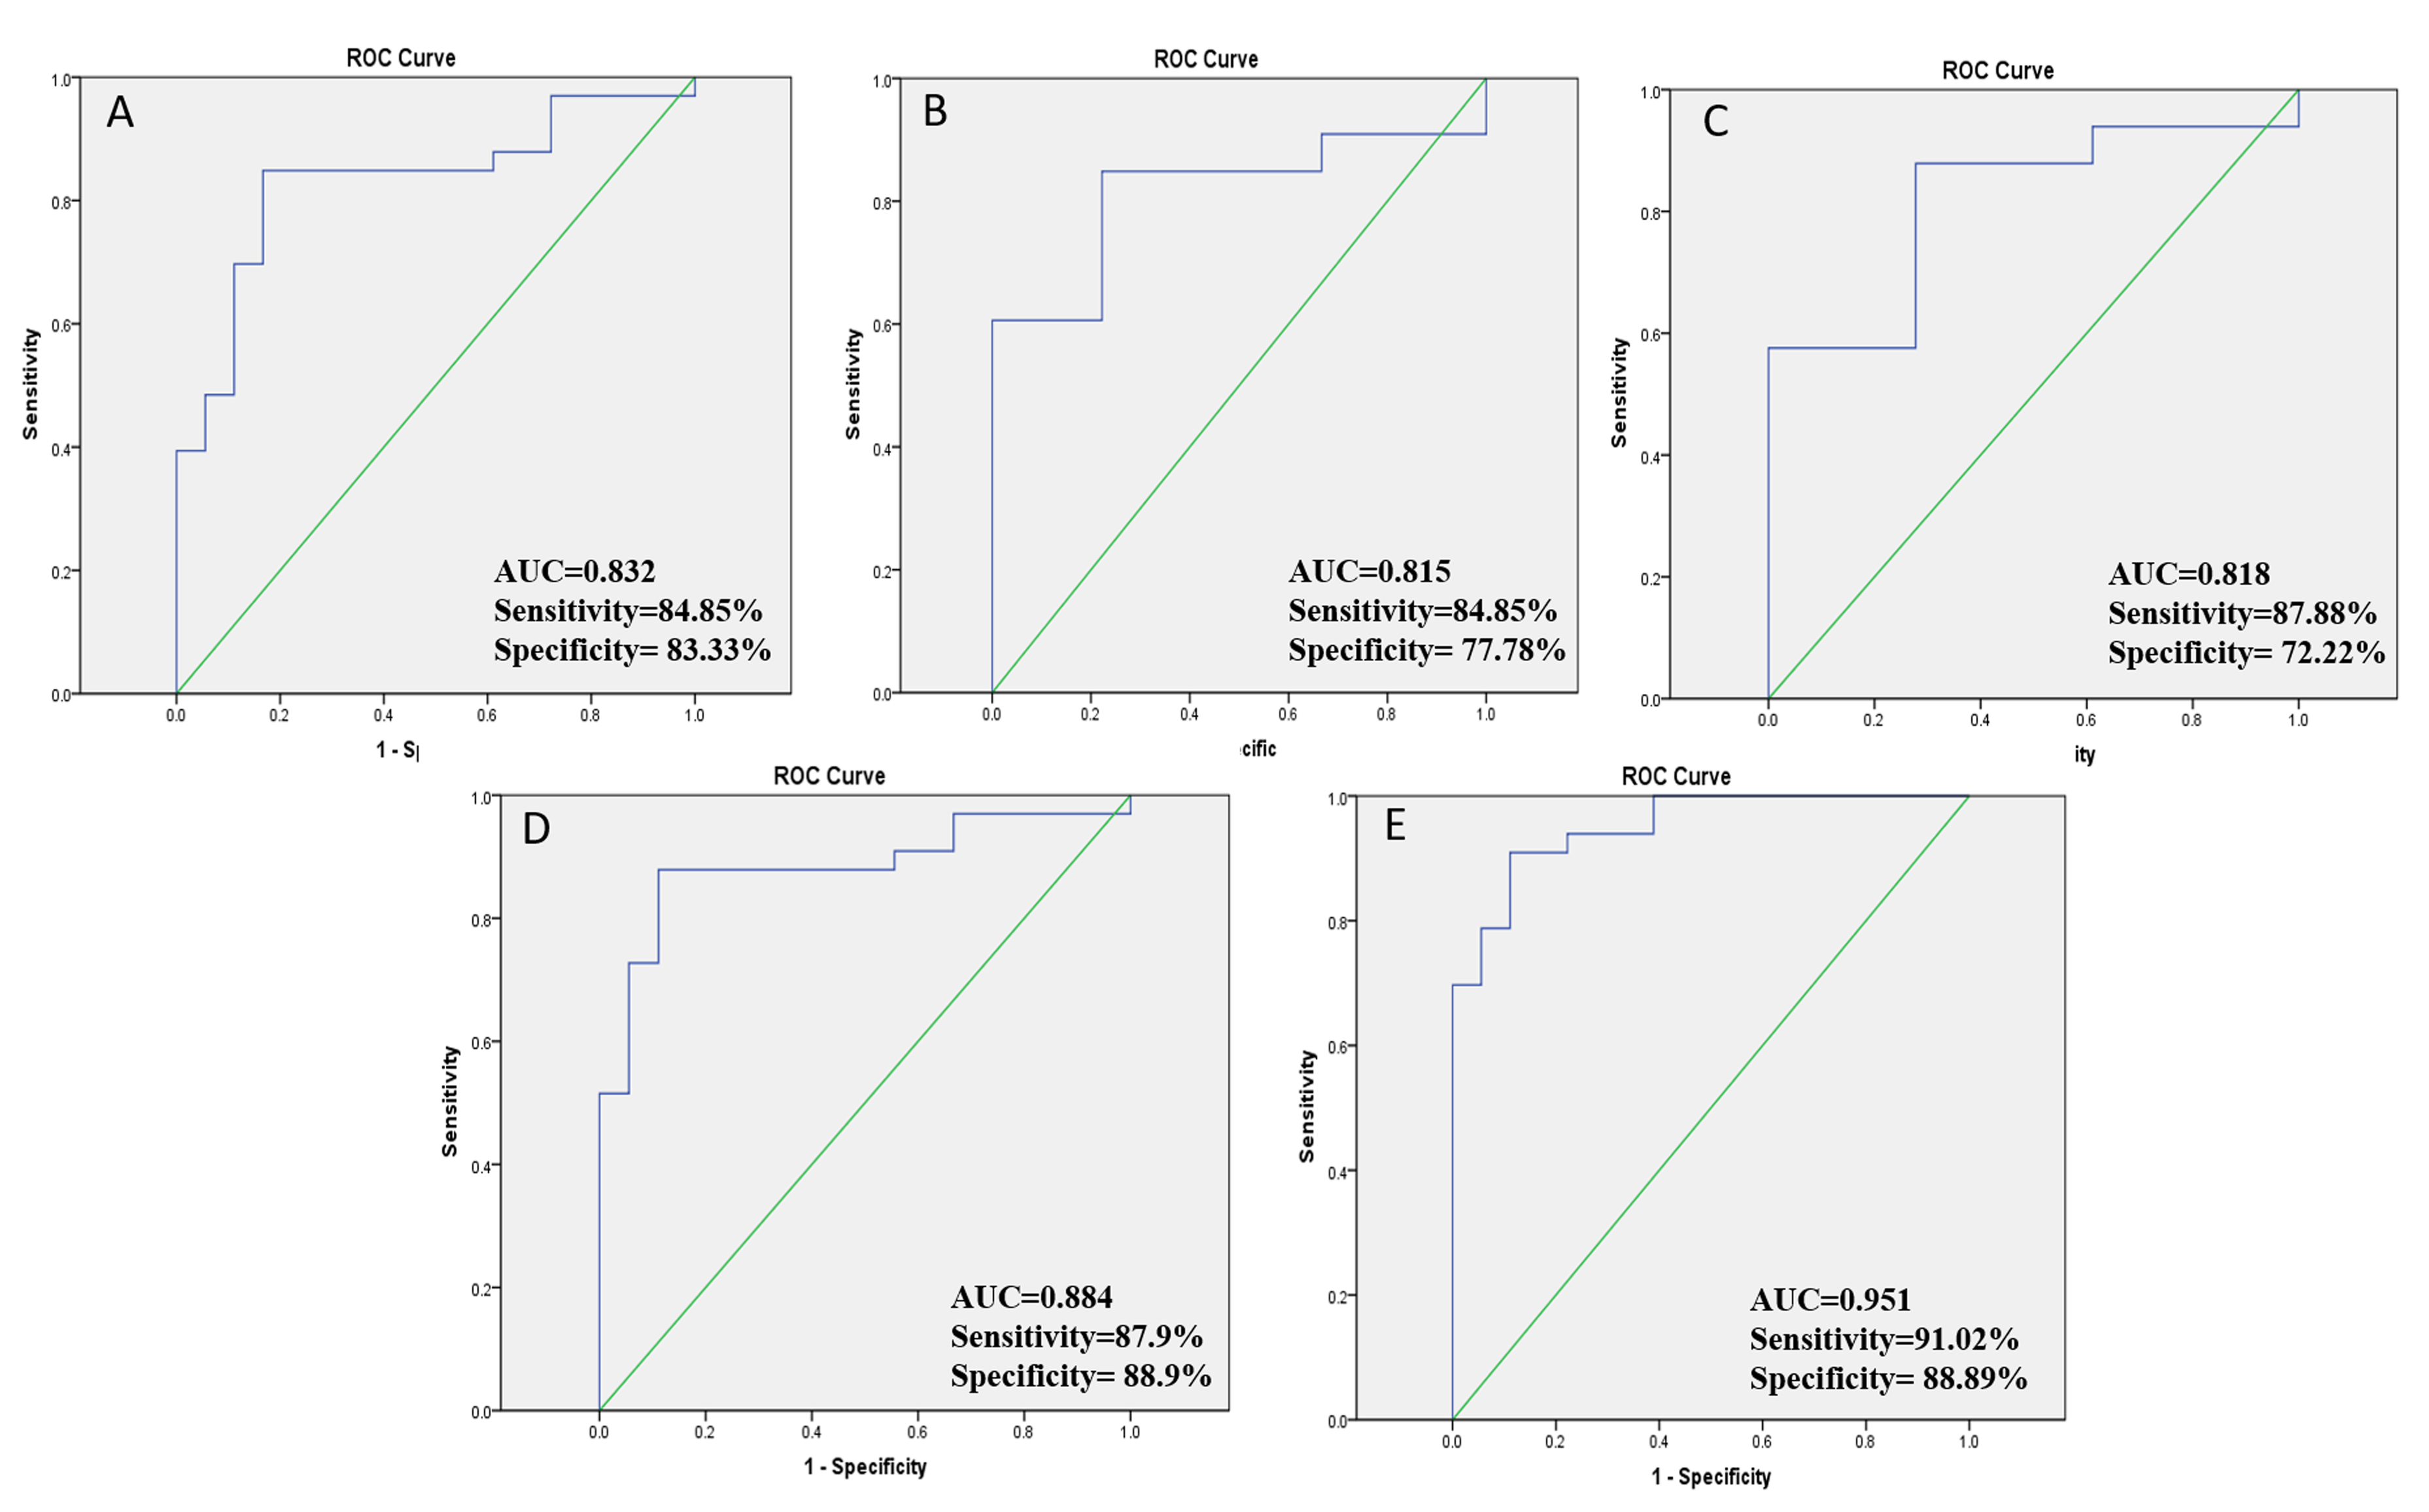
Seven textures features(three GLCM, two GLRLM and two GLSZM) at 40th-time point, two quantitative(Ktrans and BBVcorr) features and nine texture features on BBVcorr quantitative maps(two GLCM, four GLRLM and three GLSZM) provided statistically significant(p<0.05) difference between ILC and IDC(Table-II). ROC curve analysis for these significant features is represented in Table-III. Individually, GLN_GLRLM, RLV_GLRLM, Ktrans_RLV, BBVcorr_GLN and BBVcorr_RLV achieved higher sensitivity and specificity in separating IDC and ILC ROIs among all texture features. Combination of energy, contrast, RLN_GLRLM, RLV_GLRLM, LGZE, Ktrans, BBVcorr and BBVcorr_GLN features provided highest 91.02% sensitivity and 88.89% specificity(AUC=0.951) among all feature combinations studied in characterizing of ILC and IDC ROIs (Figure-2).DISCUSSION:
No texture features among NGTDM method provided significantly different between ILC and IDC lesion whereas GLRLM texture features provided maximum significant value in this study. In tracer kinetic model, Ktrans found statistically significant(p<0.05) difference between these groups which is also in agreement with previously reported study4 whereas BBVcorr also found statistically significant(p<0.05). Combination of texture and quantitative features worked well for differentiating between ILC and IDC lesions. These are preliminary results with small number of patients. More data sets should be investigated in future studies.CONCLUSION:
Combination of texture and quantitative features provided highest sensitivity and specificity in differentiating IDC and ILC lesions which might be used for diagnostic and treatment purpose.Acknowledgements
The authors acknowledge an internal grant from IIT-Delhi and technical support of Philips India Limited in MRI data acquisition. We thanks, Prof. RKS Rathore for technical support in DCE-perfusion analysis; Dr. Indrajit Saha for providing technical support for MRI data acquisition; Dr. Vedant Kabra for clinical input.References
1. Ali I, Wani WA, Saleem K (2011) Cancer Scenario in India with Future Perspectives. Cancer Ther 8:56–70. Li CI, Anderson BO, Daling JR, Moe RE. Trends in incidence rates of invasive lobular and ductal breast carcinoma. JAMA 2003;289:1421–1424.
2. Li CI, Anderson BO, Daling JR, Moe RE. Trends in incidence rates of invasive lobular and ductal breast carcinoma. JAMA 2003; 289:1421–1424.
3. Chen Z, Yang J, Li S, Lv M, Shen Y, Wang B, et al. (2017). Invasive lobular carcinoma of the breast: A special histological type compared with invasive ductal carcinoma. PLoS ONE 12(9): e0182397.
4. Ritse M. Mann, Jeroen Veltman, Henkjan Huisman and Carla Boetes. Comparison of Enhancement Characteristics Between Invasive Lobular Carcinoma and Invasive Ductal Carcinoma. Journal of Magnetic Resonance Imaging 34:293–300 (2011).
5. Khouli RH El, Macura KJ, Kamel IR, et al (2011) 3 Tesla Dynamic Contrast Enhanced Magnetic Resonance Imaging of the Breast: Pharmacokinetic Parameters versus Conventional Kinetic Curv. AJR AM J Roentgenol 197:1498–1505.
6. Ahmed A, Gibbs P, Pickles M, Turnbull L.Texture analysis in assessment and prediction of chemotherapy response in breast cancer. J Magn Reson Imaging. 2013 Jul;38(1):89-101.
7. Haralick R, Shanmugam K, and Dinstein I, Textural Features for Image Classication, IEEE Transactions on Systems, Man, and Cybernetics, vol. SMC-3, no. 6, pp. 610-621, Nov. 1973.
8. Galloway M, Texture analysis using gray level run lengths, Computer Graphics and Image Processing, Volume 4, Issue 2, 1975, Pages 172-179.
9. Thibault, G., Fertil, B., Navarro, C., Pereira, S., Cau, P., Levy, N., Sequeira, J. and Mari, J.J., Texture indexes and gray level size zone matrix application to cell nuclei classication. 2009. 10. M. Amadasun and R. King, Textural features corresponding to textural properties, in IEEE Transactions on Systems, Man, and Cybernetics, vol. 19, no. 5, pp. 1264-1274, Sep/Oct 1989
Figures