3426
qMapIt, a multi-parametric analysis platform for ImageJ1Department for Diagnostic and Interventional Radiology and Nuclear Medicine, University Medical Center Hamburg-Eppendorf, Hamburg, Germany
Synopsis
Workstations are expensive and the access is often limited. We developed several ImageJ-plugins to build the basis for a multi-parametric imaging platform for ImageJ. ImageJ is a flexible and extendable image processing software that runs with Windows, MacOS and Linux. With qMapIt the researcher has a graphical user interface to selectively import DICOM files and to perform multi-core supported data analysis. Whether relaxation time analysis for T1, T2, T2*, T1ρ, or various diffusion models, or velocity mapping, or vessel size imaging, or pharmacokinetic modelling you name it. Every step can also be addressed in a macro script to automate the workflow. To reduce programming overhead and to speed up the plugin development a fitting and visualisation framework is embedded.
Introduction
Experimental measurements require usually specialized software. Access to vendors’ workstations is often limited or does often not fulfil the needed specifications. Generally then an own software product is developed which only focuses on this single application. We developed over the years several ImageJ-plugins for quantitative image analysis wrapped in a common graphical user interface called qMapIt. qMapIt offers researchers a standardised platform with minimised user input and to build processing pipelines. ImageJ1 is a Java based data processing tool that runs with Windows, MacOS, and Linux and has an extendable plugin concept. Plugins can be easily distributed and installed. Additionally, we implemented frameworks for a convenient selective DICOM data import, as well as for fitting and visualization which allows a fast plugin development. All plugins can be used in macro scripts to automate complex workflows.Methods
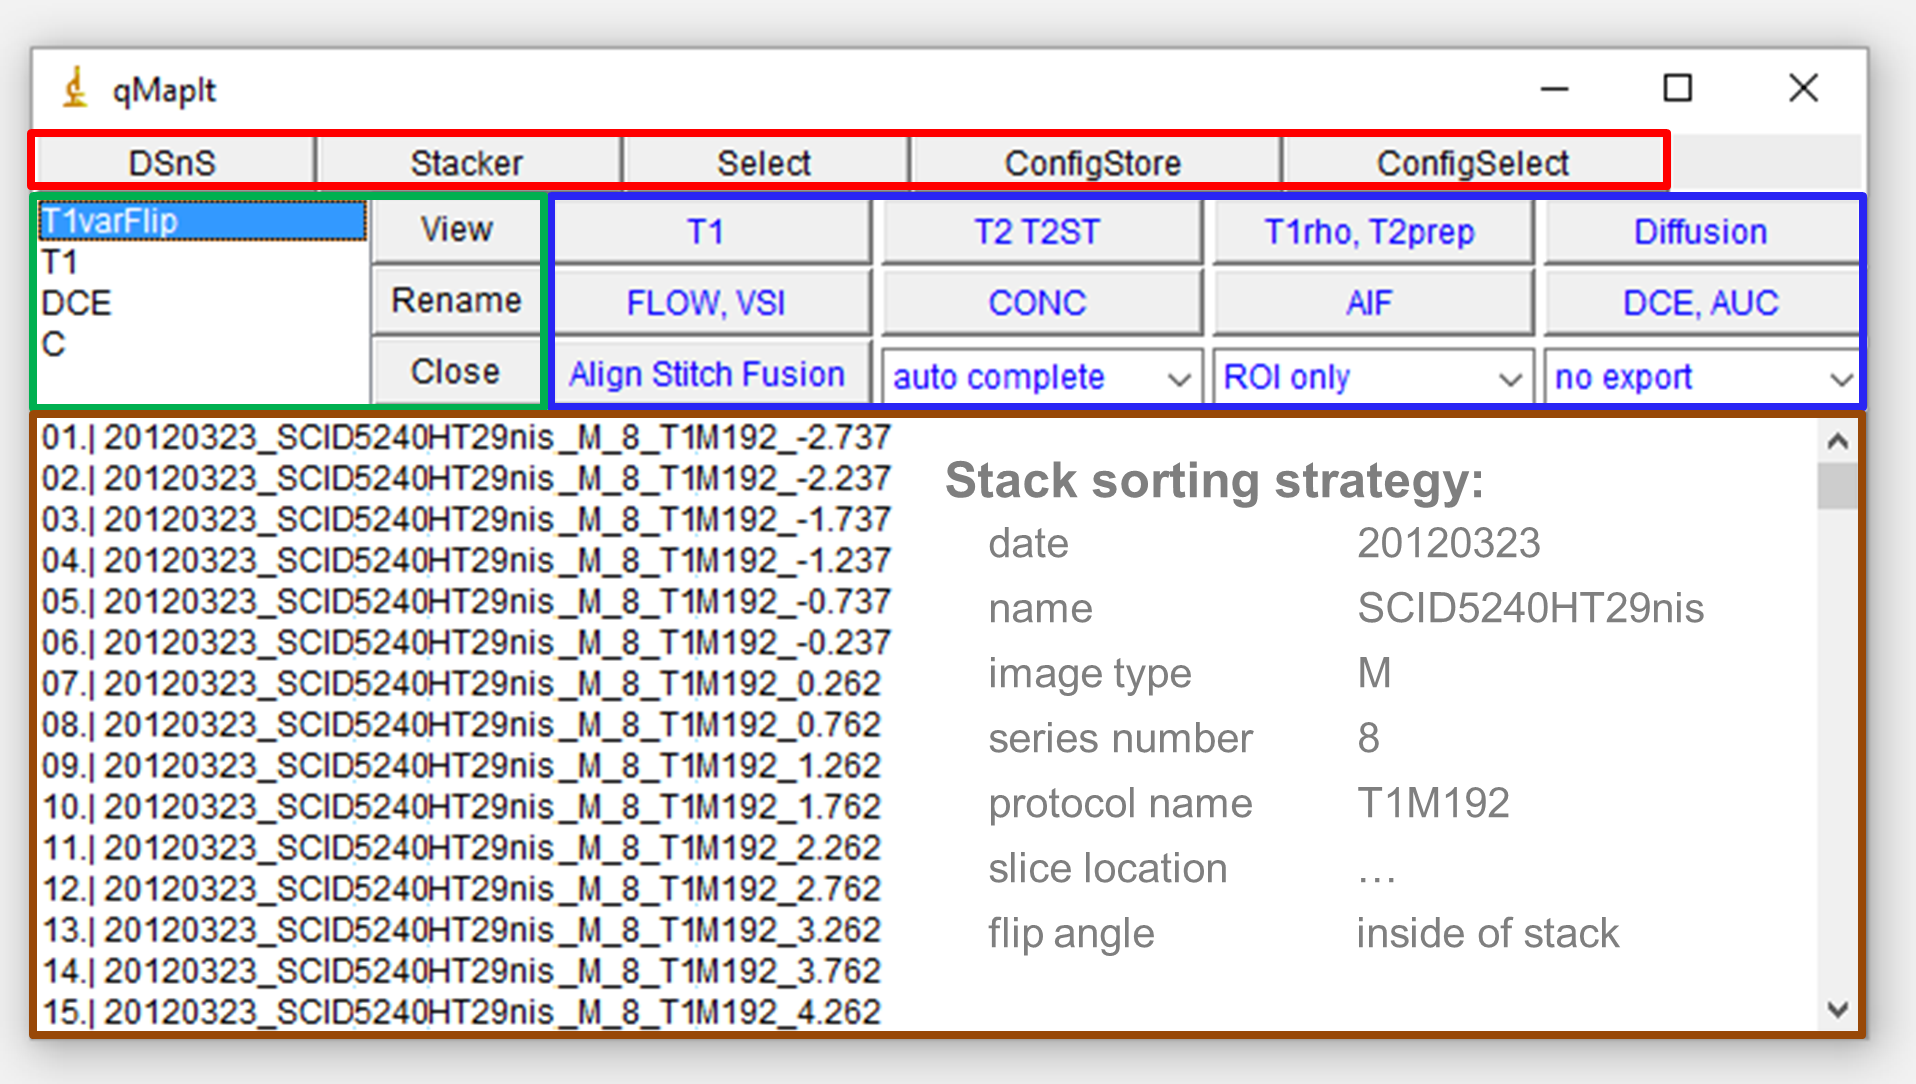
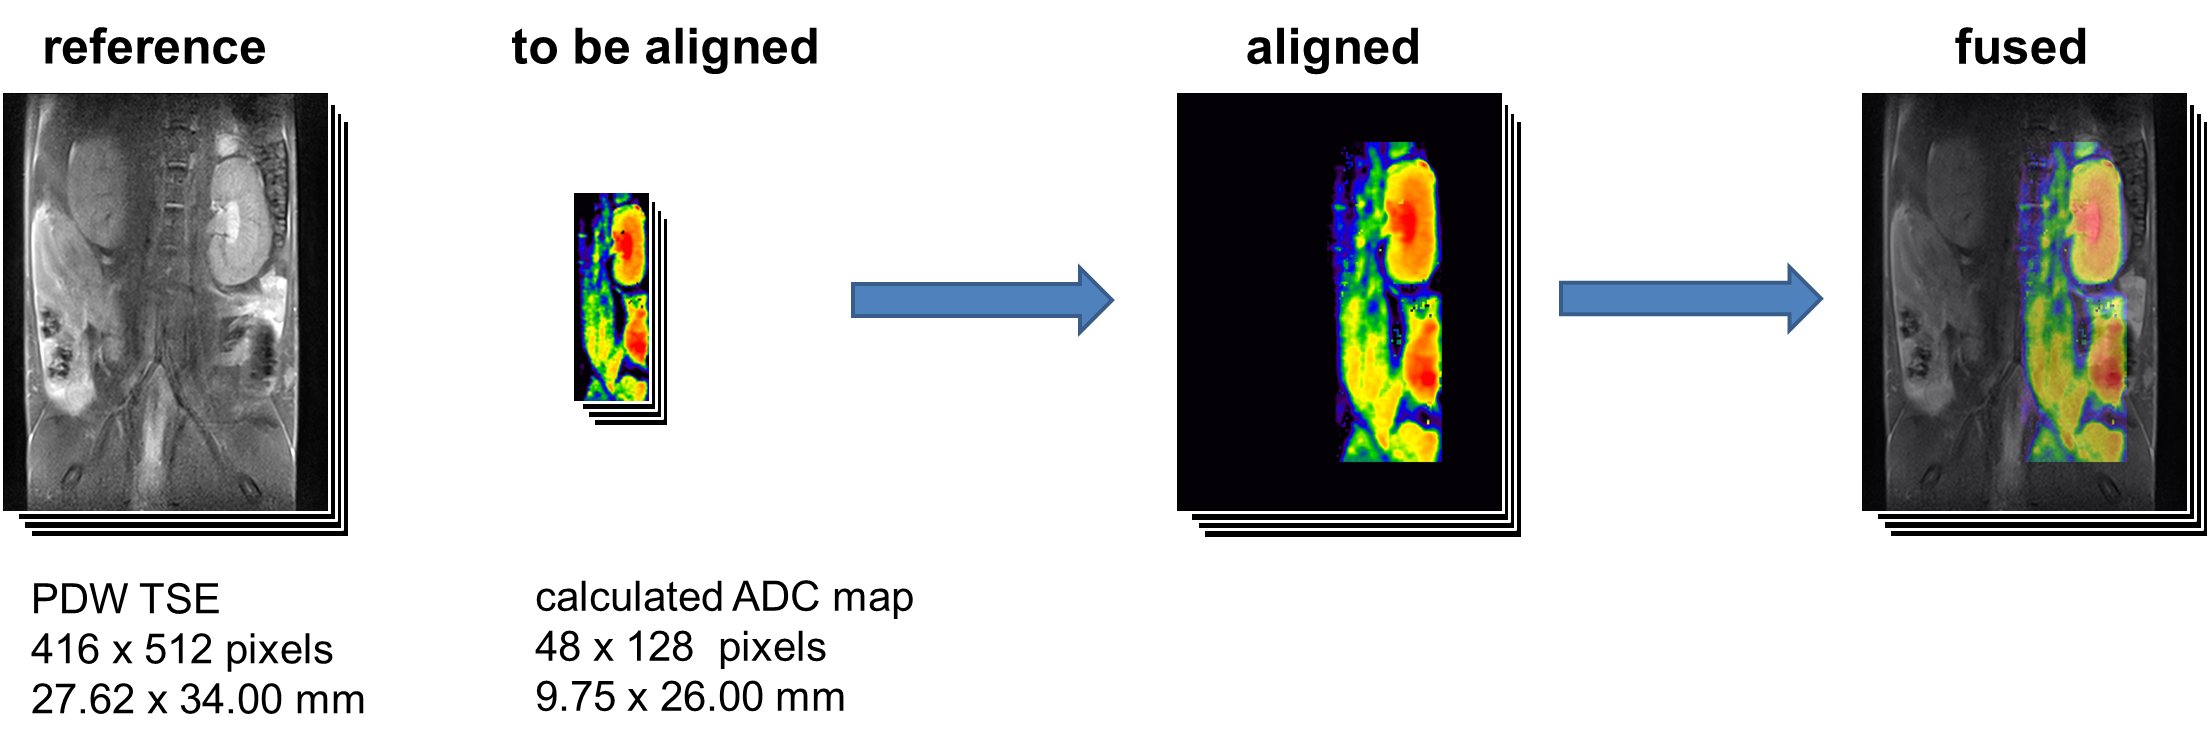
A central role in the workflow plays the selective DICOM import managed by the plugin DicomSort’n’Select (DSnS). It sorts and selects DICOM files and is also capable to extract dedicated technical information which can be passed to other plugins to minimize user input. DSnS is fully configurable and automatable. qMapIt, a graphical user interface (figure 1) and a session management tool, administrates the imported data and processing. Several quantitative analysis tools are incorporated. The calculated images are automatically displayed in a hyperstack. In its window all calculated parameter maps for all slices are accessible. This presentation form eases region of interest based analysis as ImageJ can generate result tables for all calculated parameters. Additionally, this window is interactive. Moving a mouse over it will open a window where the fitted model curve and measured data is plotted. Calculated maps can be stored using the DICOM library DCM4CHE2. The session management offers also methods to align and stitch several imported sessions in respect to their slice position and resolution. Aligning is e.g. used to calculate concentration time maps from dynamic contrast enhanced measurements and T1-map. Image fusion is also accessible. From the programmers’ perspective, most of the plugins utilize an implemented fitting and visualization framework which simplifies and speeds up the plugin development. The fitting framework has two implementations of non-linear least squares optimisation algorithms3,4 (Levenberg-Marquardt and Powell Dogleg) with covariance analysis for the estimation of standard errors. It supports multi-core processing5 and features multi-pass fitting with interleaved post-processing.Results
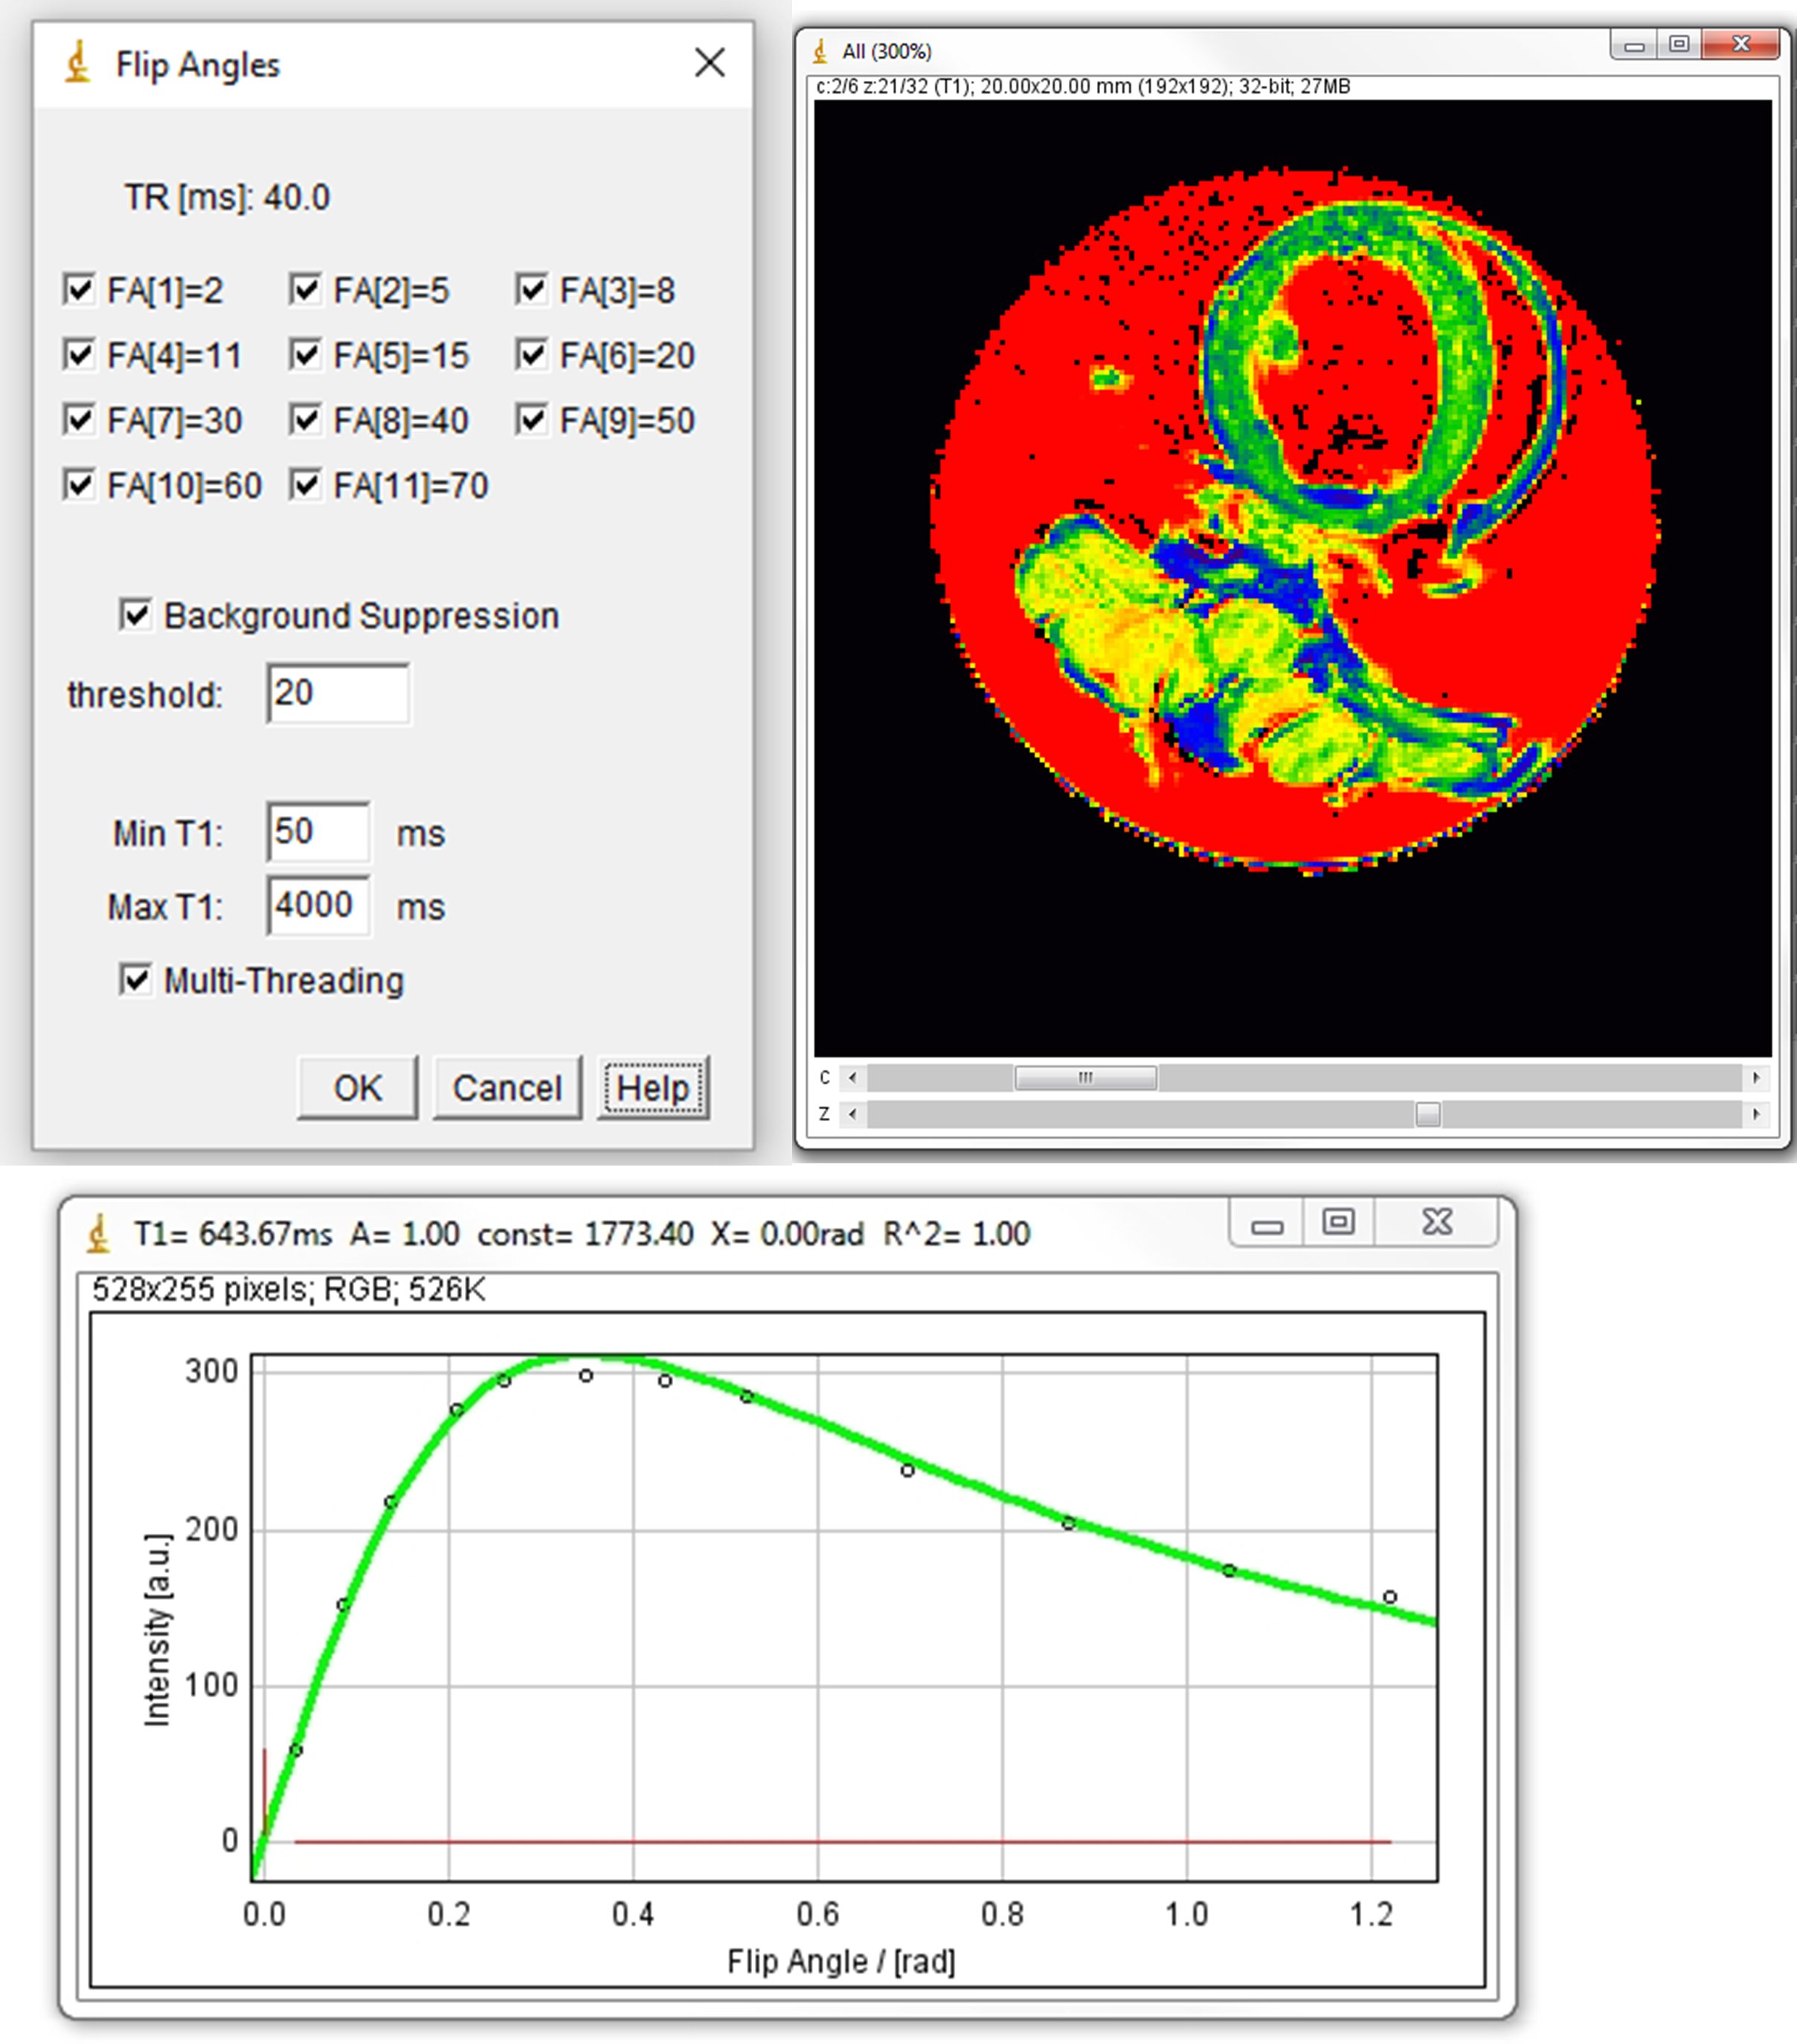
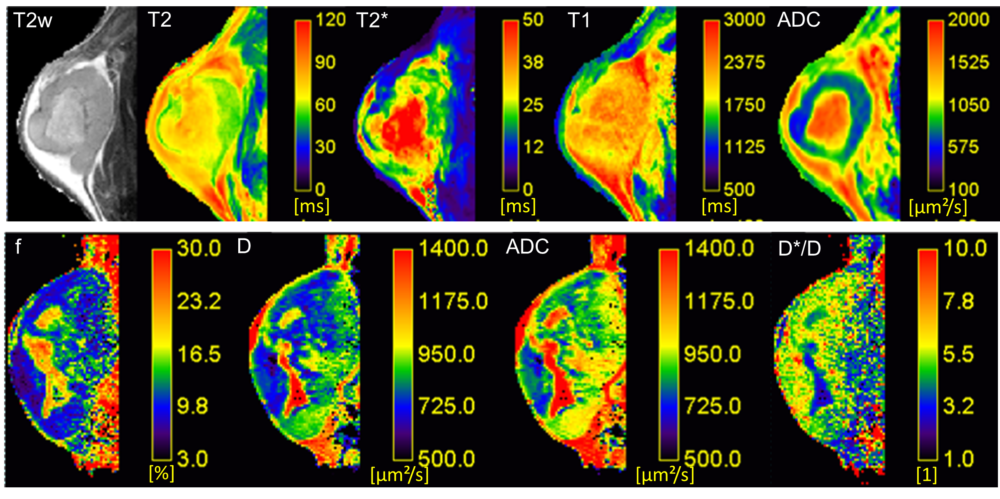
The following tools are available (see figures 2-5)- Relaxation time maps: T1 (variable flip angle, saturation/inversion recovery), T2 (also with T2Prep), T2*, T1ρ
- Diffusion maps by various models: Apparent Diffusion Coefficient (ADC), IntraVoxel Incoherent Motion (IVIM: f, D, D*), (stretched) kurtosis, (truncated) gamma distribution
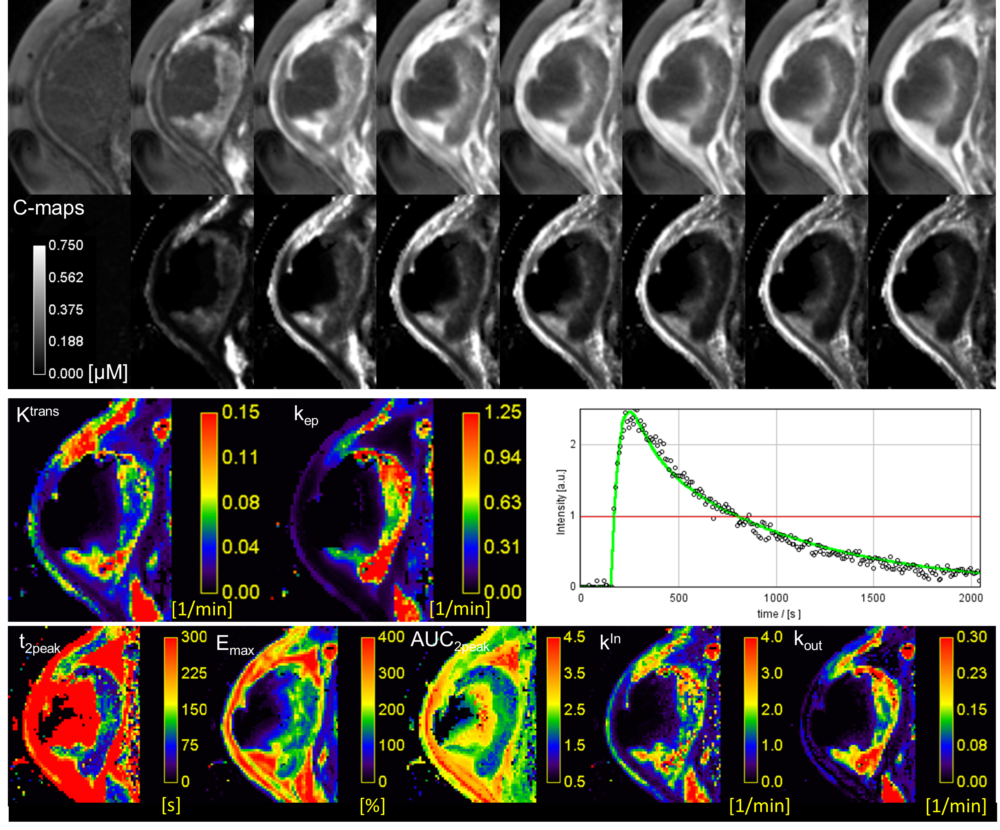
- Merging T1-maps with 4D-scans and pharmacokinetic modeling (Tofts): Ktrans, kep, ve, vp, AUC, AUMC, MRT, time-to-peak etc.
- Phase contrast velocity mapping with phase unwrapping
- Vessel size imaging (Tropès): VSI, BVf, Q
- Quantitative susceptibility mapping (in preparation)
- Aligning, stitching, and fusion of images
Discussion and Conclusion
qMapIt and its accompanying plugins give access to multi-parametric imaging with all features of the mighty ImageJ. It is support multicore processor technology, so it is fast, easy distributable and accessible from Windows, MacOS and Linux.Acknowledgements
Courtesy to my collegeous: C. Jung, E. Koziolek, P. Konietzke, T. Frenzel, H. Guerreiro, M. MoriReferences
[1] Schneider CA et al., Nat Methods 2012 Jul;9(7):671-5.
[2] http://www.dcm4che.org/
[3] Moré JJ, Numerical Analysis: Lecture Notes in Mathematics 1978; 630, pp 105-116
[4] http://scribblethink.org/Computer/Javanumeric
[5] Kreft K et al. JavaSPEKTRUM 2005; 03
Figures