3423
An objective tool for diagnosing Prostate Cancer and Benign Prostatic Hyperplasia: Radiomics Featuresextracted from Diffusion-weighted ImagingLihua Chen1, Ailian Liu1, Yan Guo2, Xin Li3, and Dan Guo1
1The First Affiliated Hospital of DaLian Medical University, Dalian, China, 2GE Healthcare, China, ShenYang, China, 3GE Healthcare, China, GuangZhou, China
Synopsis
Prostate cancer is the second most common cancer for men, and it has high leading cause of cancer death among men. The term radiomics has attracted increased attention in recent years, and it is the process of the conversion of medical images into high-dimensional, mineable data via high-throughput extraction of quantitative features, followed by subsequent data analysis for decision support.The aim of this study was to evaluate radiomics as a tool to distinguish PCa from BPH based on diffusion-weighted imaging (DWI) sequence without subjective factors.
Introduction
Prostate cancer is the second most common cancer for men, and it has high leading cause of cancer death among men. The term radiomics has attracted increased attention in recent years, and it is the process of the conversion of medical images into high-dimensional, mineable data via high-throughput extraction of quantitative features, followed by subsequent data analysis for decision support [1-2].The aim of this study was to evaluate radiomics as a tool to distinguish PCa from BPH based on diffusion-weighted imaging (DWI) sequence without subjective factors.Purpose
To evaluate the usefulness of radiomics features indistinguishing prostate cancer (PCa) from benign prostatic hyperplasia (BPH) based on diffusion-weighted imaging (DWI) sequence without subjective factors.Materials and Methods
This retrospective study was approved by local IRB, and written informed consent was waived. 200 patients with PCa or BPH who underwent MRI exams between January 2010 and February 2017 were enrolled in this study. Among them, 100 were PCa and 100 were BPH, confirmed by pathologically. Inclusion criteria were as follows: patients first underwent MRI exams followed by surgery or biopsy within one month, prior to treatment. All MRI scans were performed on a 3.0T scanner (GE-Signa HDXT, Milwaukee) with an eight-channel phased-array body-coil. DWI maps were extracted using an EPI sequence with b = 1000sec/mm2.High-throughput extraction and analysis of the radiomic features based on DWI mainly included five key procedures: 1) data pre-processing and segmentation was performed by two radiologists, who respectively had 3 years and 1 year experience in prostate imagingwho were blind for pathology, 2D region of interest (ROI) was sketched along the edge of the whole prostate gland at the slice with the maximum diameter of the lesion.2) 397 radiomics features, including size and shape based–features, histogram and GLCM (Gray-Level Co-occurrence Matrix) as well as GLRLM (Gray-Level Run Length Matrix) texture features were generated automatically using Analysis-Kinetics software (GE Healthcare, China). 3) Statistical analysis was conducted with R software (version 3.3.2;http://www.Rproject.org). Dimensionality reduction was based on t test, Kruskal-Wallis test and auto-correlation analysis. 4) Model construction: 70 PCa and 70 BPH who were time-dependent selected in 200 patients were used to supervised Model-learning and Logistic regression model was used. Incorporated the patients age, DWI signal characteristics and total prostate specific antigen (TPSA) value, and this was presented with a radiomics nomogram.5) Model validation: 30 PCa and 30 BPH were used and compared with pathologic diagnosis, in which confusionmatrix and receiver operating characteristics (ROC) were used to assess the efficiency of model. Calibration Curve and Decision Curve were used to evaluate the clinical application value of nomogram.Results
The area under the curve (AUC) of Logisticregression model in discriminating the two groups for training group and verification group 0.900 and 0.834, sensitivity were 82.9% and 73.3%, specificity were 85.7% and 93.3%(fig 1), with 75% diagnosis accuracy rate. The analysis results of Calibration Curve(fig 2) and Decision Curve(fig 3) showed that nomogram included the clinical parameters has good clinical application value.Discussion and Conclusion
Compared with traditional manual method, Radiomics features not only could lighten the visual fatigue for radiologist but also raise the precision of diagnosis. Radiomics features of DWI performed well indistinguishing PCa from BPH, which could help objectively and quantitatively evaluate tumor heterogeneity, and have prospect of being an independent &non-invasive efficient diagnostic tool.Acknowledgements
No acknowledgement found.References
[1] Aerts HJ, Velazquez ER, Leijenaar RT, et al: Decoding tumour phenotype by noninvasive imaging using a quantitative radiomics approach. Nat Commun 5:4006, 2014 [Erratum: Nat Commun 5:4644, 2014].[2]. Gillies RJ, Kinahan PE, Hricak H: Radiomics: Images are more than pictures, they are data. Radiology 278:563-577, 2016.Figures
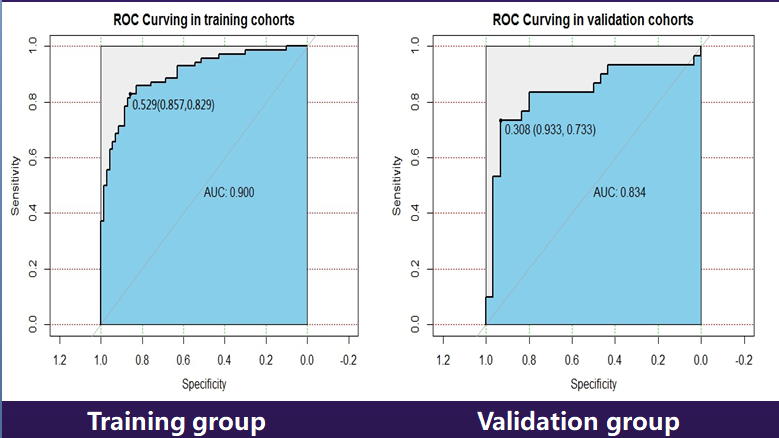
The area under the curve (AUC) of
Logistic regression model in training group and validation group was 0.900 and
0.834, specificity and sensitivity were respectively 85.7% ,93.3% and 82.9%,
73.3% with 75% diagnosis accuracy rate.
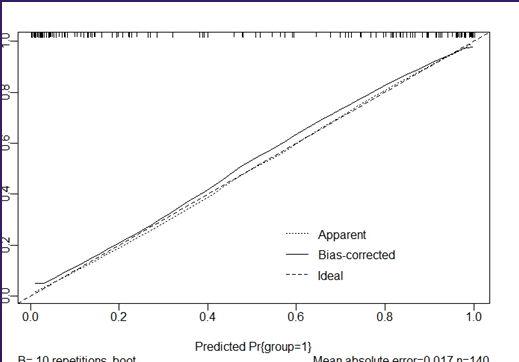
The Calibration Curve of nomogram
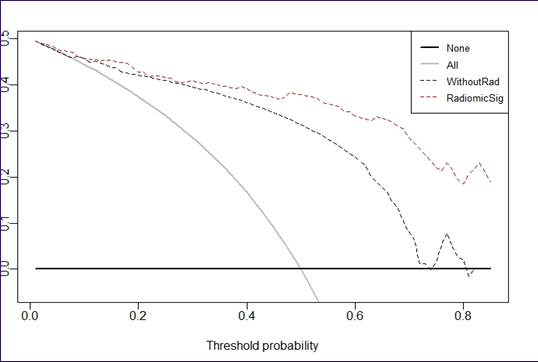
The Decision Curve of nomogram