3422
An improved automatic localization method for abnormal lumbar vertebrae using MR Images1College of Engineering, Peking University, Beijing, China, 2Department of Radiology, Peking University First Hospital, Beijing, China, 3Academy for Advanced Interdisciplinary Studies, Peking University, Beijing, China
Synopsis
In this study, we provide an automatic lumbar localization method efficient for abnormal vertebrae based on the local context information of lumbar MR images. The localization results indicate the efficiency of the proposed method for lumbar vertebrae with various abnormalities.
Introduction
Low back pain (LBP) is one of the most prevalent health problems amongst the world’s population and is a leading cause of disability. A strong association between LBP and Modic change has been repeatedly reported in various clinical studies1. This has sparked specific interest in developing methods for automated image analysis of lumbar2. Notably, the localization of vertebrae is the first step in lumbar image analysis. Before localization, candidate detection is necessary. Candidate detection is typically implemented by a sliding window technique, moving a window-based candidate detector over the image grid. Different classification-based detectors were employed, e.g., random forests and support vector machines. Deformable parts model is an efficient method for normal vertebrae feature representation in detection task, which is inefficient for abnormal vertebrae, such as schmorl node and severe Modic changes. Based on the local context information of lumbar MR images, we provide an improved automatic lumbar localization method efficient for abnormal vertebrae.Method
The dataset consists of 100 MRI T2-weighted lumbar scans, acquired under various protocols. The scans contain normal and various abnormal cases. The dataset is split into 22 training and 78 testing images. The scans range in fields of view, containing 7–12 vertebrae starting from the sacrum, with median at 8 per scan. The images were hand-annotated with ground truth as the detection results in Figure1a.
Candidate detection
The vertebrae detection is implemented using a detector constituting latent SVMs on Histogram of Oriented Gradients (HOG) descriptors3. We learn one generic 2D detector for vertebrae bodies (VBs), trained on all VBs in all the training images. For the VB detector, one HOG templates with six parts filters is trained, and the HOG cell size is 8×8 pixels. An iterative learning procedure is employed to pick hard negatives as false positive detections on the negative training images without VBs. During the test time of candidate detection, a sagittal scan is taken as input, and tight bounding boxes around vertebrae candidates are returned as output. Next, a conventional greedy non-maximum suppression (cNMS) algorithm and a modified NMS (mNMS) are employed to remove most of the false positive detections. The mNMS is employed after cNMS as follows to remove the false positive detections with less or no overlapping with any another detection, such as processus spinosus. The lower scoring detection is removed if two bounding boxes overlap 50% along the vertical direction in a sagittal image instead of area.
Detection correction
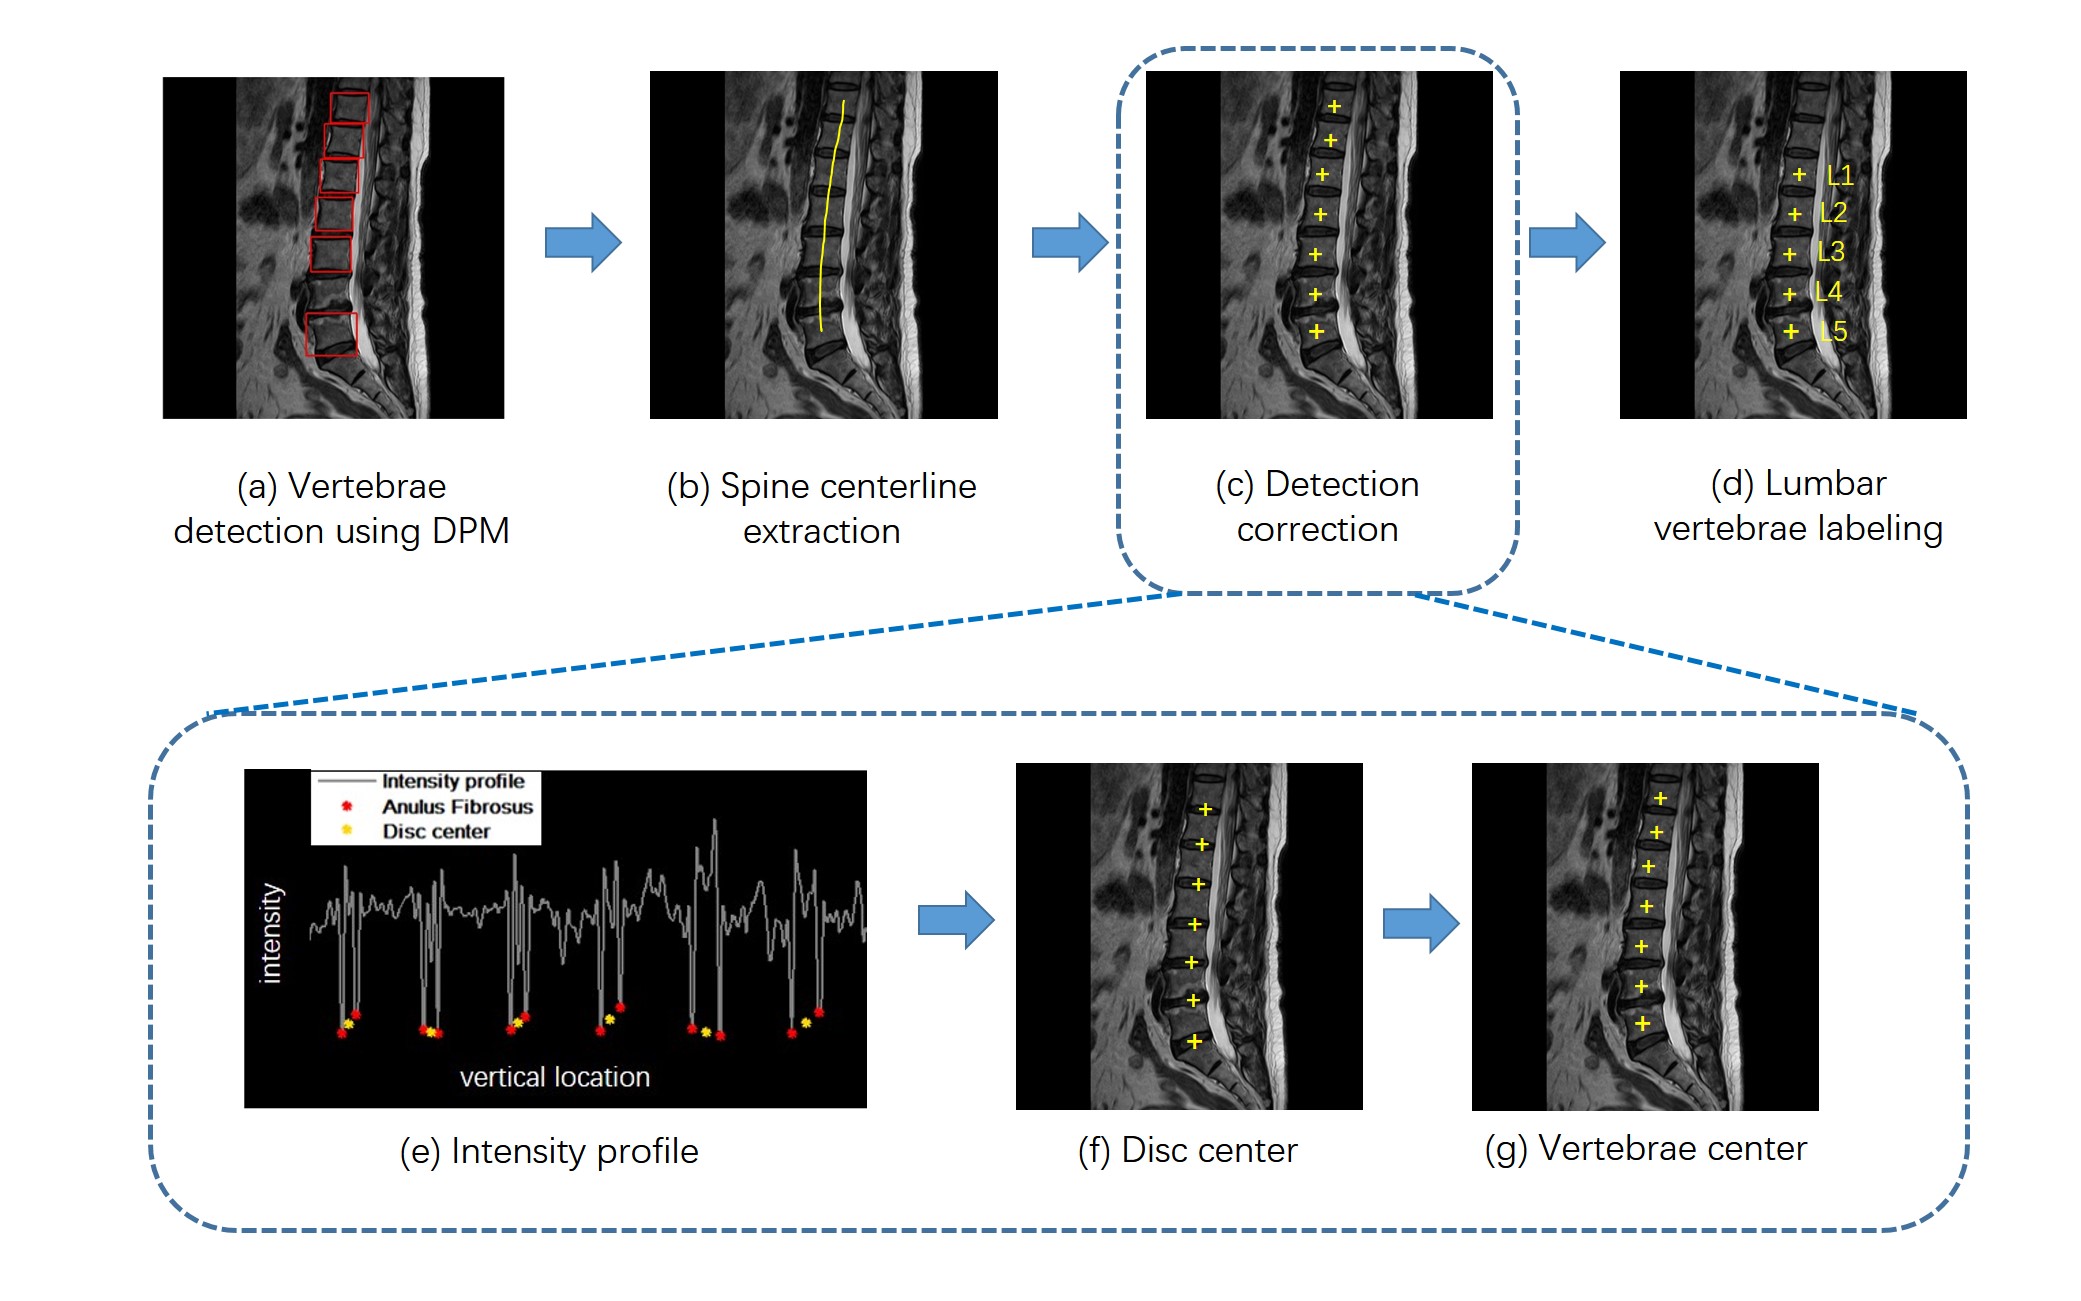
After candidate detection (Figure1a), we need detection correction since the result of the HOG detector is imperfect, containing missing VBs such as that with schmorl node and severe Modic changes. In order to fill missed vertebrae, a spine center curve is extracted according to all detected vertebra candidates (Figure1b). For each point on this curve, we calculate the average intensity over nearest 30 pixels on their respective normals. Then using this intensity curve (Figure1e) along spine center curve, local minimum under 0.1 in the intensity-normalized image can be seen as locations of each Anulus Fibrosus, then the disc center locations are obtained on vertical axis, as in Figure1e. Combining the locations on horizontal axis and vertical axis, the candidate locations of each disc is got on the chosen sagittal slice, as in Figure1f. Then the center of every two candidate disc locations is selected as the candidate locations of each VB (Figure1g). The missing VB candidates can be retrieved according the locations by comparing the candidates detected by HOG detector and the corrected ones (Figure1c). After candidate detection and correction, the bottom location is considered as the fifth lumbar (L5) VB since the sacrum vertebrae is not detected, and then the L1-L4 VB are localized successively (Figure1d). The main framework is shown in the Figure1.
Results
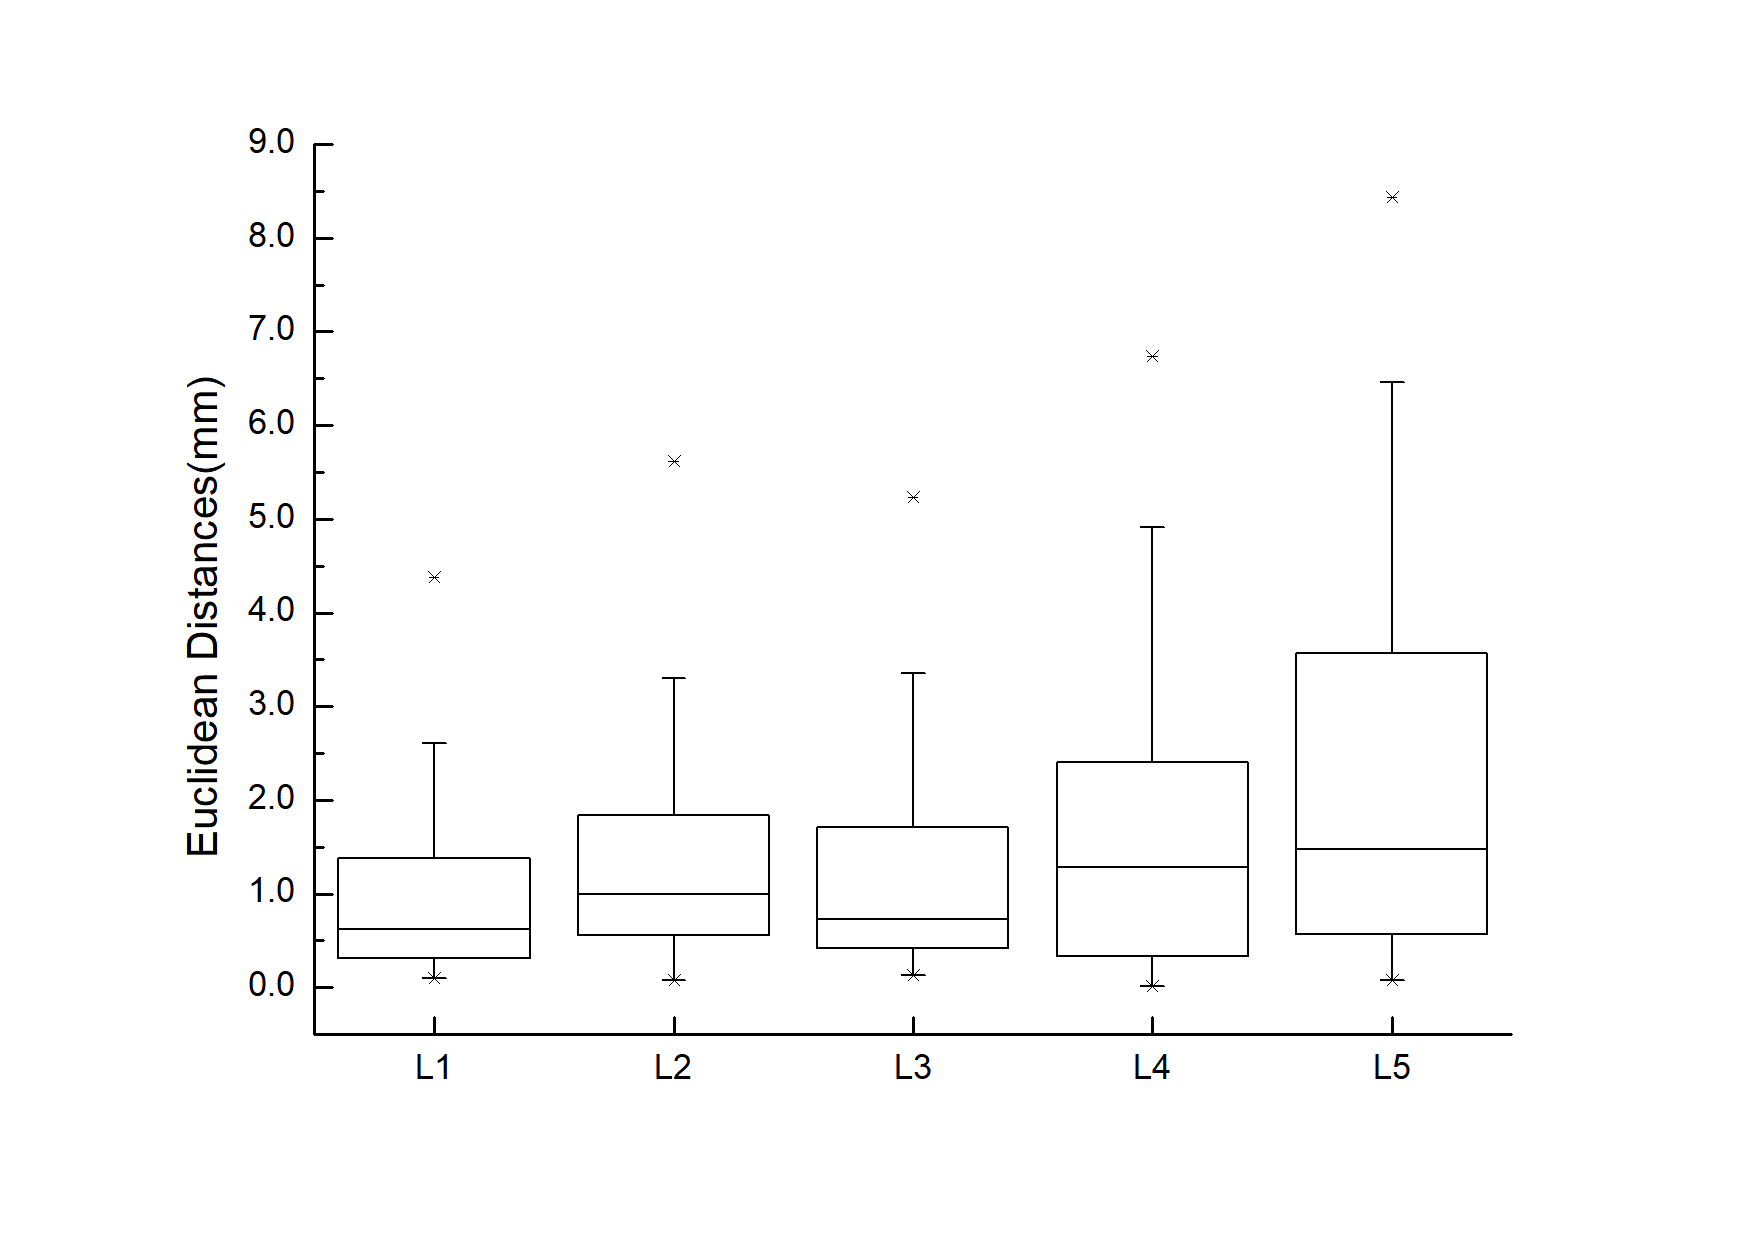
We achieve 91.0% correct localization rate for the lumbar vertebrae on a set of 78 test images with various abnormal cases, with an improvement of 6.4% compared to the algorithm without detection correction (84.6% -> 91.0%). Representative examples are shown in Figure2 and statistical results on localization error over the test set are plotted in Figure3. Figure2 shows that Schmorl node and Modic changes VBs are missing using HOG-based detector, which are retrieved correctly by detection correction.Conclusion
We have improved an automatic method based on local context to localize vertebrae in lumbar MR images that is accurate and efficient for various abnormalities, especially for Schmorl node and Modic changes VBs. This improved method provides an efficient tool that can be conveniently used for the automated disease and abnormality analysis of lumbar.Acknowledgements
No acknowledgement found.References
[1] Cheung K M C, et al. Spine, 2009, 34(9): 934-940.
[2] Rak M, et al. IJCARS, 2016, 11(8): 1445-1465.
[3] Felzenszwalb P F, et al. TPAMI, 2010, 32(9): 1627-1645.
Figures