3419
An automatic system for asymmetry vein analysis in patients with acute ischemic stroke1Academy for Advanced Interdisciplinary Studies, Peking University, Beijing, China, 2Department of Neurology, Peking Union Medical College Hospital, Beijing, China, 3Department of Neurology, Peking University First Hospital, Beijing, China, 4College of Engineering, Peking University, Beijing, China
Synopsis
Asymmetry veins in patients with acute ischemic stroke are associated with infarct growth and clinical outcome. However, due to the lack of effective segmentation and quantification methods, these studies focus only on medullary or cortical veins. In this study, an automatic image processing system was developed for asymmetry analysis in medullary and cortical veins using the magnitude data of SWI.
Introduction
Several venous lesions and diseases can be effectively detected using susceptibility weighted imaging (SWI)[1, 2]. Previous studies indicated that asymmetry veins on SWI in patients with acute ischemic stroke are associated with infarct growth and clinical outcome[3]. However, these studies focus only on medullary or cortical veins due to the lack of effective segmentation and quantification methods. In order to make a further insight into the relationship between stroke and vein asymmetry, an automatic image processing system was developed for asymmetry analysis in medullary and cortical veins using SWI in patients with acute ischemic stroke.Methods
Data Acquisition
273 patients with acute ischemic stroke were enrolled in this study. All the participants were scanned at 3T GE Discovery MR 750 scanner. The following imaging parameters of SWI sequence were used in this study: TE/TR = 23/36ms, field of view = 24cm × 24cm, slice thickness = 2.0mm, matrix size was 512 × 512 × 124. 840 images were used to verify the feasibility and effectiveness of the system.
Image Processing
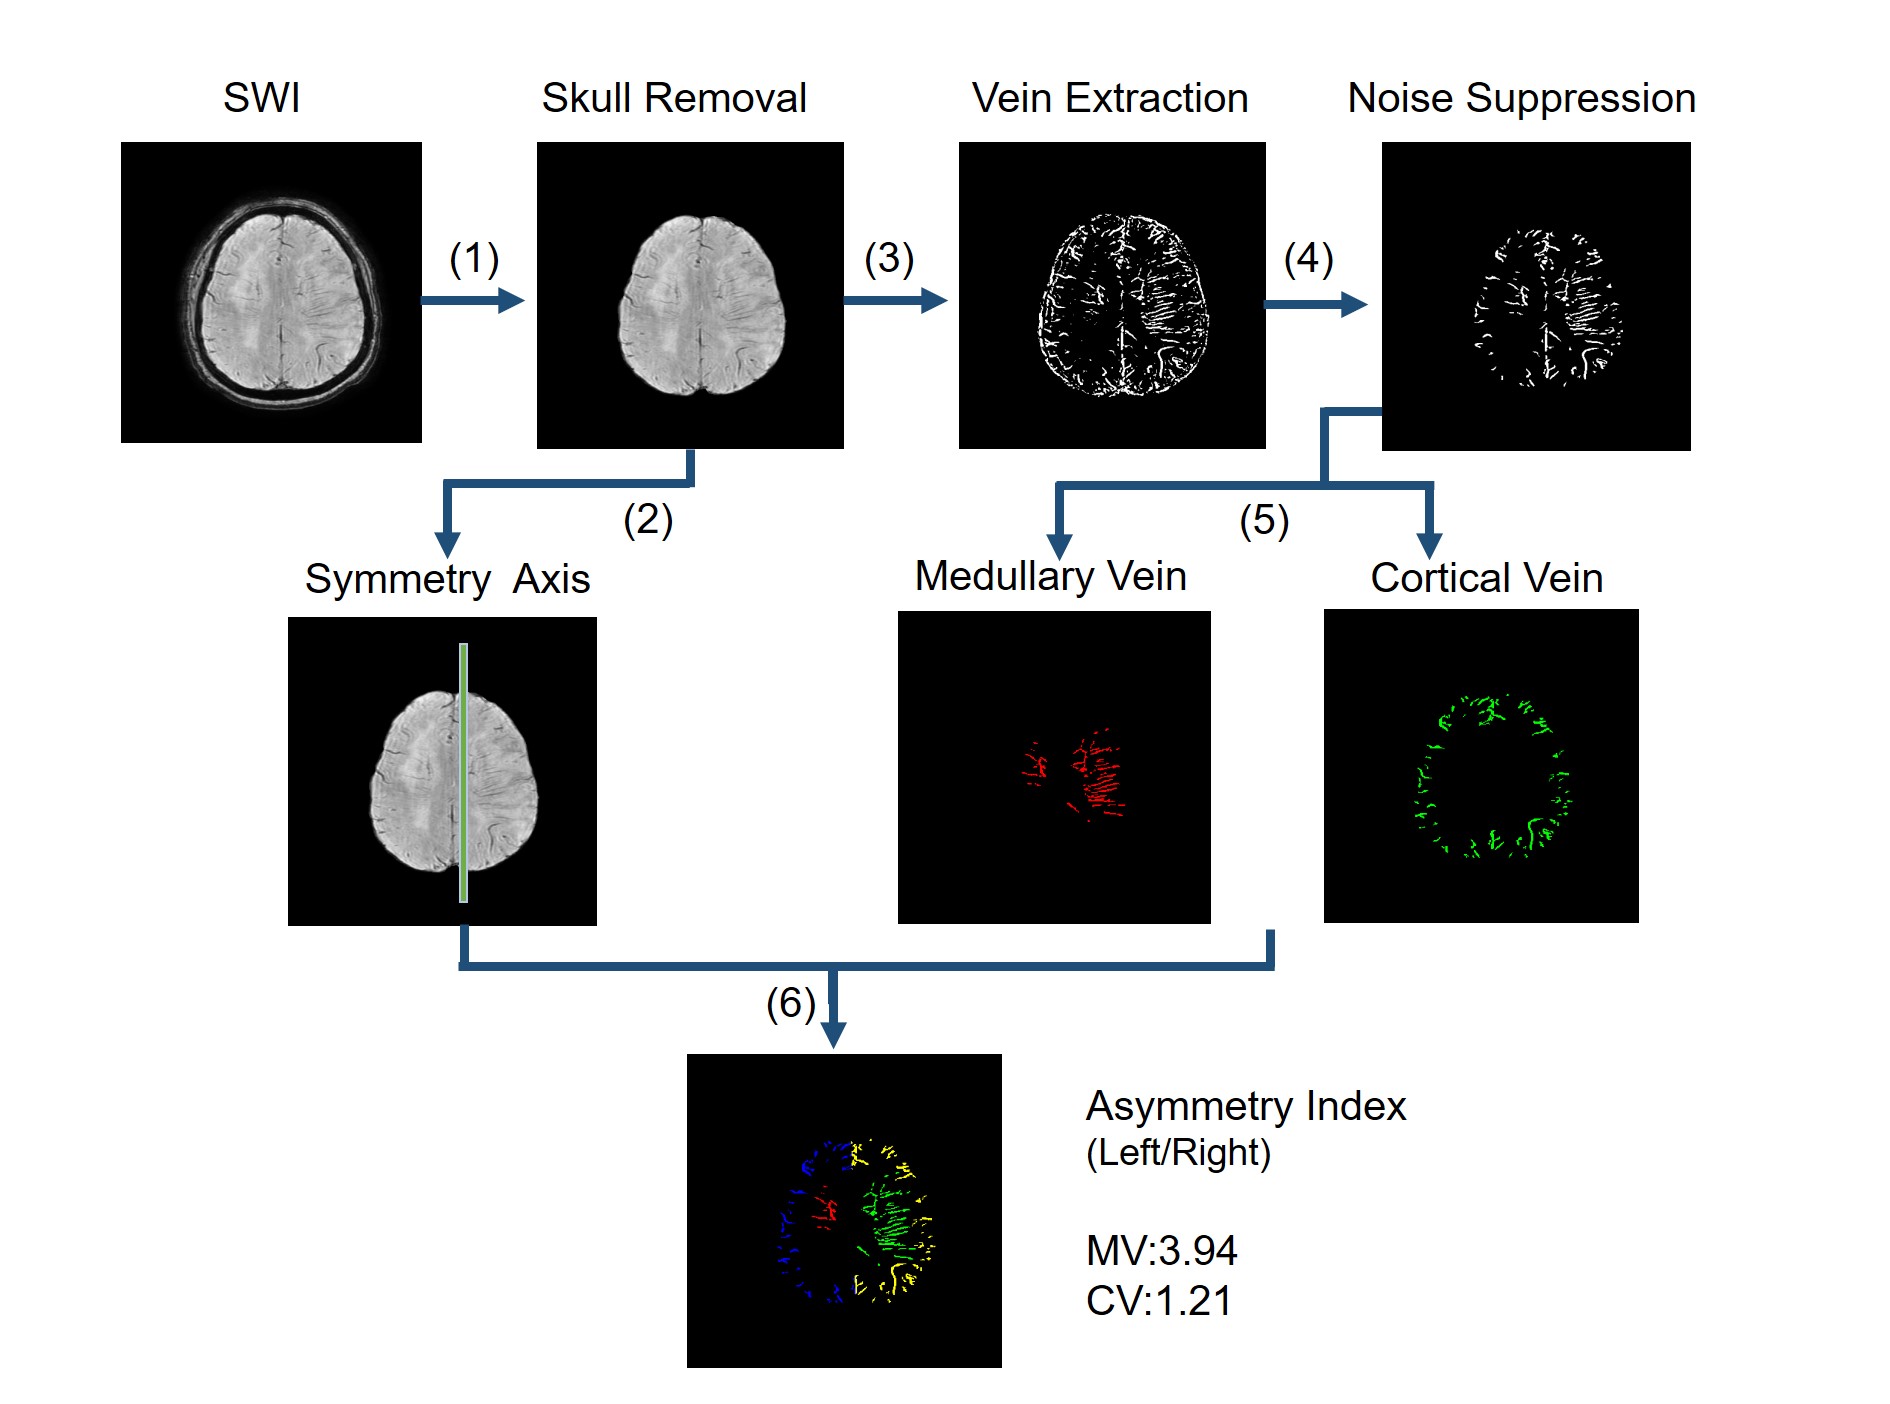
As is shown in figure 1, the key steps of image processing include (1) skull removal, (2) symmetry axis extraction, (3) vein extraction, (4) noise suppression, (5) medullary-cortical vein separation and (6) left-right hemisphere separation.
The adaptive threshold method of image segmentation is adopted to extract the skull from the SWI image. According to the characteristic of SWI images, the symmetry axis was detected based on the minimal value of moment of inertia. Meanwhile, a multi-scale vessel enhancement (MSVE) filter algorithm was applied to SWI dataset. Vessels with different widths can be enhanced by using different spatial scales in MSVE filtering, which ensures the effect of segmentation for small medullary vessel. Considering the segmented image included otiose small blobs caused by strong contrast changes, it is necessary to reduce the noise and refine the image. Based on that, medullary veins and cortical veins were then separated according to their distribution and morphology. Finally, medullary and cortical veins in left and right cerebral hemisphere could be distinguished by combining the symmetry axis extracted from the previous step.
Asymmetry Analysis
The asymmetry index (AI) was defined as the ratio of cerebral vein voxel count between two hemispheres based on the segmentation results[5]. AI for medullary veins and cortical veins were calculated individually for each slice.
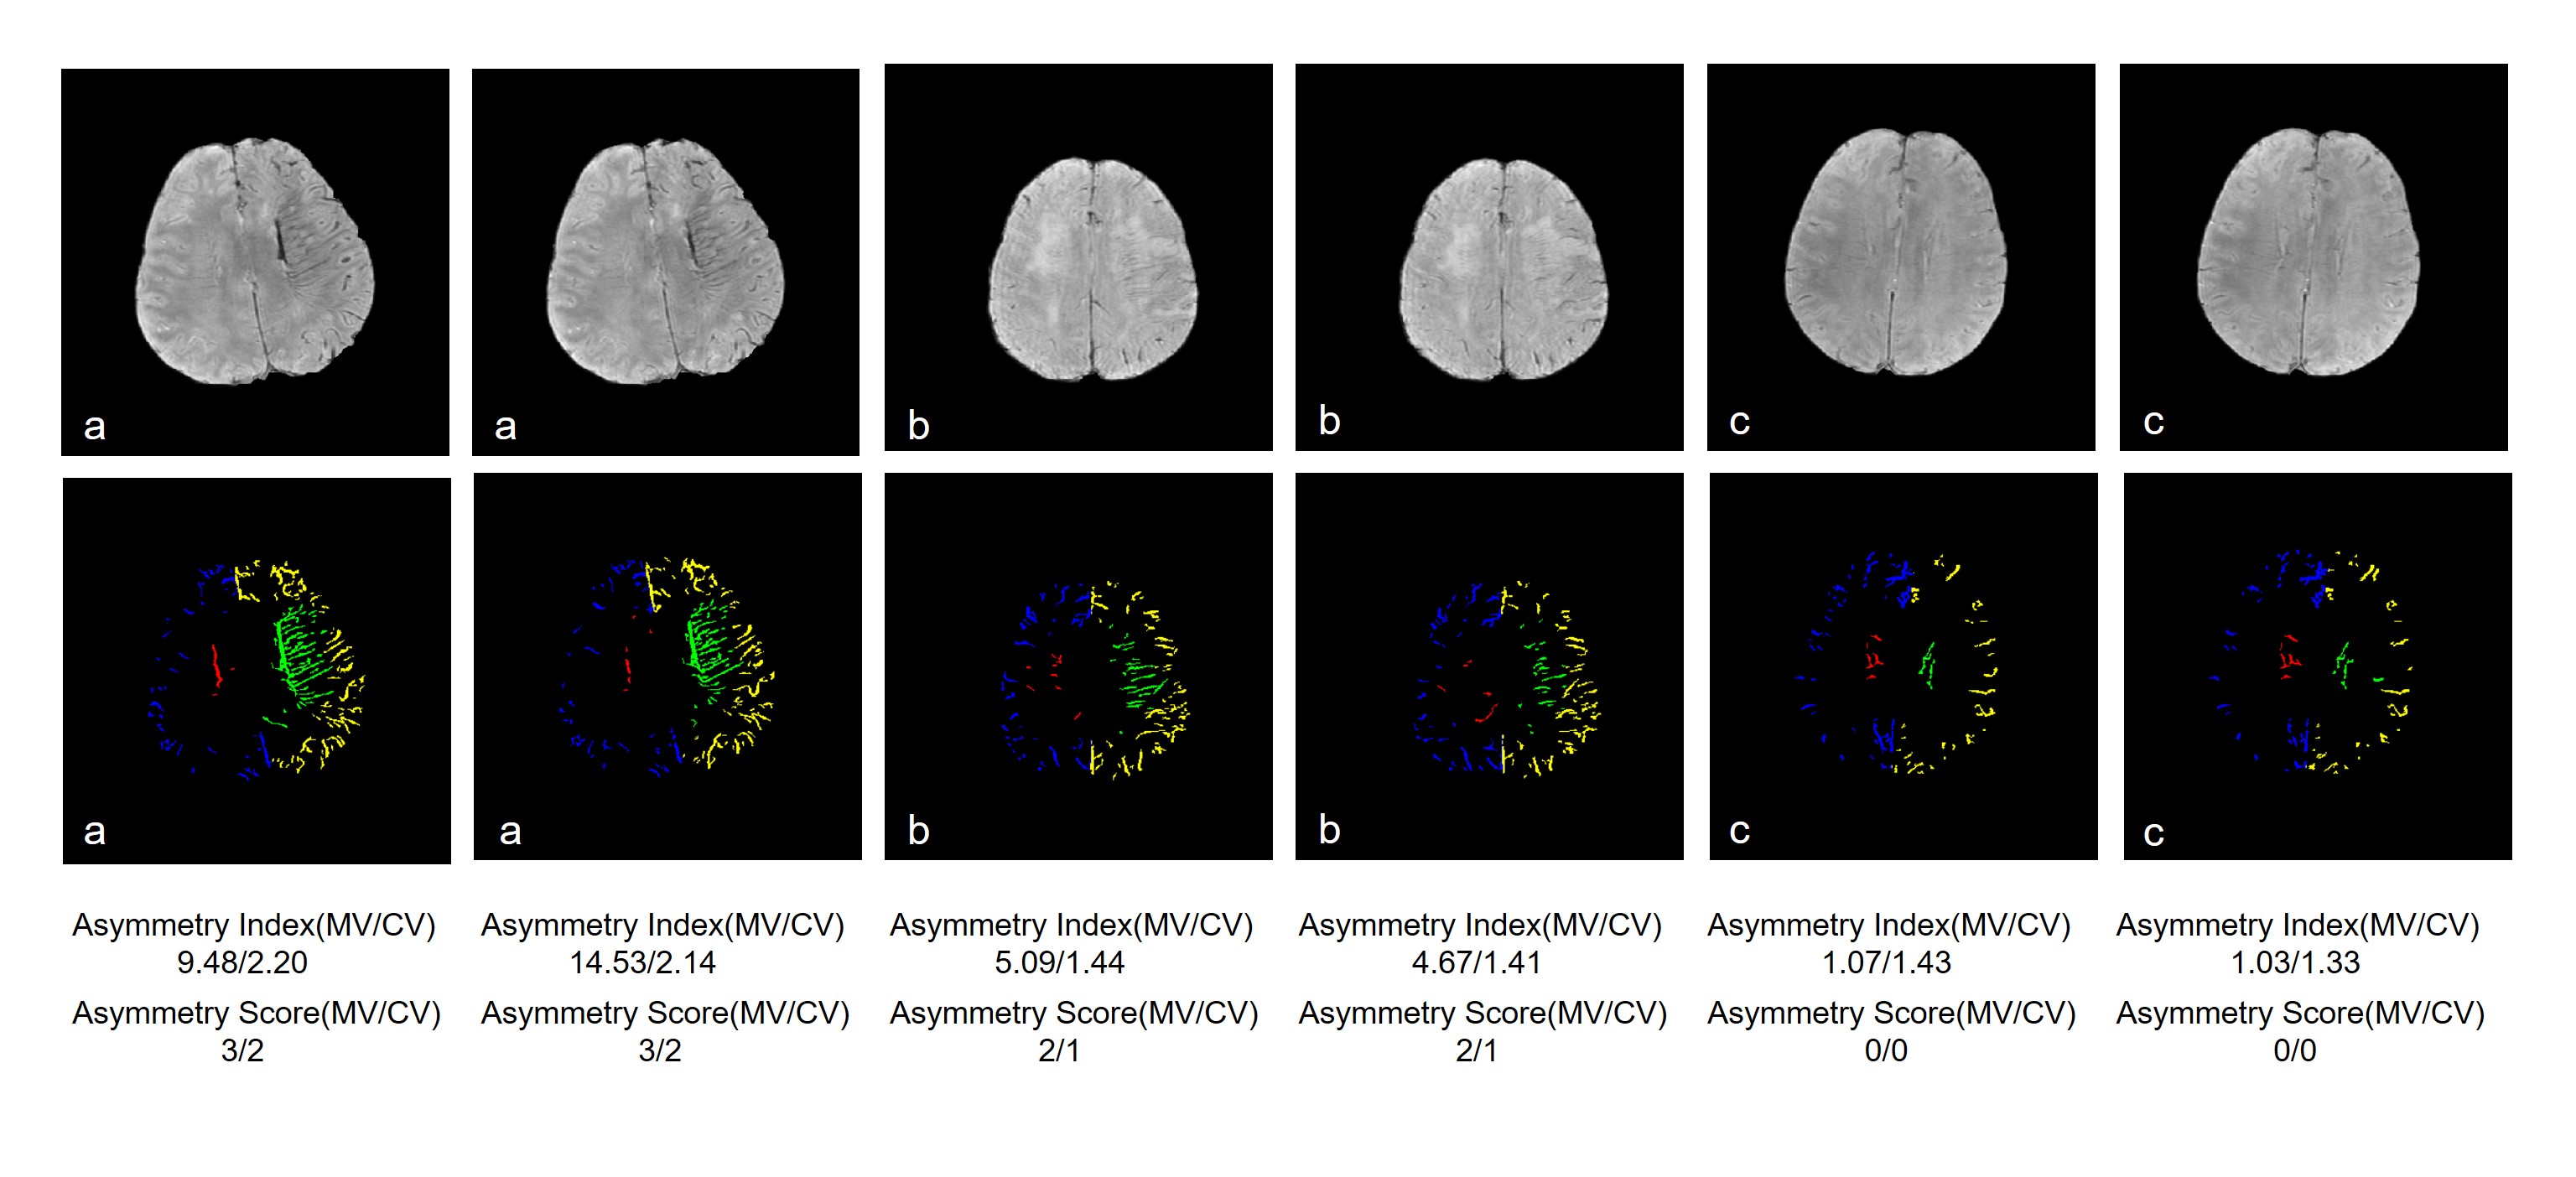
Meanwhile, the SWI images of all patients were assessed with regard to presence of asymmetry by two neurologists based on visual inspection. Each slice was evaluated separately using a scoring system from score 0 to 3 to quantify asymmetry of the medullary veins and cortical veins[4]. A score of 0 was defined as symmetry, a score of 1 indicated a faint asymmetry, a score of 2 indicated unequivocal asymmetry, a score of 3 was assigned to very prominent asymmetry.
Statistic Analysis
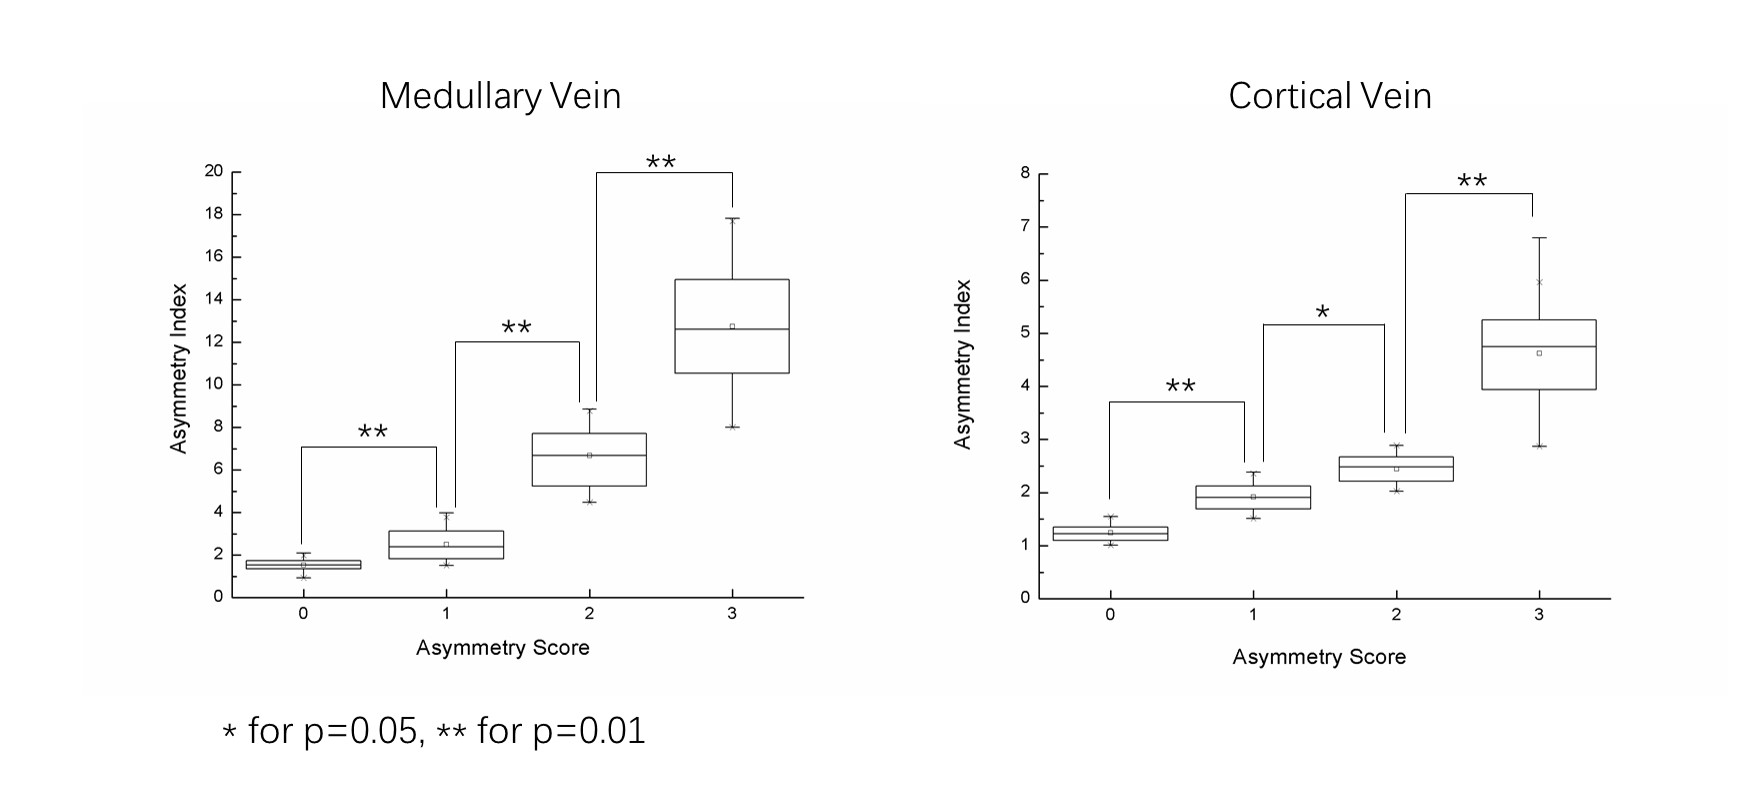
840 images were scored and divided into eight groups according to asymmetry scores of medullary veins and cortical veins, respectively. For each group, 100 images were selected randomly and the groups were compared pairwise by paired t-test for medullary veins and cortical veins.
Results
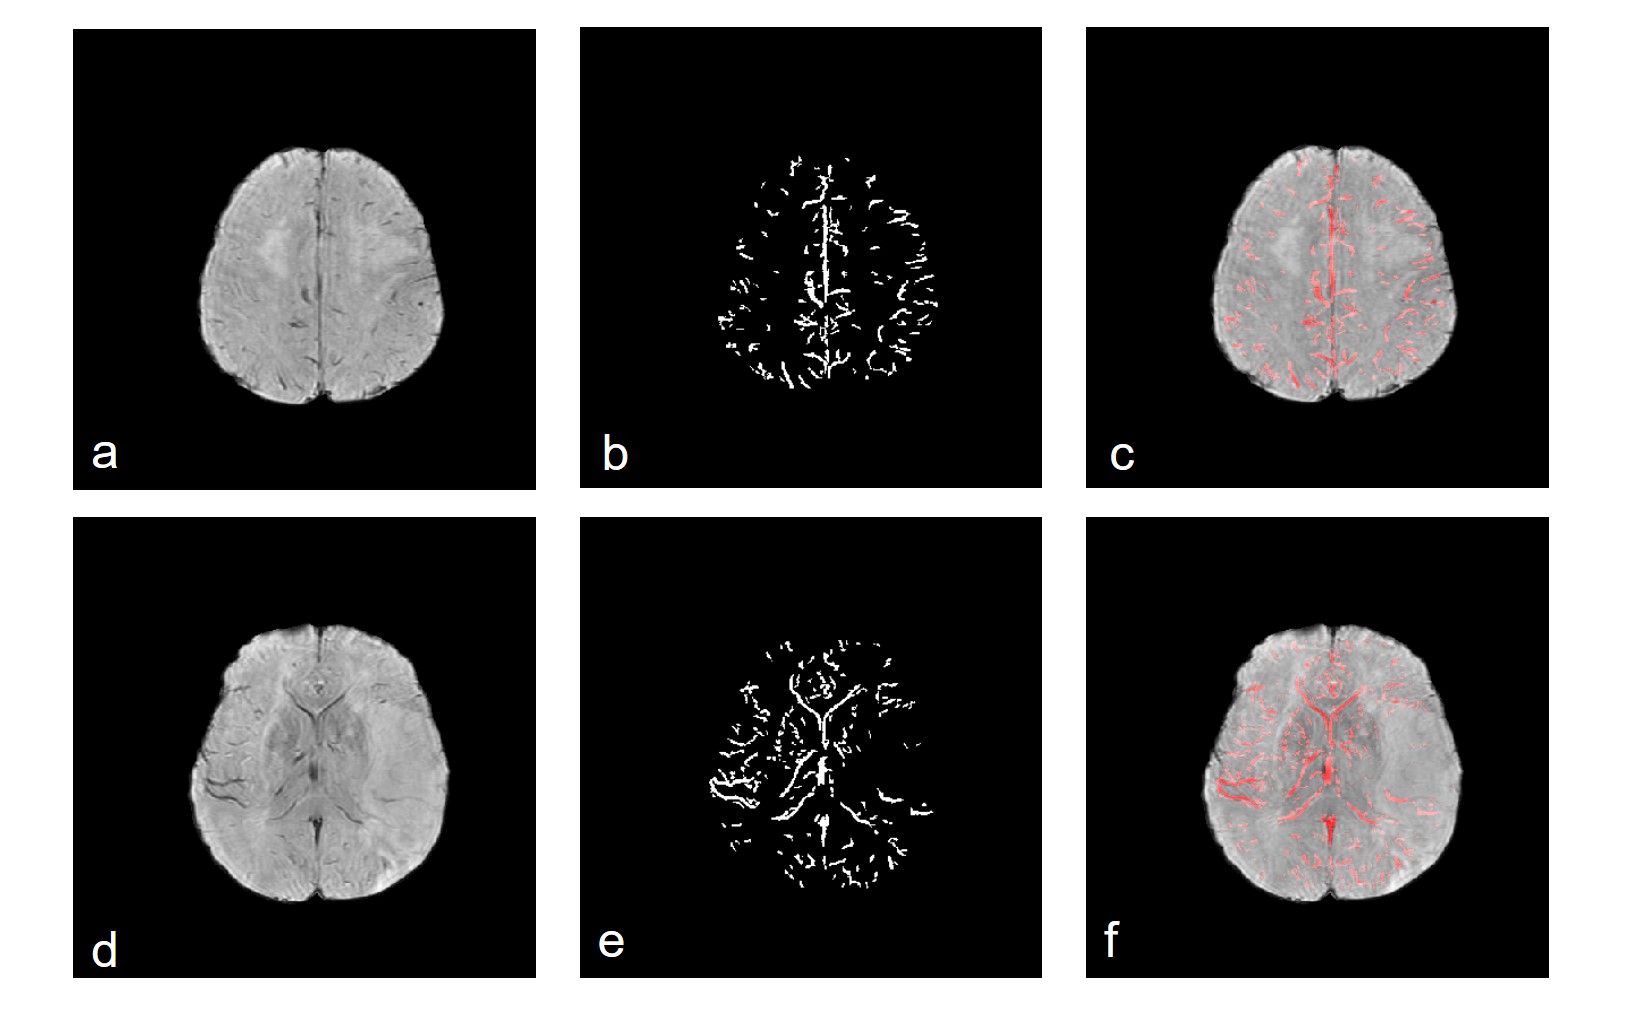
Figure 2 illustrate the venous vessels segmented by this method. Even thin vessels with low contrast were extracted effectively and the noise was suppressed. The segmented veins overlap well with the dark region in original SWI images (Figure 2, c,f). Figure 3 displayed the separation of medullary and cortically vein as well as discrimination of veins in different hemisphere. Asymmetry index of images with prominent (Figure 3a), unequivocal (Figure 3b), and no (Figure 3c) asymmetry in medullary veins were 9.48 and 14.53, 5.09 and 4.67, 1.07 and 1.03, respectively. Asymmetry index of images with unequivocal (Figure 3a), faint (Figure 3b), and no (Figure 3c) asymmetry in cortical veins were 2.20 and 2.14, 1.44 and 1.41, 0.70 and 0.75, respectively. In figure 4, the level of Asymmetry index increased gradually and significantly from the group of patients with low asymmetry scores to high asymmetry scores. (p=0.5 for the pair between group of images with cortical asymmetry score 0 and group of images with cortical asymmetry score 1, p=0.01 for other pairs).Discussion and Conclusion
In this study, we proposed an SWI image processing and analysis system and verified its feasibility for asymmetry vein evaluation in acute ischemic stroke patients. There are two innovations as follows.
(1) It is the first system for automatic evaluation of vein asymmetry in acute ischemic stroke patients,
(2) It is the first time to simultaneously analyze the asymmetry of cortical and medullary veins automatically.
The results had shown that this system could achieve effective segmentation and reliable asymmetry calculation. It could be a valuable computer aided analysis tool for vascular disease study.
Acknowledgements
No acknowledgement found.References
1. Santhosh, K., et al., Susceptibility weighted imaging: a new tool in magnetic resonance imaging of stroke. Clinical Radiology, 2009. 64(1): p. 74-83.
2. Tong, K.A., et al., Susceptibility-Weighted MR Imaging: A Review of Clinical Applications in Children. American Journal of Neuroradiology, 2008. 29(1): p. 9.
3. Chen, C.-Y., et al., Prominent Vessel Sign on Susceptibility-Weighted Imaging in Acute Stroke: Prediction of Infarct Growth and Clinical Outcome. PLoS ONE, 2015. 10(6): p. e0131118.
4. Mucke, J., et al., Asymmetry of Deep Medullary Veins on Susceptibility Weighted MRI in Patients with Acute MCA Stroke Is Associated with Poor Outcome. PLoS ONE, 2015. 10(4): p. e0120801.
5. Lou, M., et al., Susceptibility-Diffusion Mismatch Predicts Thrombolytic Outcomes: A Retrospective Cohort Study. American Journal of Neuroradiology, 2014. 35(11): p. 2061.
Figures