3411
Multi-atlas based Detection and Localization (MADL) of White Matter Hyperintensities: Relationship with Amyloid Accumulation and Vascular Risks1Radiology, Johns Hopkins University School of Medicine, BALTIMORE, MD, United States, 2Neurology, Johns Hopkins University School of Medicine, BALTIMORE, MD, United States, 3Biomedical Engineering, Johns Hopkins University School of Medicine, BALTIMORE, MD, United States
Synopsis
Recent findings suggest white matter hyperintensities (WMH) that appear on FLAIR images may play a role in the evolution of Alzheimer’s disease (AD). Here, we developed a novel algorithm that simultaneously detects and locates WMH, based on a FLAIR atlas database and a multi-atlas fusion algorithm. The method showed a respectful WMH detection accuracy. We also investigated region-specific WMH load in participants for whom amyloid imaging and vascular data were available. The results suggested that posterior WMH is related to amyloid deposition; whereas anterior and parietal WMH is associated with vascular risk factors.
Introduction
Several recent studies suggest that white matter hyperintensities (WMH) may be a core feature of Alzheimer’s disease (AD)1-4. The regional specificity of WMH in recent studies, (e.g., periventricular WMH versus deep WMH) has suggested a diverse role of WMH in disorders that cause cognitive decline 5, 6, depending on the spatial location. Systematic quantification of the extent and the distribution of WMH may improve our understanding of its role in AD. Automated WMH detection algorithms7-17 have been developed over the past decade. Yet, existing algorithms typically do not provide location information of the WMH. We developed a new WMH mapping approach, based on which we investigated the regional features of WMH with respect to amyloid deposition and vascular risk factors.Methods
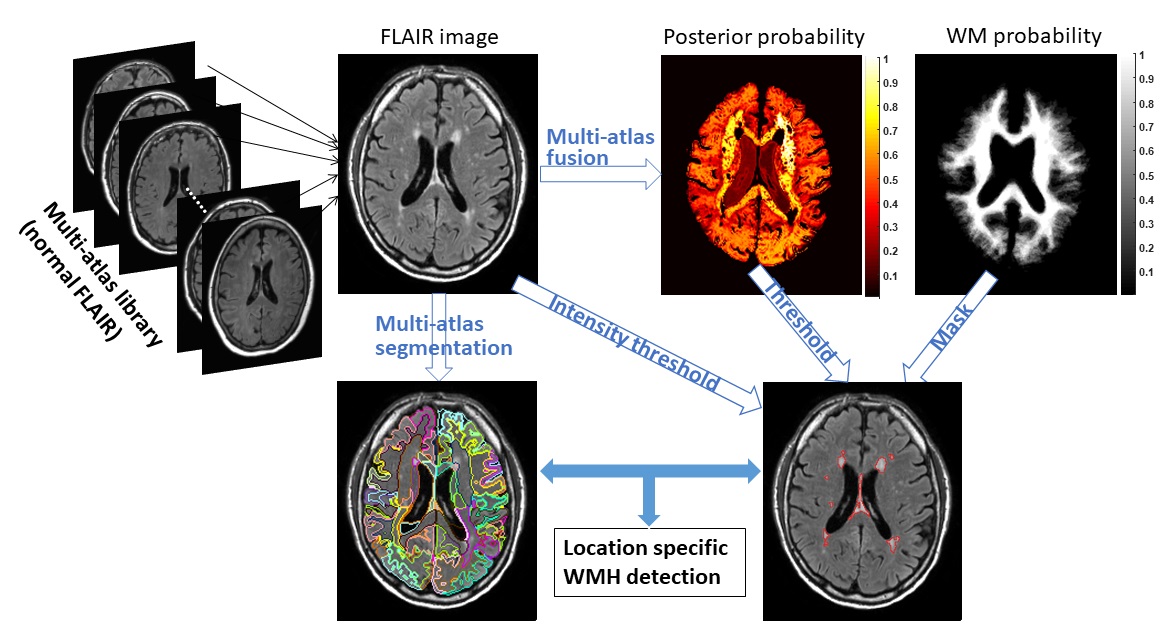
Multi-atlas based Detection and Localization (MADL) of WMH: The algorithm pipeline is depicted in Fig. 1. Briefly,
i) A FLAIR atlas library is established, consisting of 14 normal elderly brains that have minimal WMH.
ii) Atlas images are registered to the target image via linear and nonlinear (Large Deformation Diffeomorphic Metric Mapping18) transformations.
iii) Atlas-weighting and fusion is performed according to a multi-atlas likelihood fusion method19 to obtain the posterior probability $$$\widehat{p}\left(j|x,I_{T}\right)$$$—the probability of voxel $$$x$$$ in target image $$$I_{T}$$$ to be labeled as $$$j$$$.
iv) A final segmentation is obtained using Bayes maximum a posteriori (MAP) estimation: $$$L_{T}(x)=\arg_{max(j\in[1,...,L])}\widehat{p}\left(j|x,I_{T}\right)$$$, and a 3D MAP profile $$$\widehat{p}\left(L_{T}|x,I_{T}\right)$$$ is obtained.
v) WMH is identified as voxels with low $$$\widehat{p}\left(L_{T}|x,I_{T}\right)$$$ values below certain threshold within a WM mask, along with several post-processing steps to reduce false-positives.
Based on the simultaneous outputs of image segmentation and WMH detection, region-specific WMH load in each ROI can be extracted. Algorithm performance was evaluated by inter-class correlation (ICC), receiver-operation curve (ROC), dice similarity index (SI), false-positive rate (FPR), and false-negative rate (FNR).
Data: MRI, PET, diagnostic and clinical data were collected from the BIOCARD cohort20 —an ongoing longitudinal study focused on preclinical AD. All analyses presented here are cross-sectional. FLAIR data were acquired on a Philips Achieva 3.0T scanner at TI/TE/TR = 2800/100/11000ms, in-plane resolution = 1 x 1mm, 69 slices with slice-thickness = 2mm. 171 FLAIR images were used in this study, and manual delineation of WMH was performed on 124 images. Amyloid deposition was determined by PET-PiB distribution volume ratio (DVR), generated using cerebellar gray matter as a reference tissue21. Five vascular risk factors were used in the analysis, including hypertension, hypercholesterolemia, diabetes, smoking, and body mass index. At the time of data acquisition, all participants were either cognitively normal (n=117) or had a consensus diagnosis of MCI (n=54) based on the NIA/AA criteria.
Results
Whole-brain WMH load detected by the MADL method correlated well with manual results with an ICC of 0.97 across 124 subjects, and ICC was 0.89 in a sub-population with WMH load < 20ml (Fig. 1A). Voxelwise ROC were calculated for individual subjects, and the average ROC and the standard deviation is plotted in Fig. 1C, and the area under ROC was 0.89±0.05. We compared the performance of MADL with a state-of-the-art WMH detection algorithm22 in Table 1. Overall, SI and ICC was similar between the two methods; MADL had a lower FPR while BIANCA had a lower FNR.
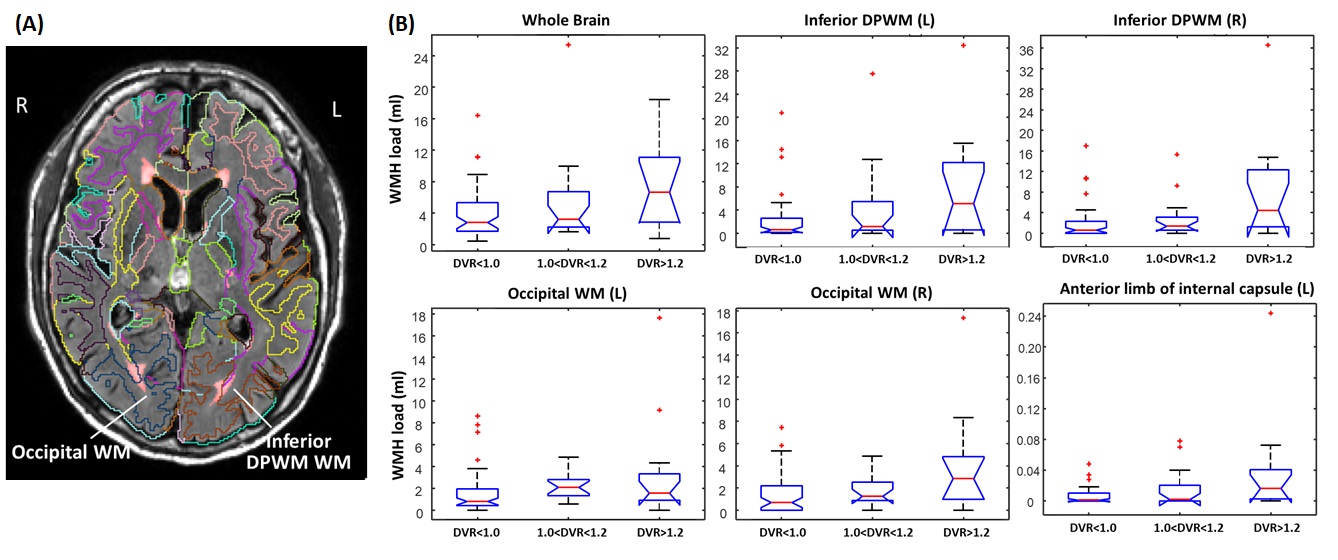
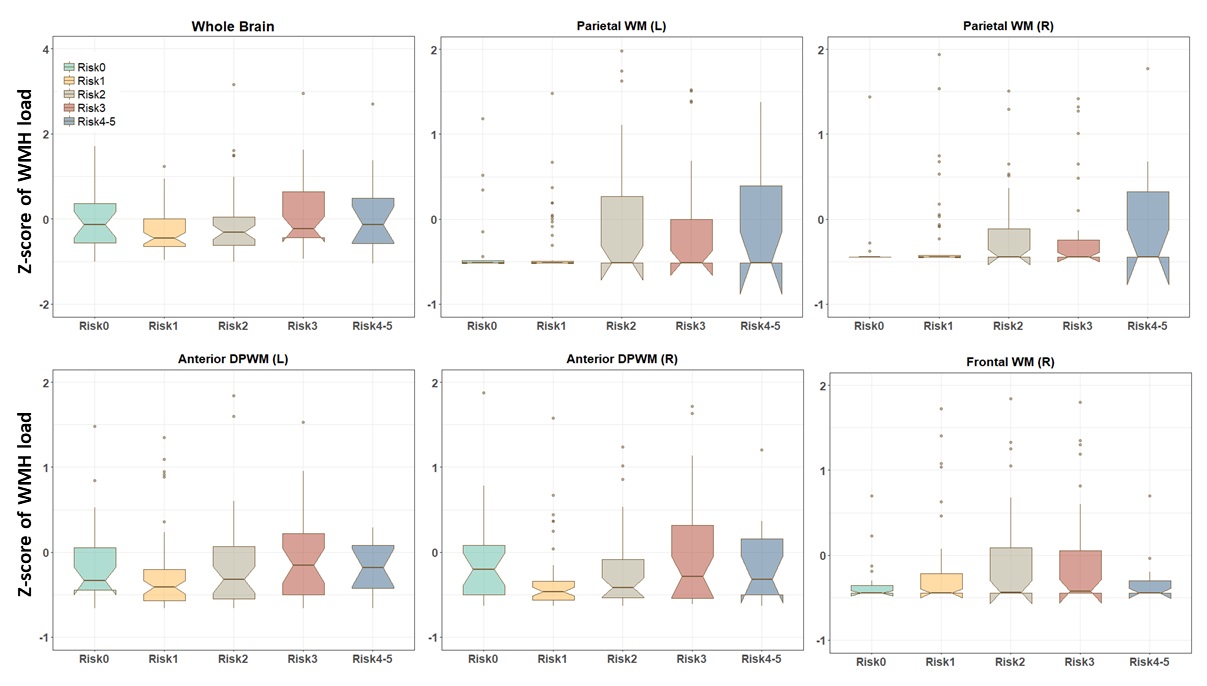
Fig. 3A shows a FLAIR image from a MCI subject, overlaid with segmentation and WMH detection results from the MADL pipeline. We grouped the participants according to their amyloid deposition levels, and significant differences in WMH load were found in the bilateral occipital WM and inferior DPWM among all 38 WM ROIs, in addition to the whole-brain WMH load (Fig. 3B). To investigate vascular risk factors, we stratified the participants into six groups based on the number of vascular risk factors for each subject (on the level of 0-5). Significant differences among the risk groups were found in the bilateral parietal WM and anterior DPWM, right frontal lobe, and whole-brain WMH load (Fig. 4).
Discussion and Conclusion
We developed a multi-atlas based method for simultaneous detection and location of WMH on FLAIR images. The algorithm showed good WMH detection accuracy in comparison with manual delineation and other existing methods. We found differences in the relationship between region-specific WMH load and amyloid deposition (e.g., the inferior and occipital WMH), compared to the regional relationships with vascular risk factors (e.g., frontal and parietal WMH). These findings are in-line with the hypothesis that WMH are differentially related to vascular and degenerative processes in the brain23.Acknowledgements
This work is supported by NIH grant P50AG005146, U19AG033655, R01HD065955, P41EB01590917, R01NS08688804, and R21NS098018.References
1. Lee S, Viqar F, Zimmerman ME, et al. White matter hyperintensities are a core feature of Alzheimer's disease: Evidence from the dominantly inherited Alzheimer network. Annals of neurology. 2016; 79: 929-39.
2. Brickman AM. Contemplating Alzheimer's disease and the contribution of white matter hyperintensities. Current neurology and neuroscience reports. 2013; 13: 415.
3. Debette S and Markus HS. The clinical importance of white matter hyperintensities on brain magnetic resonance imaging: systematic review and meta-analysis. Bmj. 2010; 341: c3666.
4. Lindemer ER, Salat DH, Smith EE, et al. White matter signal abnormality quality differentiates mild cognitive impairment that converts to Alzheimer's disease from nonconverters. Neurobiology of aging. 2015; 36: 2447-57.
5. DeCarli C, Fletcher E, Ramey V, Harvey D and Jagust WJ. Anatomical mapping of white matter hyperintensities (WMH): exploring the relationships between periventricular WMH, deep WMH, and total WMH burden. Stroke. 2005; 36: 50-5.
6. van Swieten JC, van den Hout JH, van Ketel BA, Hijdra A, Wokke JH and van Gijn J. Periventricular lesions in the white matter on magnetic resonance imaging in the elderly. A morphometric correlation with arteriolosclerosis and dilated perivascular spaces. Brain : a journal of neurology. 1991; 114 ( Pt 2): 761-74.
7. Yoo BI, Lee JJ, Han JW, et al. Application of variable threshold intensity to segmentation for white matter hyperintensities in fluid attenuated inversion recovery magnetic resonance images. Neuroradiology. 2014; 56: 265-81.
8. Ji S, Ye C, Li F, et al. Automatic segmentation of white matter hyperintensities by an extended FitzHugh & Nagumo reaction diffusion model. Journal of magnetic resonance imaging : JMRI. 2013; 37: 343-50.
9. Simoes R, Monninghoff C, Dlugaj M, et al. Automatic segmentation of cerebral white matter hyperintensities using only 3D FLAIR images. Magn Reson Imaging. 2013; 31: 1182-9.
10. Gibson E, Gao FQ, Black SE and Lobaugh NJ. Automatic Segmentation of White Matter Hyperintensities in the Elderly Using FLAIR Images at 3T. Journal of Magnetic Resonance Imaging. 2010; 31: 1311-22.
11. Ong KH, Ramachandram D, Mandava R and Shuaib IL. Automatic white matter lesion segmentation using an adaptive outlier detection method. Magn Reson Imaging. 2012; 30: 807-23.
12. Kawata Y, Arimura H, Yamashita Y, et al. Computer-aided evaluation method of white matter hyperintensities related to subcortical vascular dementia based on magnetic resonance imaging. Comput Med Imag Grap. 2010; 34: 370-6.
13. Samaille T, Fillon L, Cuingnet R, et al. Contrast-Based Fully Automatic Segmentation of White Matter Hyperintensities: Method and Validation. Plos One. 2012; 7.
14. Beare R, Srikanth V, Chen J, et al. Development and validation of morphological segmentation of age-related cerebral white matter hyperintensities. Neuroimage. 2009; 47: 199-203.
15. Wang YB, Catindig JA, Hilal S, et al. Multi-stage segmentation of white matter hyperintensity, cortical and lacunar infarcts. Neuroimage. 2012; 60: 2379-88.
16. Khademi A, Venetsanopoulos A and Moody AR. Robust White Matter Lesion Segmentation in FLAIR MRI. Ieee T Bio-Med Eng. 2012; 59: 860-71.
17. Dyrby TB, Rostrup E, Baare WFC, et al. Segmentation of age-related white matter changes in a clinical multi-center study. Neuroimage. 2008; 41: 335-45.
18. Christensen GE, Rabbitt RD and Miller MI. Deformable templates using large deformation kinematics. Ieee T Image Process. 1996; 5: 1435-47.
19. Tang XY, Oishi K, Faria AV, et al. Bayesian Parameter Estimation and Segmentation in the Multi-Atlas Random Orbit Model. Plos One. 2013; 8.
20. Albert M, Soldan A, Gottesman R, et al. Cognitive changes preceding clinical symptom onset of mild cognitive impairment and relationship to ApoE genotype. Current Alzheimer research. 2014; 11: 773-84.
21. Zhou Y, Resnick SM, Ye W, et al. Using a reference tissue model with spatial constraint to quantify [11C]Pittsburgh compound B PET for early diagnosis of Alzheimer's disease. Neuroimage. 2007; 36: 298-312.
22. Griffanti L, Zamboni G, Khan A, et al. BIANCA (Brain Intensity AbNormality Classification Algorithm): A new tool for automated segmentation of white matter hyperintensities. NeuroImage. 2016; 141: 191-205.
23. Lee DY, Fletcher E, Martinez O, et al. Vascular and degenerative processes differentially affect regional interhemispheric connections in normal aging, mild cognitive impairment, and Alzheimer disease. Stroke. 2010; 41: 1791-7.
Figures