3410
Assessing the Relation between Image Quality Metrics and Brain Volume in a Scan-Rescan Dataset1Advanced Clinical Imaging Technology, Siemens Healthcare AG, Lausanne, Switzerland, 2Department of Radiology, Centre Hospitalier Universitaire Vaudois (CHUV), Lausanne, Switzerland, 3Signal Processing Laboratory (LTS 5), École Polytechnique Fédérale de Lausanne (EPFL), Lausanne, Switzerland, 4Biogen, Cambridge, MA, United States, 5Cleveland Clinic, Cleveland, OH, United States, 6Johns Hopkins University, Baltimore, MD, United States, 7New York University, New York, NY, United States
Synopsis
Satisfactory image quality is essential to accurately assess brain volume using automated methods for evaluating neurodegenerative diseases. Variations in image quality may cause volume estimation errors hard to distinguish from disease-induced changes. We studied the relationship between brain volume estimations and image quality metrics in a scan-rescan study. Two segmentation methods were used to quantify brain volume in FLAIR and MPRAGE images. Volume estimations on MPRAGE varied less with hardware, compared to the estimations on FLAIR. We found a significant correlation between hardware and several image quality metrics, suggesting that these can be used to render volume estimations more hardware-independent.
Introduction
Automated assessment of brain volume (BV) is increasingly used in routine clinical practice. These methods are however susceptible to image quality variations caused by the use of different hardware and acquisition protocols. Moreover, non-pathological physiological fluctuations in BV due to, e.g. hydration state, may have non-negligible effects. It is important to understand these variations to discriminate between experimental errors, age-related brain atrophy and progression of neurodegenerative diseases. Another source of variation is artefacts caused by B1-biases, motion and other factors1. Various image quality metrics (IQM) have been proposed to measure effects potentially influencing subsequent post-processing results.
This study investigates the relationship between BV changes and variations of four IQMs: entropy focus criterion (EFC2), foreground-background energy ratio (FBER3), spread of the bias field correcting for intensity inhomogeneity (INU4), and full-width half-maximum of the spatial distribution of image intensities (FWHM5).
Materials and Methods
Written consent was provided by thirty patients from three institutions participating in a scan-rescan study. They were scanned four times in two days (two scans per day) within one week. 3D-MPRAGE (TR=2300ms, TI=900ms, 240x256x176; voxel=1×1×1mm3) and 3D-FLAIR (TR=5000ms, TI=1800ms, 240x256x176; voxel=1×1×1mm3) sequences were acquired during each session on different 3T scanners (MAGNETOM Verio, Skyra or Prismafit,all Siemens Healthcare, Erlangen, Germany).
Four IQMs sensitive to intensity inhomogeneity, image entropy and background artifacts were computed for both sequences using MRIQC6. Brain segmentation was performed using a FLAIR-based algorithm (autosegMS7,8, Cleveland Clinic) and an MPRAGE-based prototype method (MorphoTempo9, 10). Both methods provided absolute BV and an intrinsic normalization volume (autosegMS: volume of brain outer contour; MorphoTempo: total intracranial volume). Brain parenchymal fraction (BPF) was computed as the ratio between BV and the respective normalization volume.
BPF and IQM absolute differences were evaluated by pairs according to the following scenarios: same-day, same-scanner (SDSS); same-day, different-scanner (SDDS); different-day, same-scanner (DDSS); different-day, different-scanner (DDDS). We calculated descriptive statistics per scenario for IQMs and BPF, as well as several univariate Wilcoxon signed-rank test (FDR-adjusted for multiple comparisons by scenario) in order to evaluate significance of the variations due to hardware variability and date of acquisition. We confirmed findings with a multivariate linear mixed-effects model,
[Model 1] $$$IQM = 1 + Machine * Day + Age + Sex + (1|Subject)$$$,
to model simultaneously the associations between IQMs, machine and day while accounting for subject clustering. Finally, we used a complementary model,
[Model 2] $$$BPF = 1 + Machine + EFC + INU + FWHM + FBER + Age + Sex + (1|Subject)$$$,
to test whether IQMs could account for variability in BPF due to machine differences.
Results
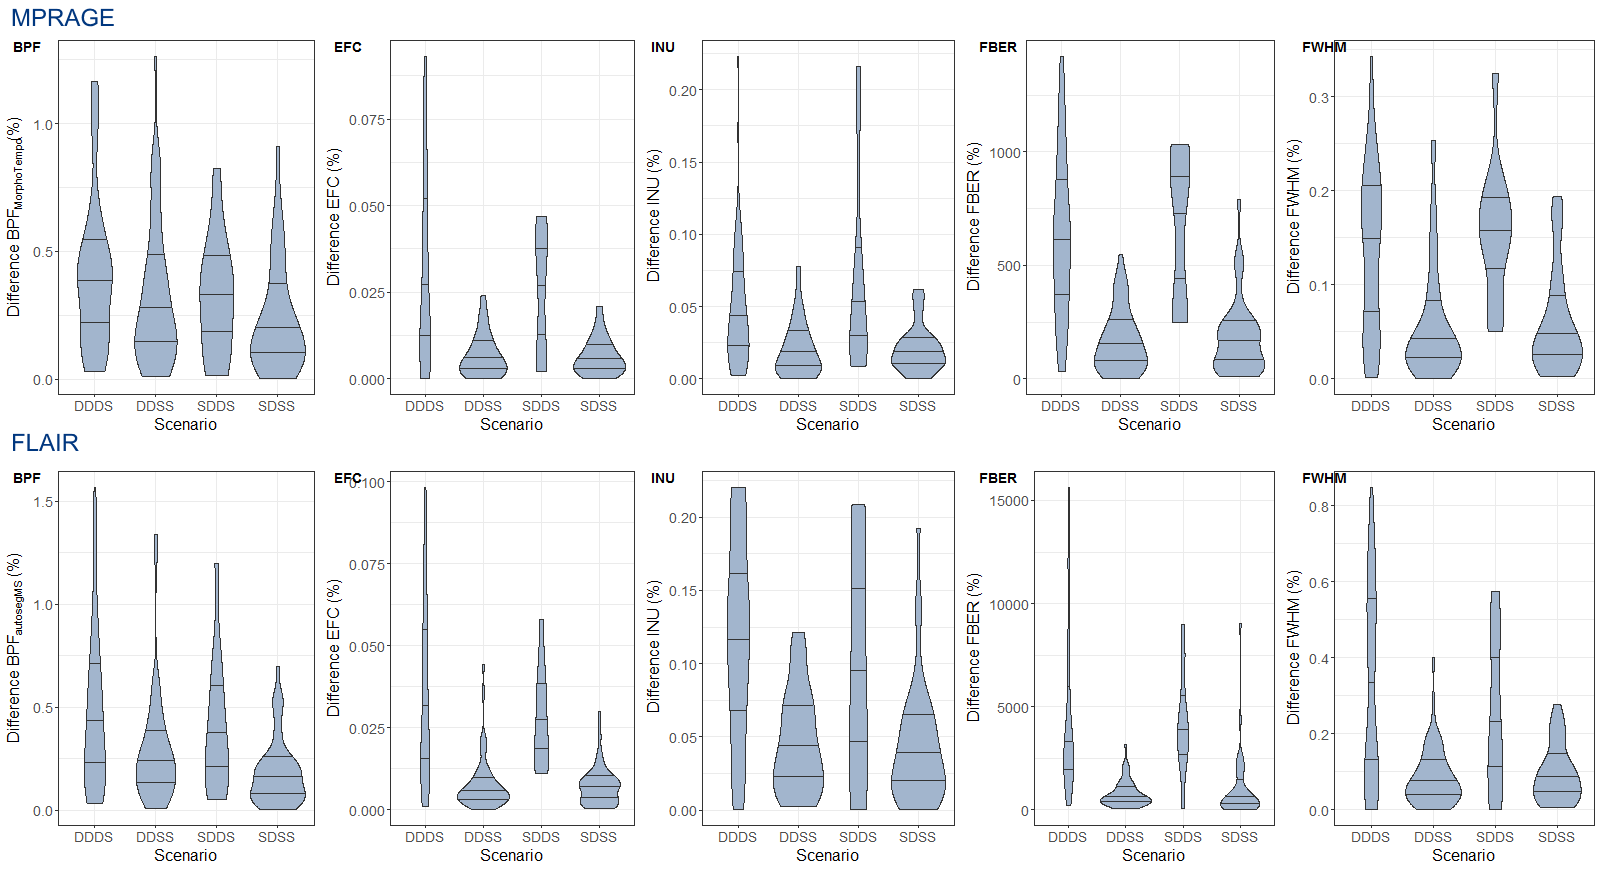
Five cases were excluded due to issues with the scanner configuration. Both autosegMS and the MorphoTempo prototype provide good overall reproducibility results: median BPF absolute difference of ~0.16% in the least variable scenario (SDSS) and ~0.38% in the worst (DDDS). BPF and IQMs show a consistent pattern which is mostly driven by the difference between scanners (Figure 1).
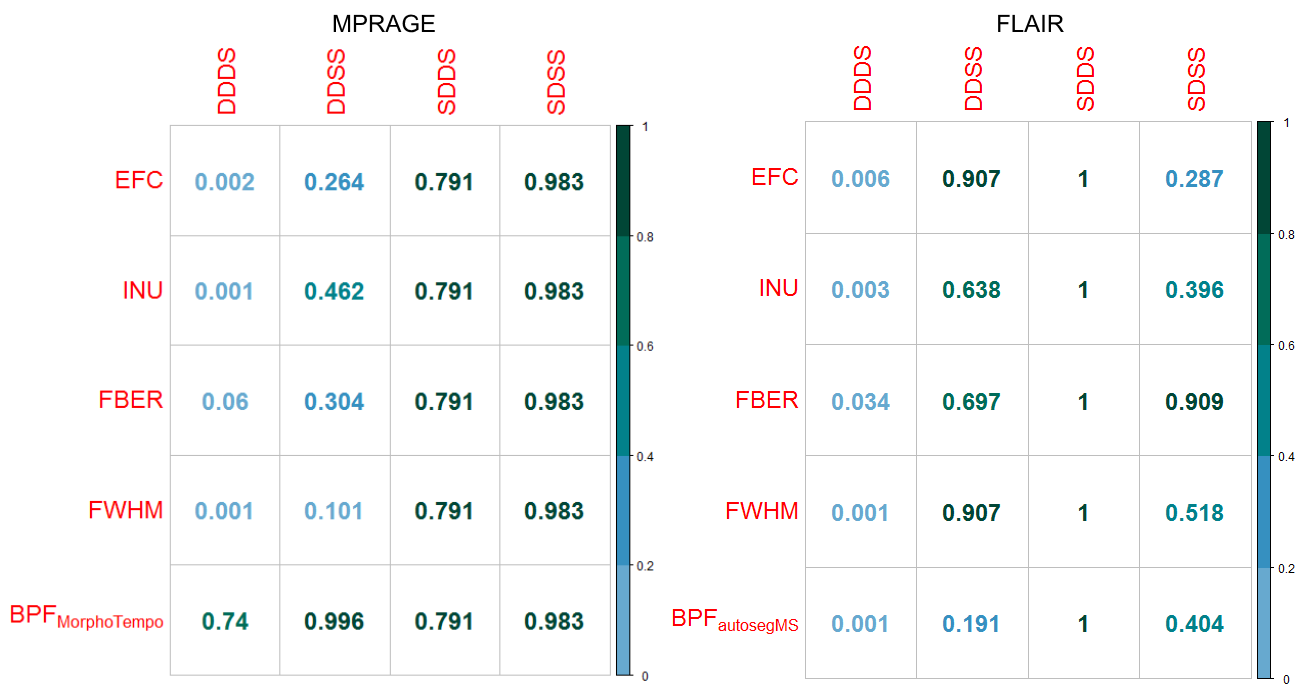
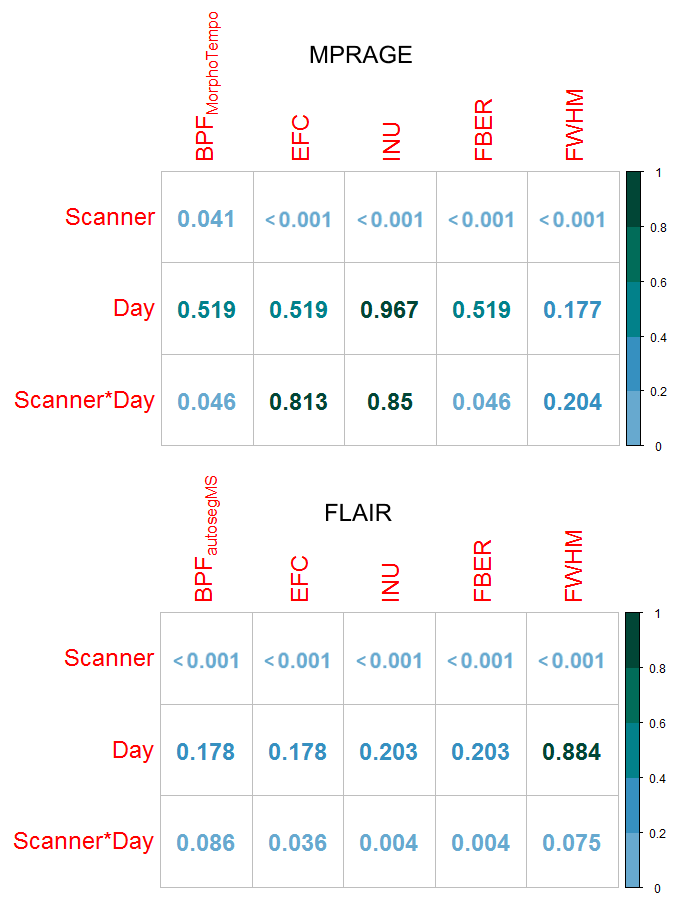
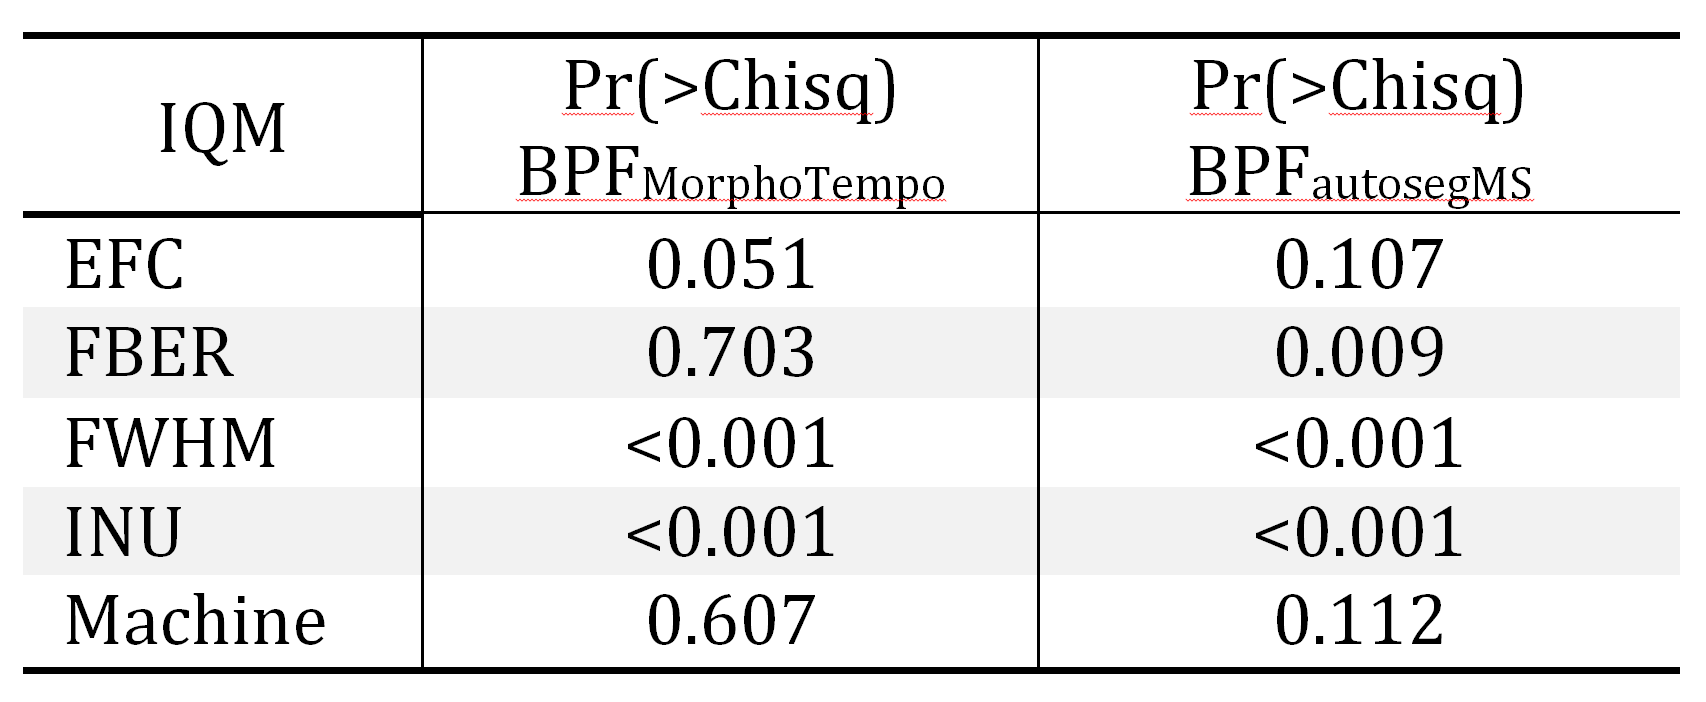
Wilcoxon tests (Figure 2) in all quality metrics are significantly associated with hardware differences, both for MPRAGE and FLAIR, in the DDDS (< 0.05 FDRBH), while IQMs and BPF did not significantly vary across days in DDSS. SDDS results were non-significant, possibly explained by the low number of samples (Figure 1). Regarding BPF, autosegMS results differed significantly for the DDDS scenario (< 0.05 FDRBH) whereas differences were not significant for MorphoTempo. A Wald chi-square test was performed on coefficients of the mixed-effects model for IQM and BPF. Again, IQMs (but not day or day*scanner interaction) were significantly associated with scanner (Figure 3). When including IQMs, machine was no longer significantly associated with BPF (Figure 4).
Discussion and Conclusions
The significance of the results obtained by the pairwise comparison per scenario (Figure 2) and the mixed-effects model (Figure 3) confirms the correlations between metrics (IQMs and BPF) and hardware. The differences in IQMs between two FLAIR images of the same patient are not significantly sensitive to date of acquisition (DDSS, adjusted p-values > 0.6), but have a significant correlation with scanner changes (DDDS, adjusted p-value < 0.001). Unfortunately, the number of pairs per scenario is not balanced. On the other hand, BPFMorphoTempo and BPFautosegMS present significant variations with scanner (adjusted p-value = 0.04 and <0.001 respectively) and we confirmed a significant correlation between these two metrics and the IQMs. Because IQMs can serve as proxies for machine effects and are associated with BPF estimates, it should be possible to calibrate BV estimation to account for image quality; this is especially important for longitudinal studies. A larger dataset is required to reach a definitive answer.Acknowledgements
[1] Chow, L. S., & Paramesran, R. Review of medical image quality assessment. Biomedical Signal Processing and Control. 2016; 27, 145–154. https://doi.org/http://dx.doi.org/10.1016/j.bspc.2016.02.006
[2] Atkinson D, Hill DL, Stoyle PN, et al. Automatic correction of motion artifacts in magnetic resonance images using an entropy focus criterion. IEEE Trans Med Imaging. 1997; 16(6):903-10
[3] Shehzad, Z., Giavasis, S., Li, Q., Benhajali, et al. The Preprocessed Connectomes Project Quality Assessment Protocol - a resource for measuring the quality of MRI data. Frontiers in Neuroscience. 2015. https://doi.org/10.3389/conf.fnins.2015.91.00047
[4] Tustison, N. J., Avants, B. B., Cook, P. A., et al. N4ITK: Improved N3 Bias Correction. IEEE Transactions on Medical Imaging. 2010; 29(6), 1310–1320. https://doi.org/10.1109/TMI.2010.2046908
[5] Friedman, L., Glover, G.H., Krenz, D., et al. Reducing Inter-Scanner Variability of Activation in a Multicenter Fmri Study: Role of Smoothness Equalization. Neuroimage. 2006; 32, 1656-1668.
[6] Esteban O, Birman D, Schaer M, et al. MRIQC: Advancing the Automatic Prediction of Image Quality in MRI from Unseen Sites. PLOS ONE. 2017; 12(9). doi:10.1371/journal.pone.0184661.
[7] Fisher, E., Cothren, R. M., Tkach, J. A., et al. Knowledge-based 3D segmentation of the brain in MR images for quantitative multiple sclerosis lesion tracking. In SPIE Proc. Medical Imaging: Image Processing (pp. 19–25). 1997
[8] Rudick, R. A., Fisher, E., Lee, J. C., et al. Use of the brain parenchymal fraction to measure whole brain atrophy in relapsing-remitting MS. Multiple Sclerosis Collaborative Research Group. Neurology. 1999; 53(8), 1698–1704.
[9] Schmitter D, Roche A, Maréchal B, et al. An evaluation of volume-based morphometry for prediction of mild cognitive impairment and Alzheimer’s disease. NeuroImage: Clinical. 2015;7:7-17. doi:10.1016/j.nicl.2014.11.001.
[10] Roche, A. and F. Forbes, Partial volume estimation in brain MRI revisited. Medical Image Computing and Computer-Assisted Intervention–MICCAI 2014. 2014, Springer. p. 771-778.
References
No reference found.Figures