3409
The average sheep: multi-modal population atlases and variability maps1University of Cambridge, Cambridge, United Kingdom
Synopsis
We present a sheep atlas from 160 subjects from high-resolution MRI images. Aided by histology, cortical and subcortical regions were labelled for surgical planning and anatomical localisation. Templates for voxel-based morphometry were produced for SPM/DARTEL approaches. To demonstrate the use of the atlas and software, we analysed post mortem volumetric changes in repeatedly scanned brains from in vivo to 12 weeks post mortem.
Purpose
Large mammals are important models for neurological disease with neuroanatomy and life spans more similar to humans than rodents, yet tools for high-resolution computational neuroanatomy in such species are limited. We present comprehensive atlases for the sheep brain based on 160 animals: with high-resolution in vivo T1w, T2w and ex vivo MRI images with parallel cresyl violet and acetylcholinesterase histology. From the images, we provide maps of variability and power calculations for VBM analysis. We provide processing tools to exploit these with SPM/DARTEL and use them to perform whole-brain analysis of differential cerebral morphometry change through death and perfusion fixation.Methods
Acquisition
Live sheep (n = 82) were scanned at 1.5T (Siemens Sonata; 3D T1w 600µm isotropic MPRAGE, 3D T2w 800µm SPACE) and ex vivo sheep brains (n = 78) were scanned at 4.7T (Bruker BioSpec; 3D PD/T2w FSE 333µm). Brains of three sheep were repeatedly scanned in skull, first in vivo, shortly after death, immediately following perfusion and at intervals of 24 hours, 2, 4, 8, 12 and 16 weeks to follow post-mortem structural changes using an identical protocol to the in vivo scans. A single ex vivo brain was extracted from the skull and sliced at 30µm intervals. Sections at 150µm intervals were stained with cresyl violet and at 300µm intervals for acetylcholinesterase. All slides were imaged using a high-resolution NanoZoomer slide scanner (Hamamatsu).
Processing and analysis
In vivo and ex vivo images were processed separately with identical pipelines based on SPM8 (Wellcome Trust Centre for Neuroimaging, UCL) with the SPMMouse toolbox (provided by Cambridge University). Images were segmented into grey matter (GM), white matter (WM) and cerebrospinal fluid and registered together with DARTEL to produce templates at 0.8mm (in vivo) and 0.4mm (ex vivo). Histological slides were aligned to a continuous stack (ImageJ) and linearly registered to the MRI volume of the same subject image using SPMMouse (allowing for translation, rotation and scaling). Analyze (Mayo Clinic) was used to segment the high-resolution warped DARTEL templates with reference to both in vivo and ex vivo data and both histological stains.
Results and discussion
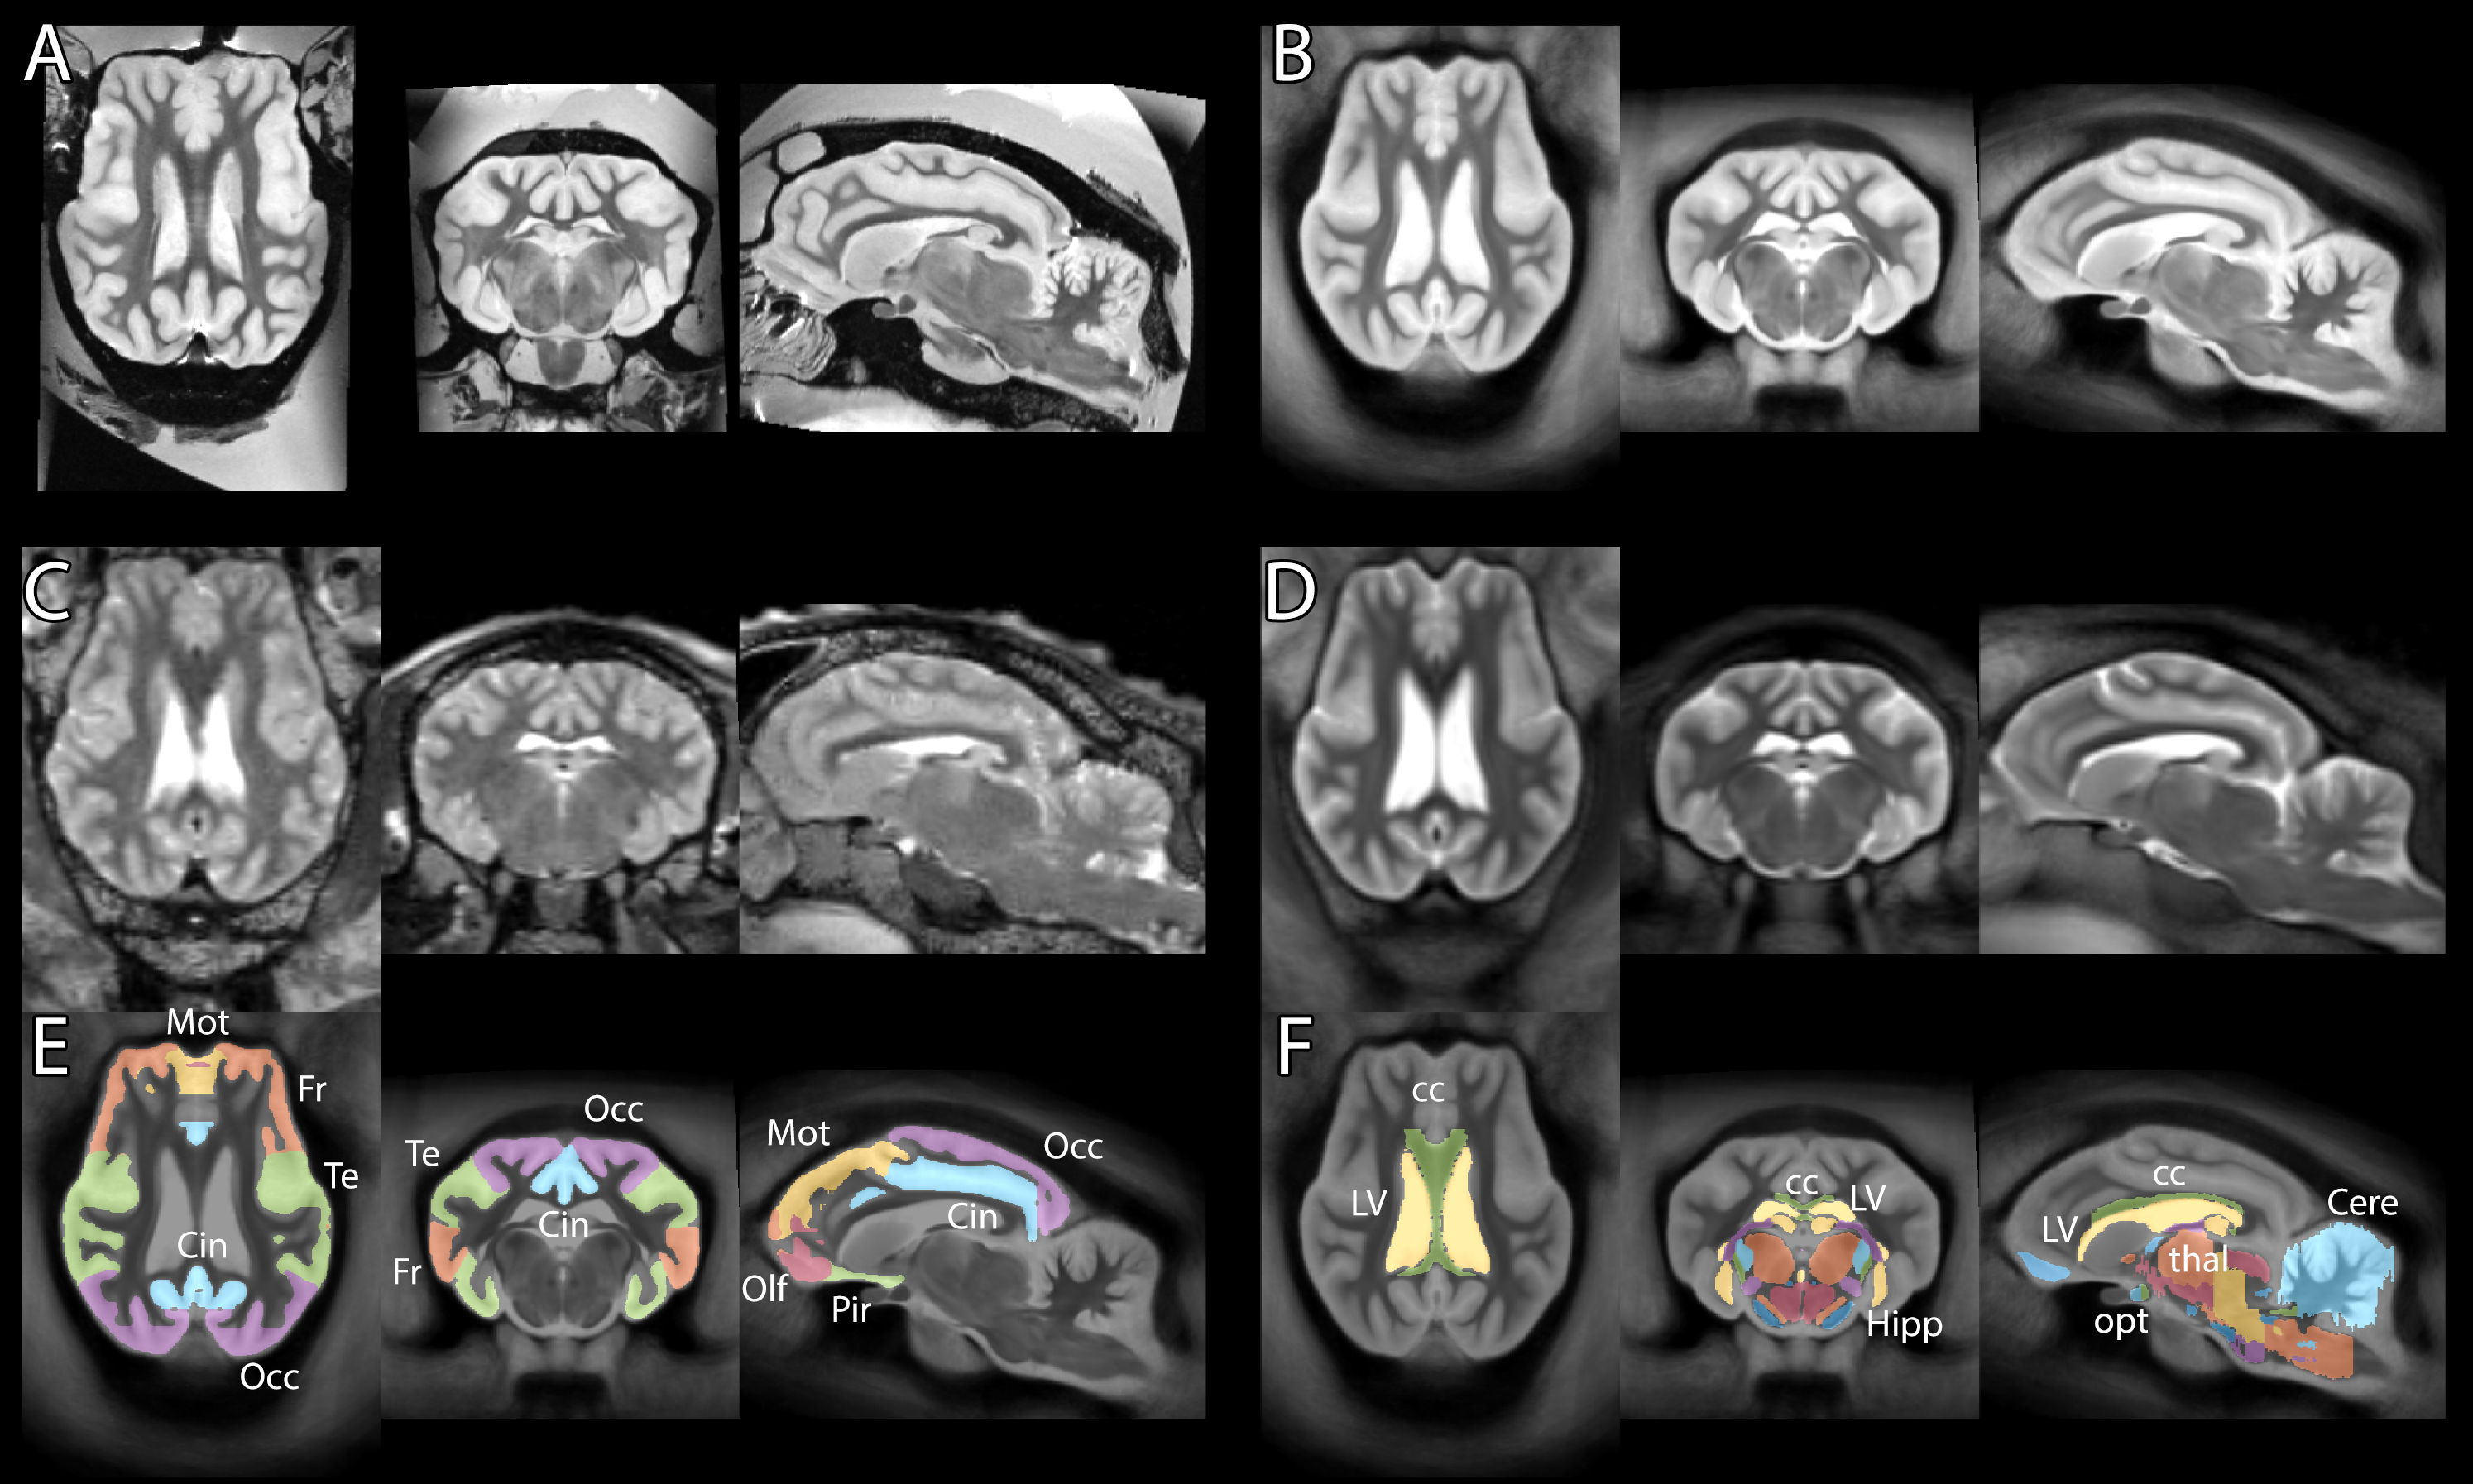
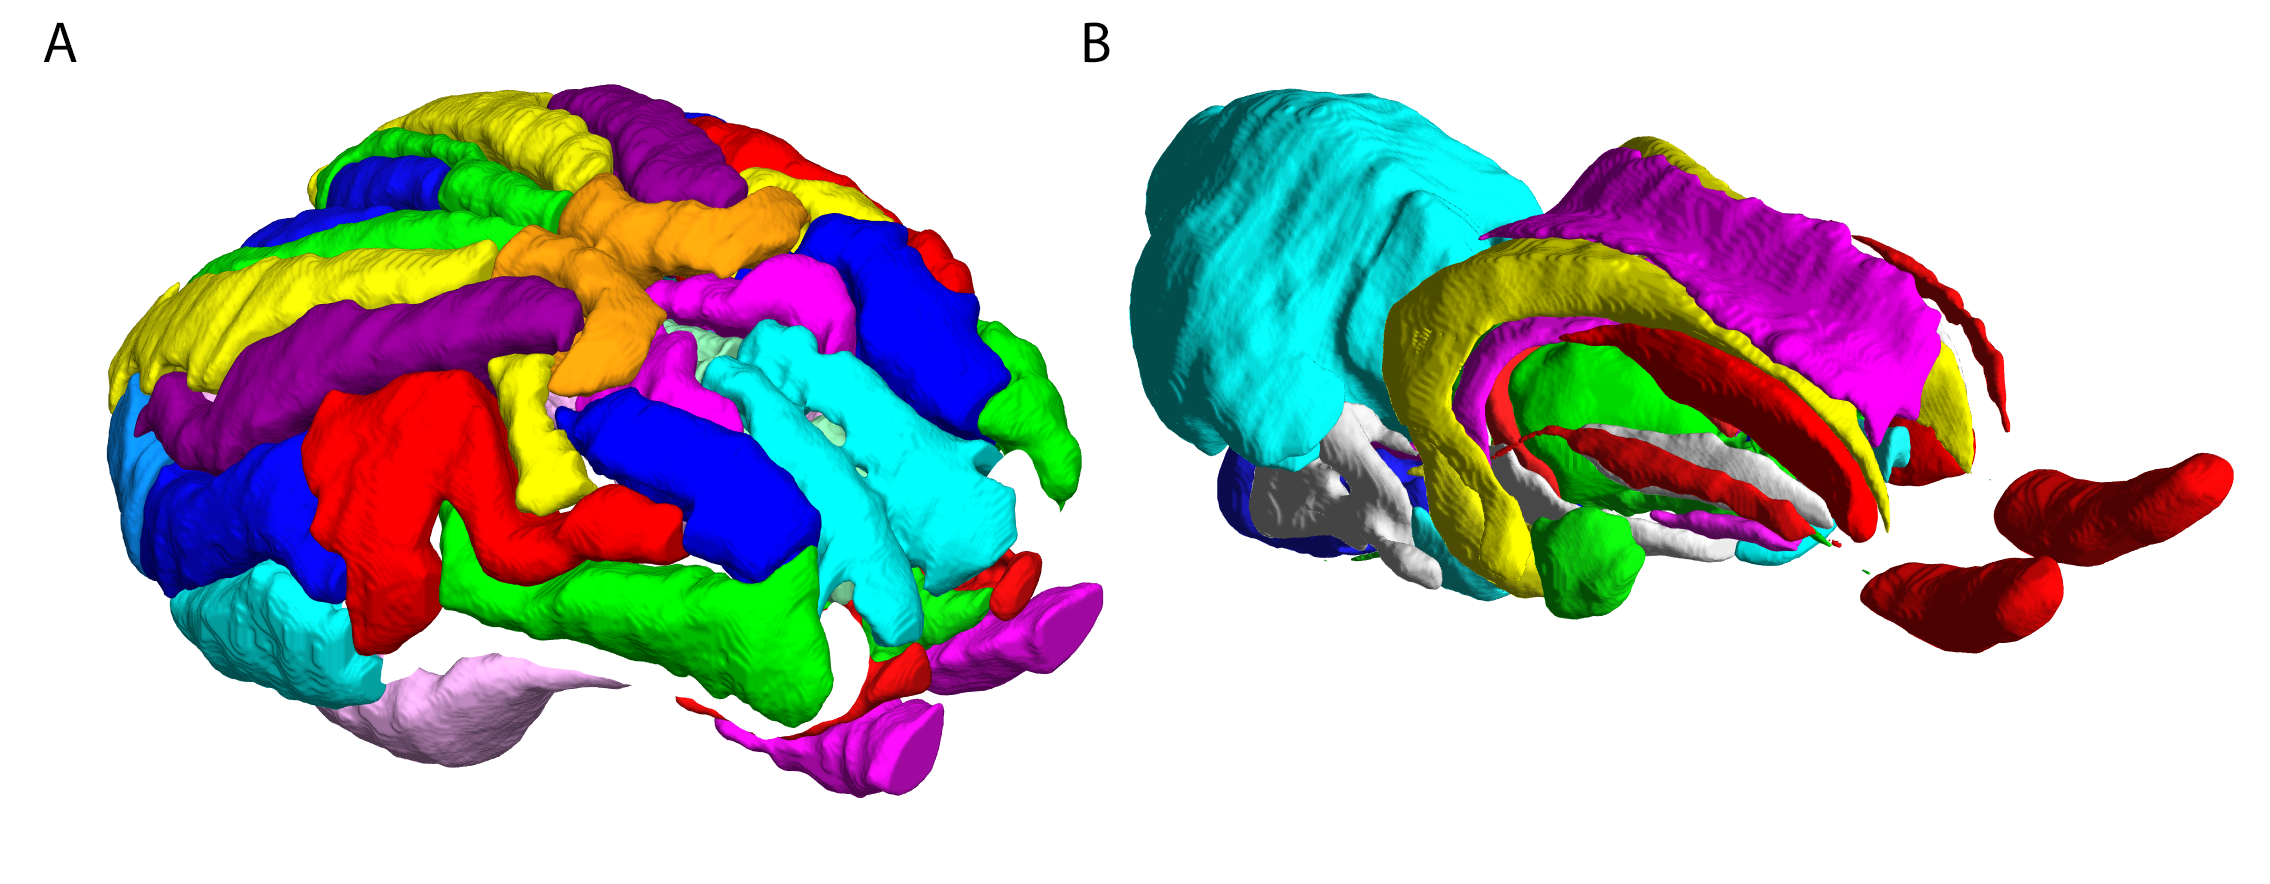
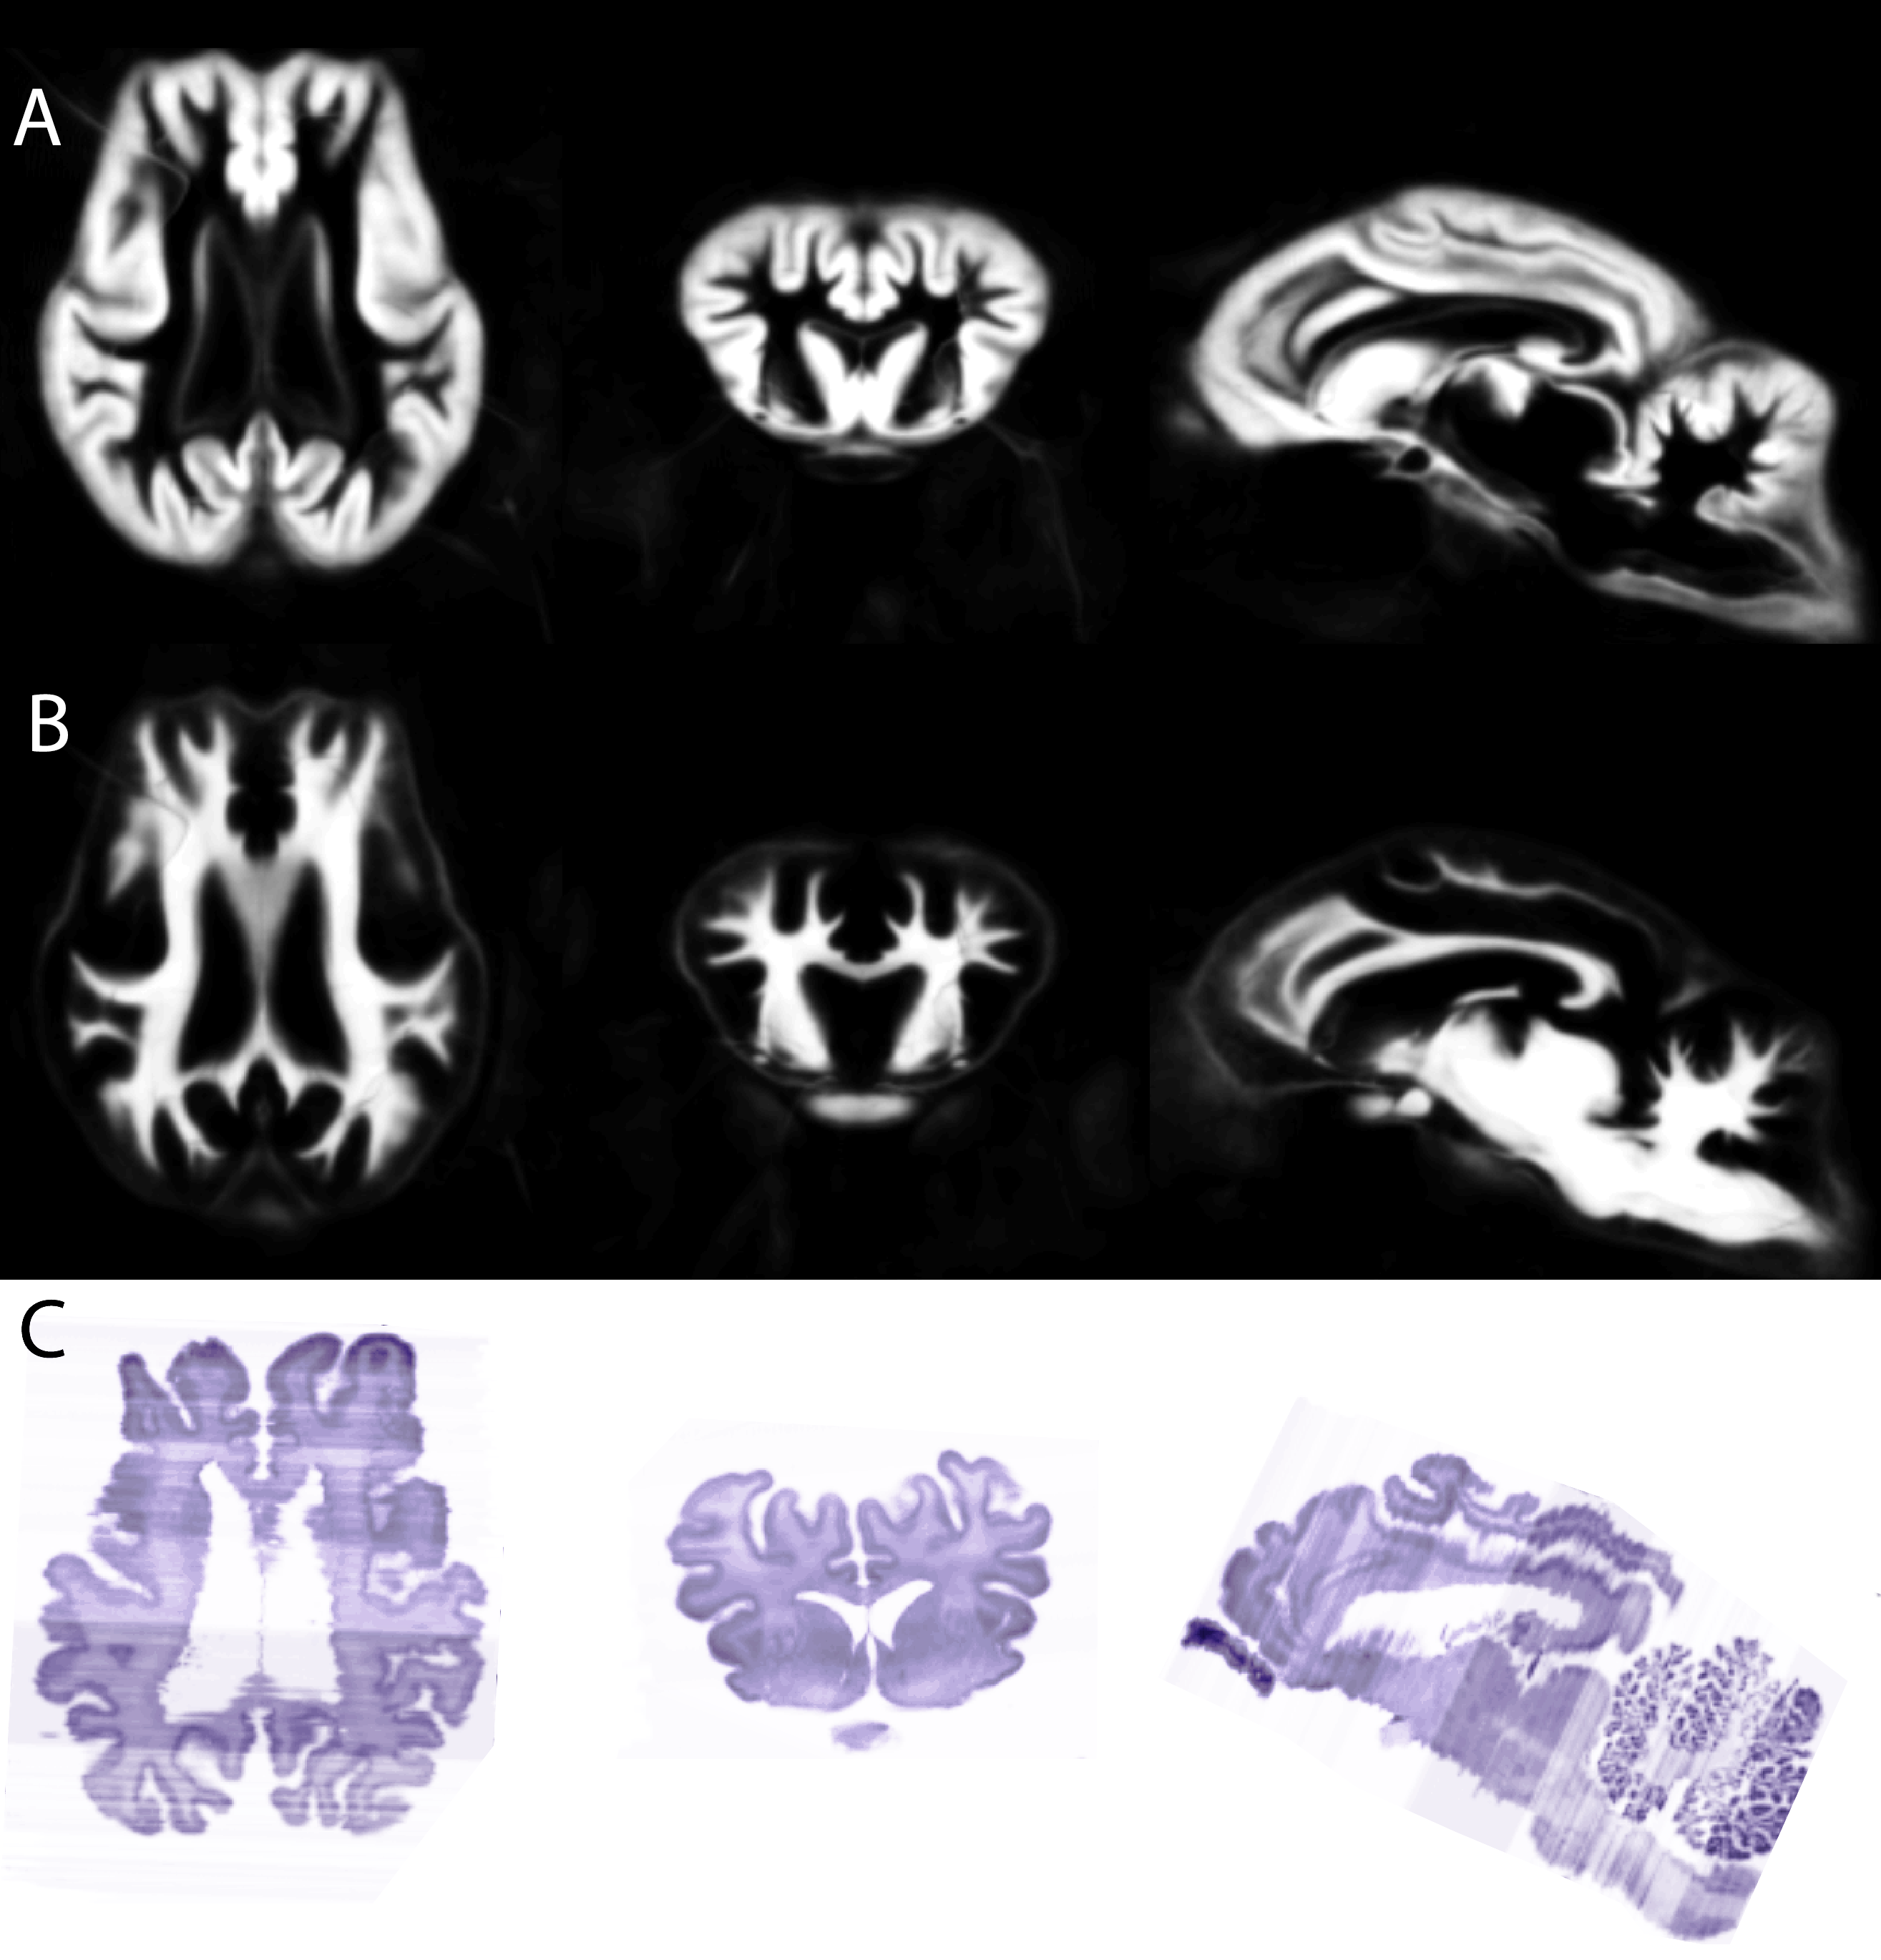
Typical images and templates for in vivo and ex vivo brains are shown in Figure 1, with segmentations of cortical and subcortical structures. 3D reconstructions of the structures in the atlas are shown in Figure 2. GM and WM segmentations are shown in Figure 3 with the aligned cresyl violet stack for the whole brain.
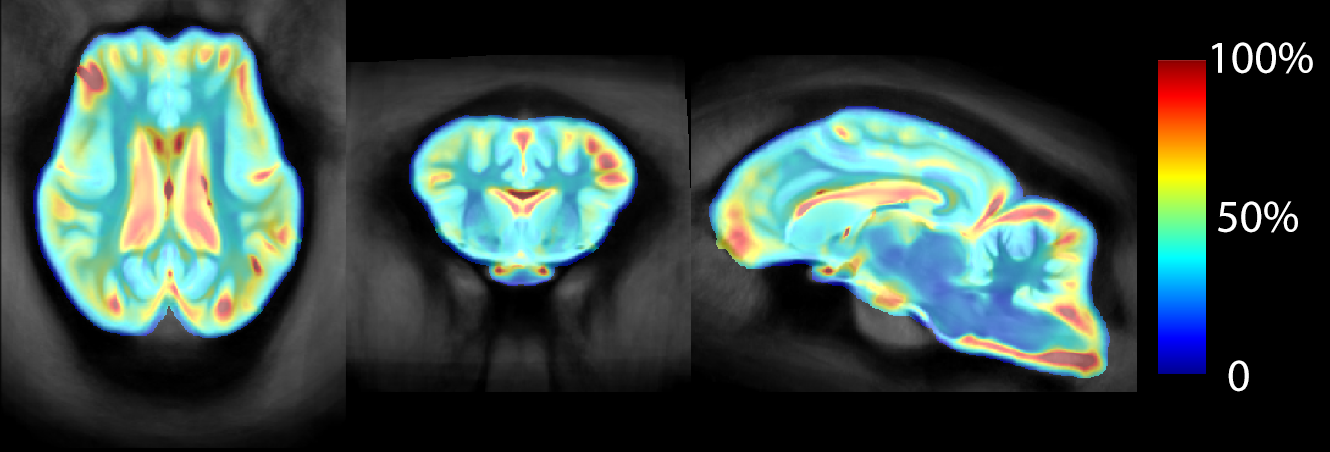
Most of the variability in sheep brain anatomy was seen surrounding the ventricular system and the cortex, especially the frontal cortex (Figure 4). Power calculation maps based on GM segmentation suggest group sizes of 10-12 are sufficient for an 80% chance to detect a 20% change for cortical regions with groups of 7-9 for subcortical regions. For a 50% change in GM, groups of 5 are sufficient for all regions except for the frontal pole.
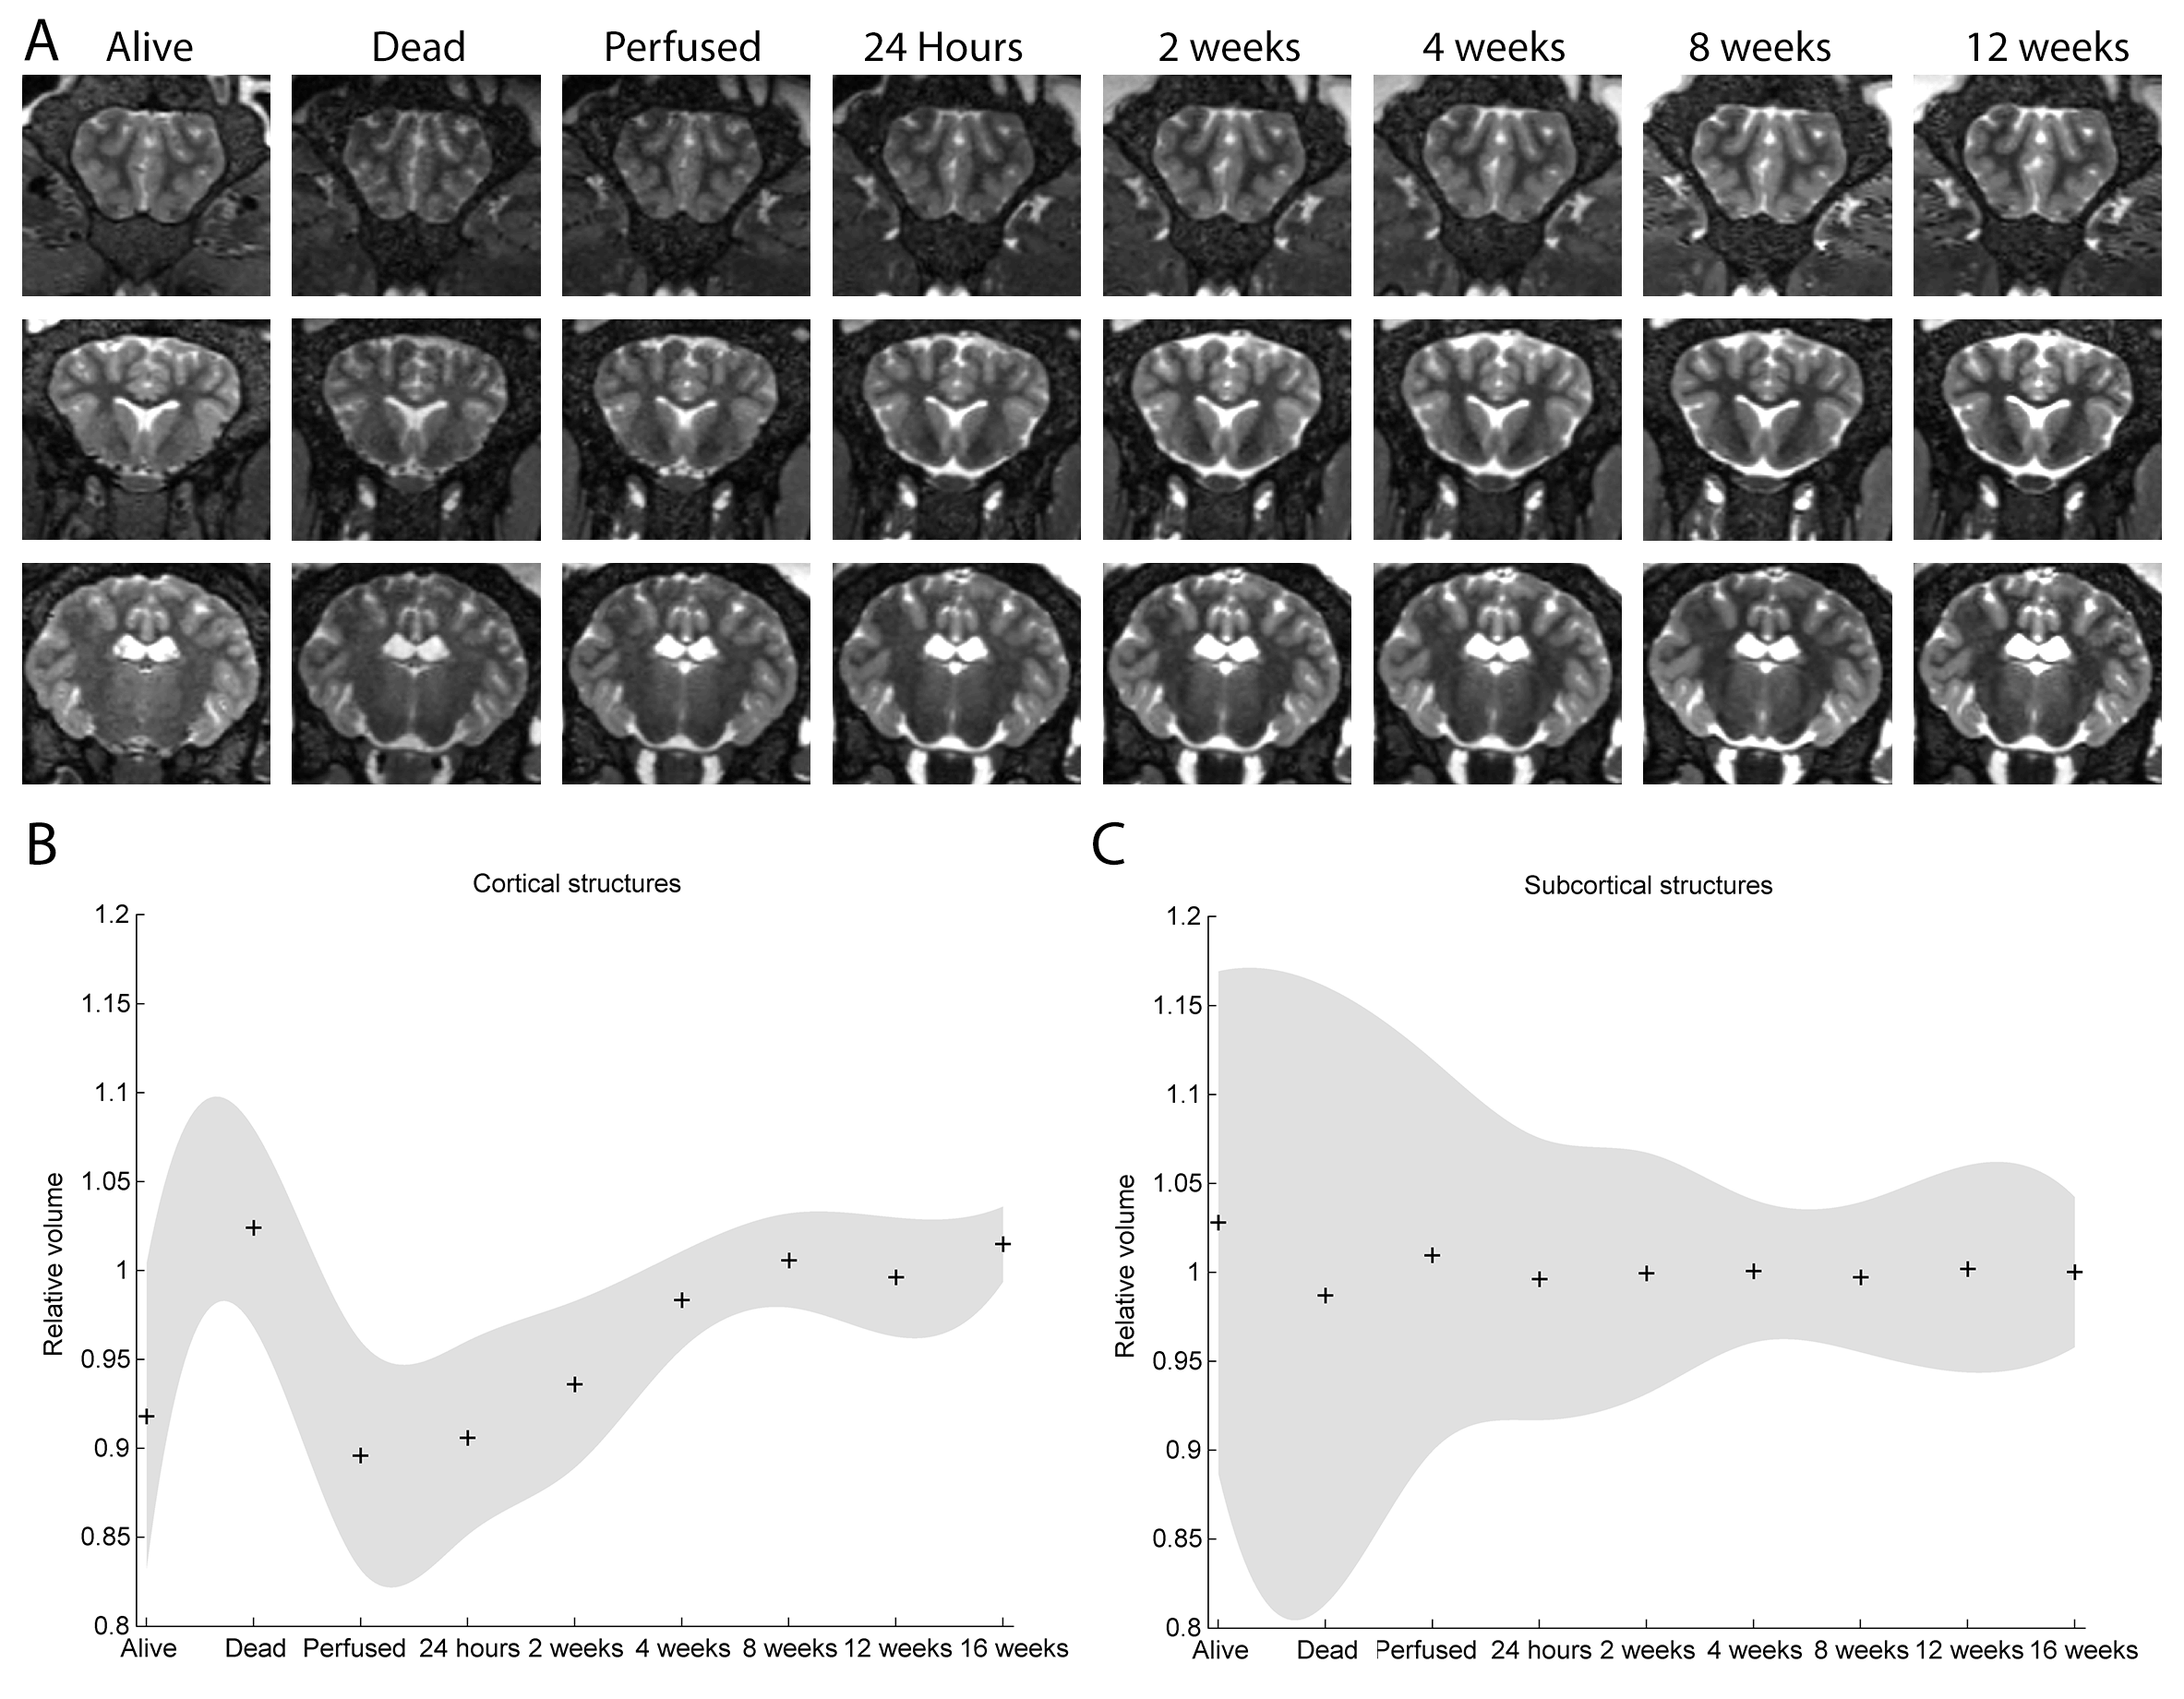
Striking changes in contrast appear following death (Figure 5). The graphs show mean and 95% confidence intervals for volumes measured with the atlas and Jacobian determinants from the image registration (normalised to the long term mean: post 4 weeks). Cortical volumes appear slightly larger ex vivo than in the live brain, with ~10-15% variability immediately following death settling to below 10% within a month. We recommend, therefore, that studies involving post mortem tissue maintain consistent timing from death to scan, or wait one month before beginning.
The resources we present allow fully-automated morphometric analysis of the sheep brain, both live or dead. The atlas should be invaluable, not only for identifying regions of interest within the sheep brain, but also for understanding transformational differences between in vivo and ex vivo preparations and accurate surgical planning. The atlas and the constituents (MRI and all histology slides) are freely available as an online resource from our institutional repository.
Acknowledgements
This project was funded by CHDI Inc. We thank Ms. Loren Matthews, Mr James Stewart, and Dr Thomas Watson for excellent technical assistance.References
No reference found.Figures