3407
A Bootstrap Analysis of Diffusion MRI Parameters Derived from Simultaneous Multislice Diffusion MRI1NICHD, National Institutes of Health, Rockville, MD, United States, 2Biomedical Engineering, University of Arizona, Tucson, AZ, United States
Synopsis
In this study, we design a unique bootstrapping method to approximate the distributions of diffusion MRI parameters derived from scans that utilize simultaneous multislice techniques compared to the distribution of parameters fit from a single slice EPI sequence. While there are no statistically significant differences between accelerated and non-accelerated datasets, there are some subtle differences that may warrant closer inspection.
Introduction
Simultaneous Multislice (SMS) acquisition methods are rapidly gaining popularity in both functional MRI and diffusion MRI because of the significant time savings and/or increased temporal resolution they can provide1. Increasing the speed of diffusion imaging acquisition makes multidirection, multishell diffusion techniques more feasible for both research and clinical applications. However, a need remains for quantitative validation of the microstructural tissue parameter maps derived from accelerated techniques such as SMS. In this work, we improve upon past evaluation using a bootstrap analysis to compare diffusion MRI parameters derived from images collected with and without SMS methods.Methods
Data Collection:
A single healthy volunteer was repeatedly scanned on a clinical 3T system in a single session. A multiple-direction, multiple-shell diffusion experiment was designed with 6 b=0 s/mms, 40 b=1000 , 60 b=2000, and 80 b=3000 s/mms images collected. The diffusion directions were determined using a multishell electrostatic repulsion scheme similar to that described in [2]. This experiment was run once with slice acceleration (TR/TE = 3600/115 ms, acceleration factor of 3, FOV shift of ½ ) and once without (TR/TE = 10700/115 ms). An in-plane GRAPPA acceleration of 2, matrix size of 128x128x69, and 2mm isotropic resolution was used for both scans.
Data Preprocessing:
The diffusion weighted images were corrected for EPI distortions using FSL’s TOPUP3, eddy currents using FSL’s eddy4, denoised using an in house implementation of LPCA denoising5, and corrected for signal intensity bias using ANTs’ N4 technique6.
Data Analysis:
We randomly sampled 2 b=0, 20 b=1000, 30 b=2000, and 40 b=3000 s/mm2 from both the accelerated and non accelerated data 50 times to generate 50 unique datasets. Each of these datasets were processed with in house diffusion tensor analysis to generate FA and MD maps and with in house MAP MRI analysis to generate propagator anisotropy (PA), non-gaussianity (NG), return-to-origin probability (RTOP) and return-to-axis probability (RTAP)7. These parameter maps were used to generate voxel-wise distributions of parameters for voxel-wise statistical analysis. For each parameter map, we performed permutation testing and corrected for multiple comparisons using a single threshold test8 to generate voxel-wise maps of statistical differences in the data generated from standard and accelerated acquisitions. All statistical analysis was performed using MATLAB 2017a.
Results
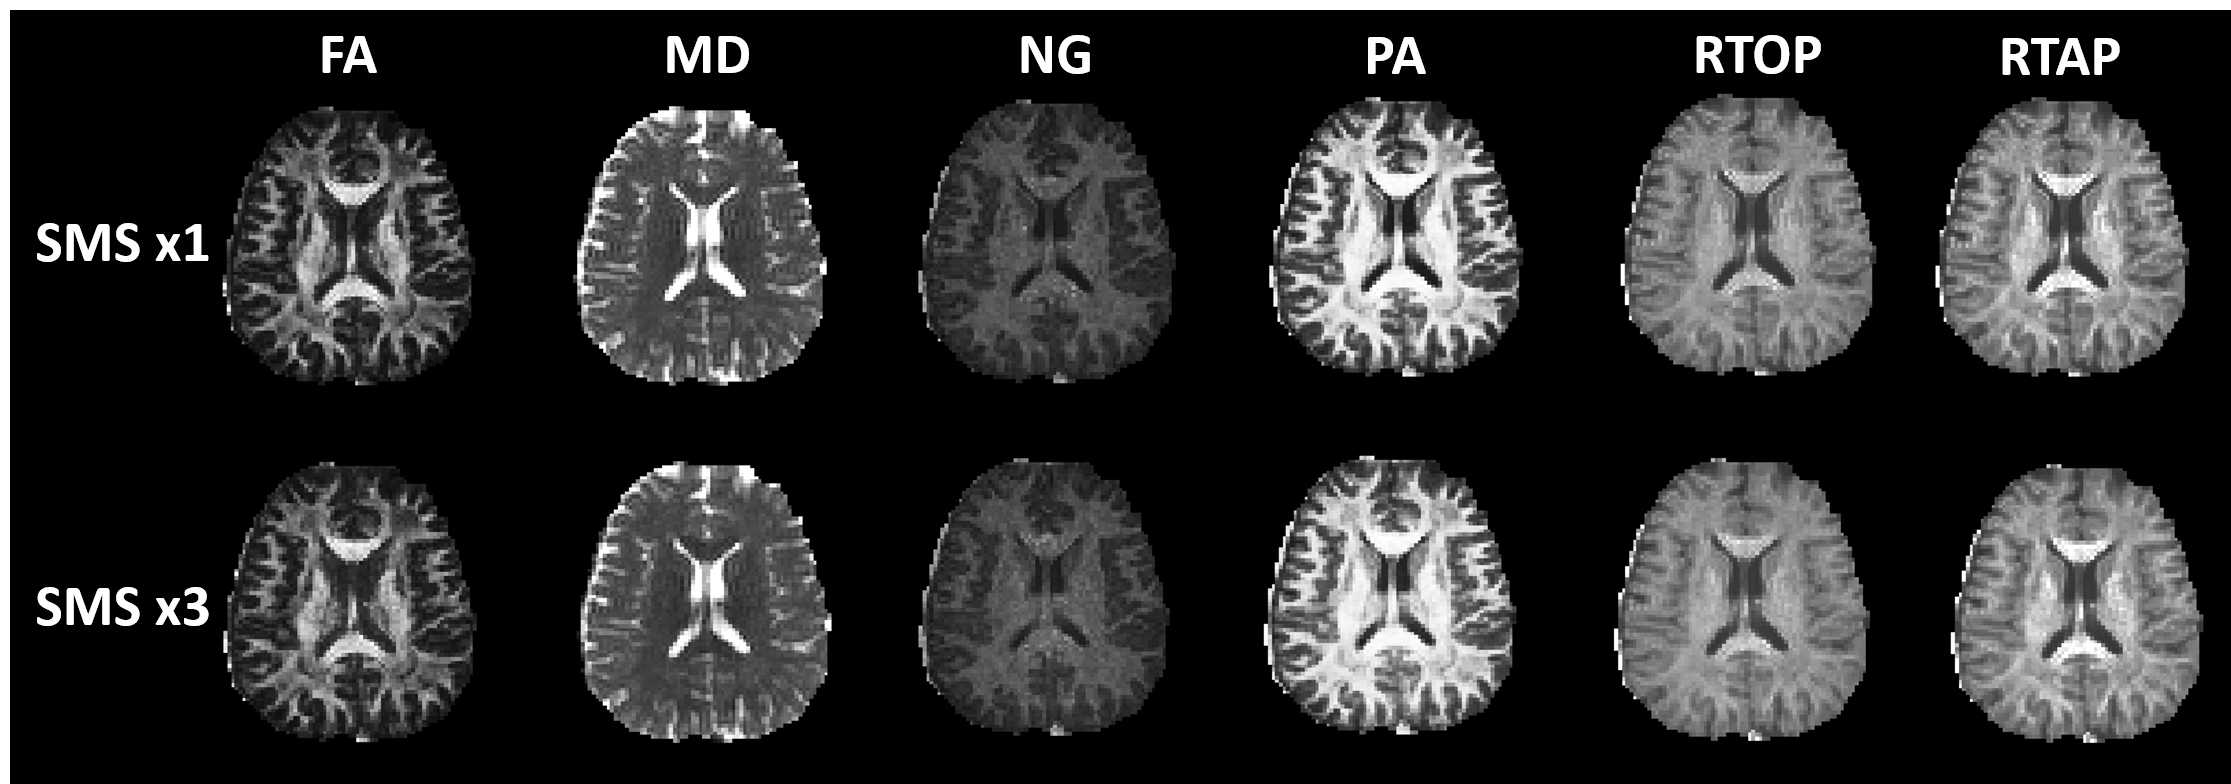
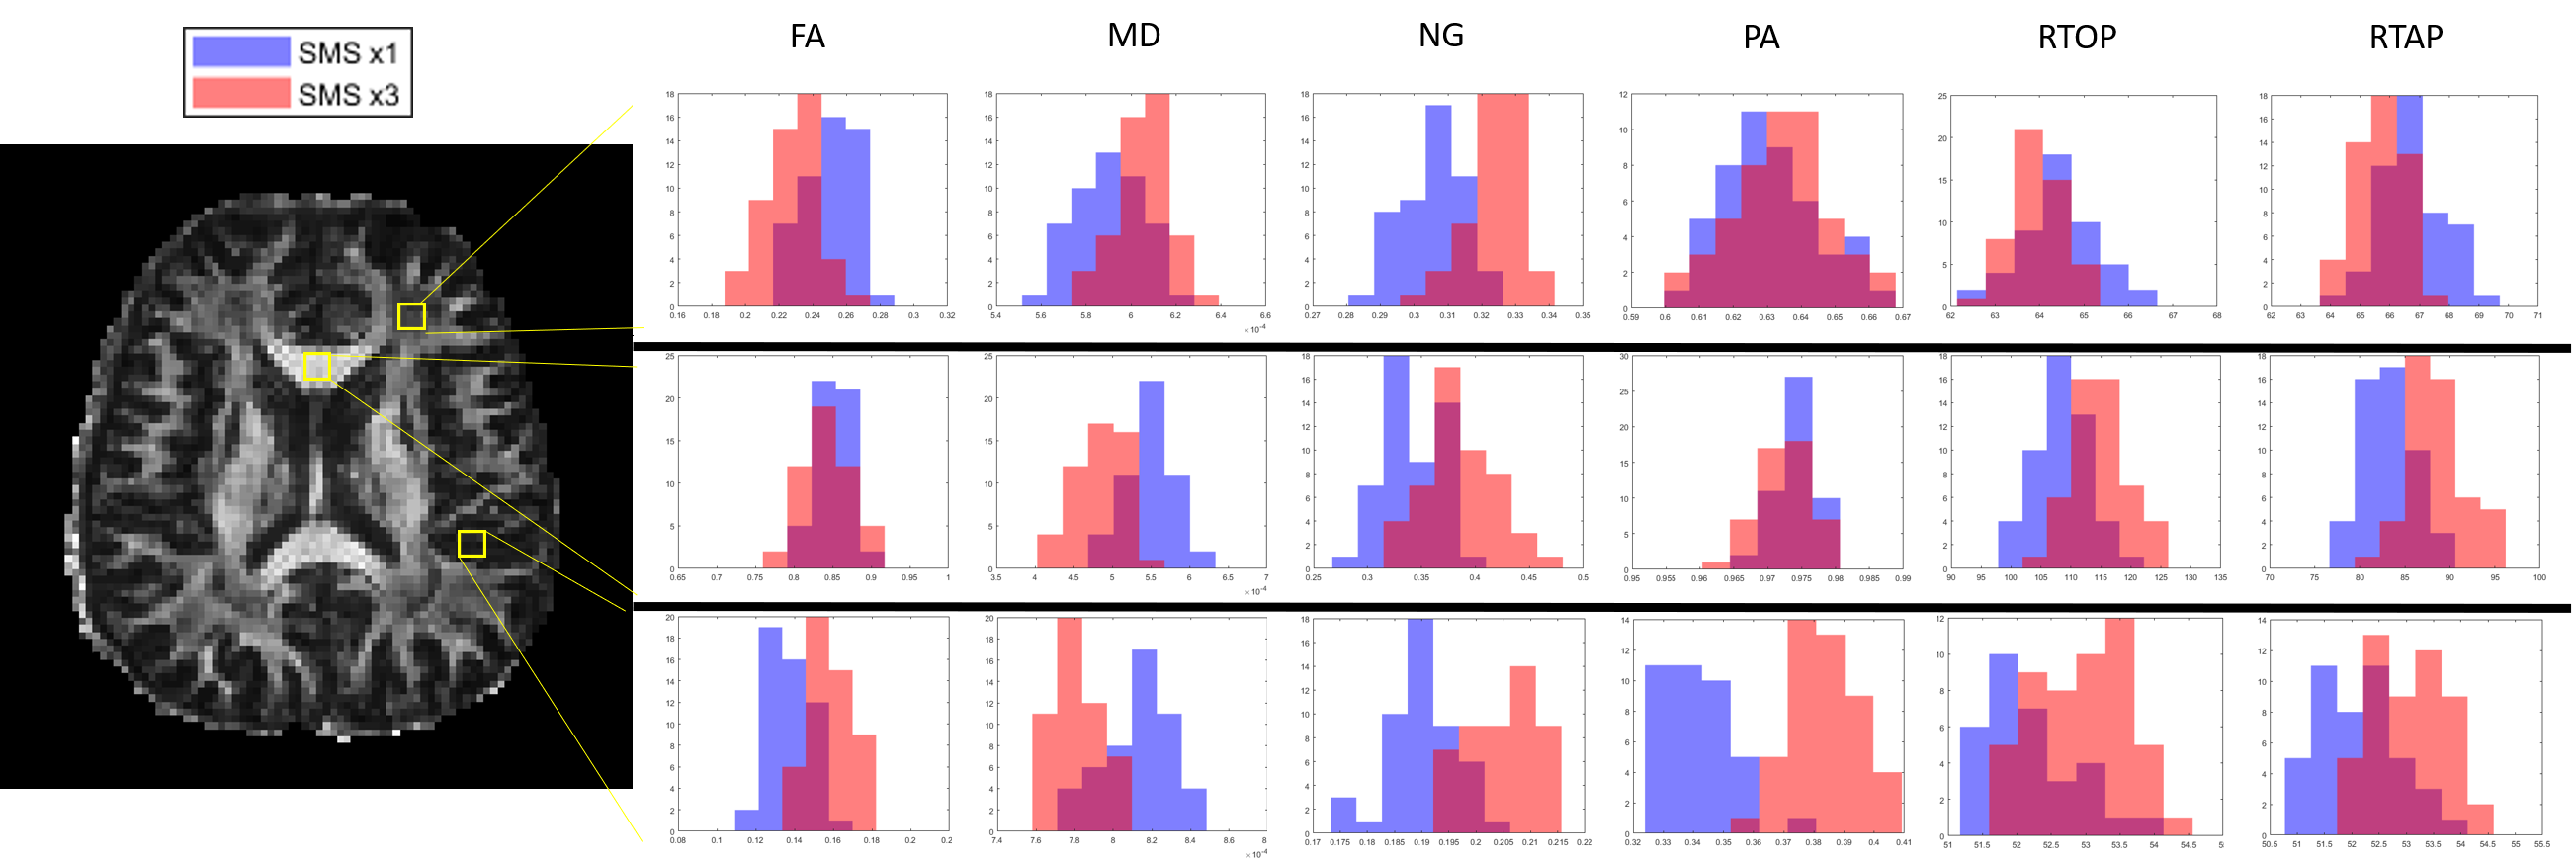
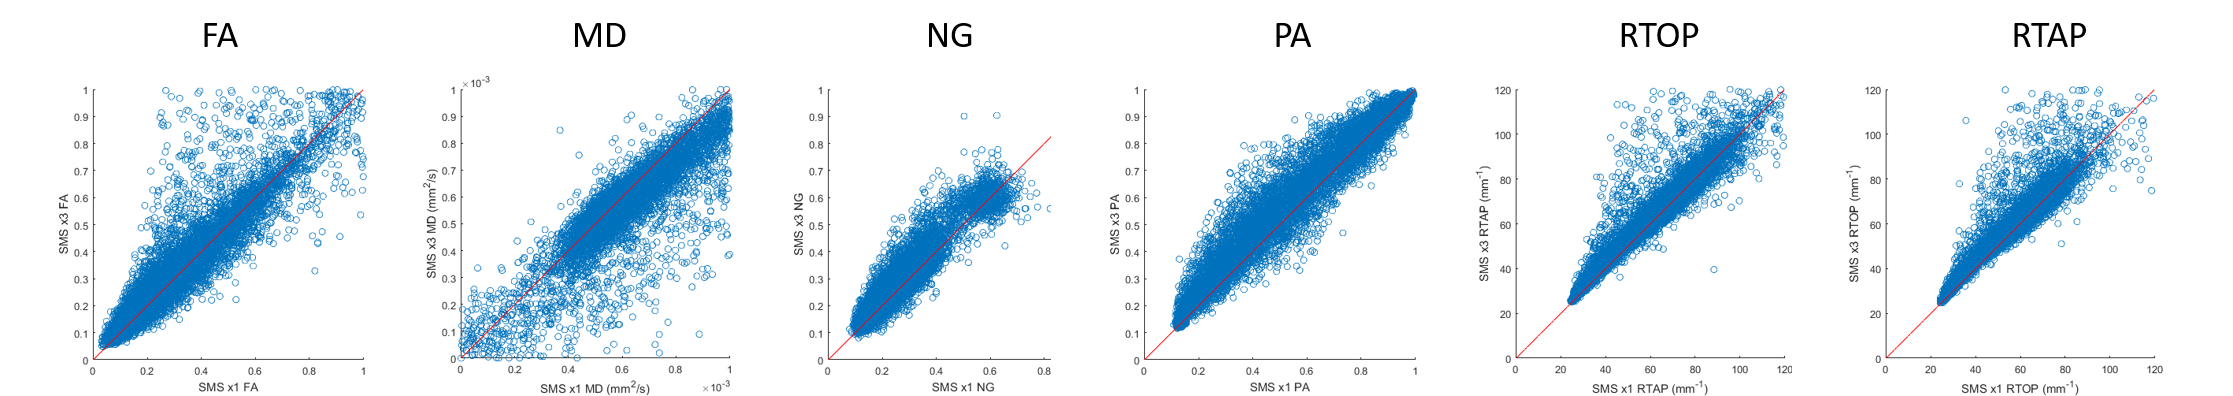
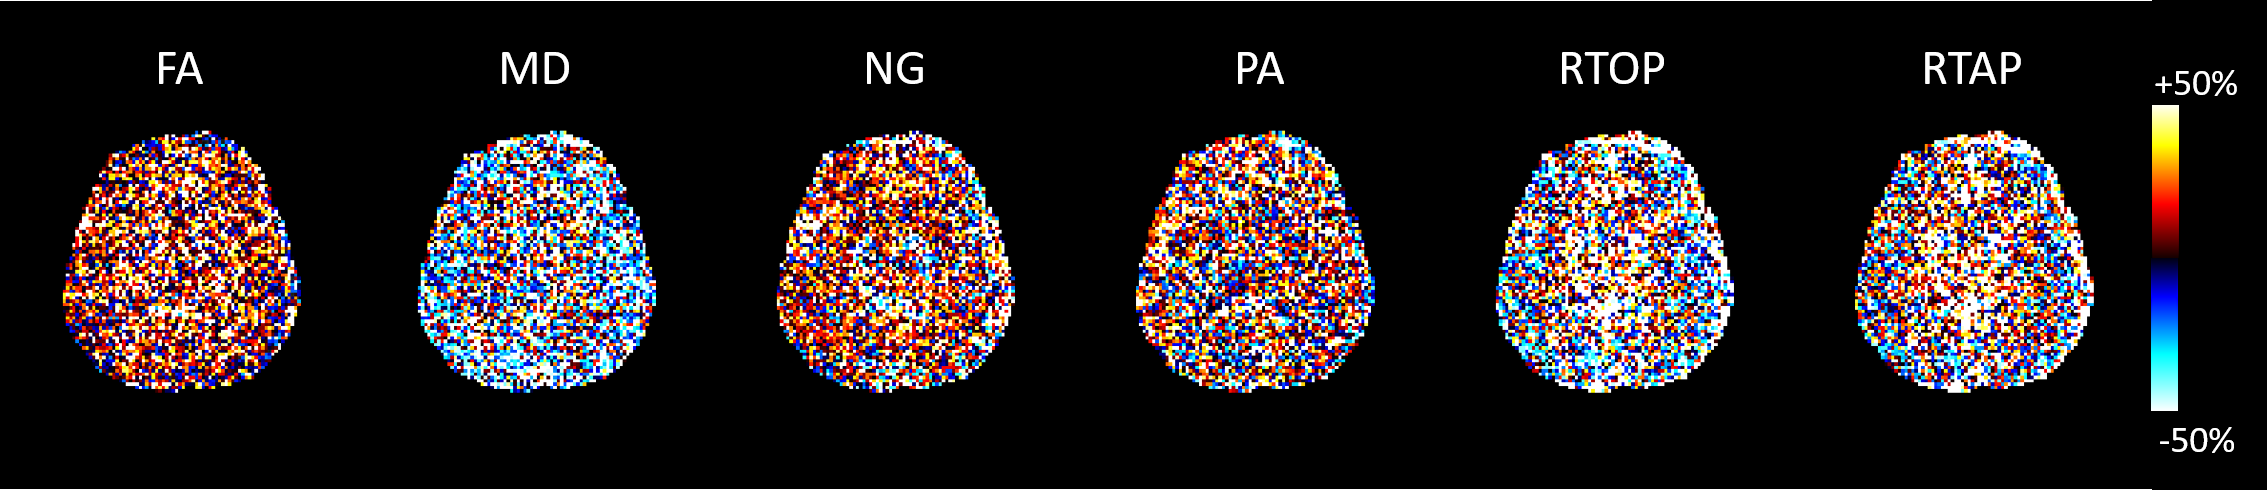
Figure 1 shows the parameter maps produced from the entire non-accelerated and accelerated acquisitions. Figure 2 presents a demonstration of the parameter distributions in various brain regions generated by the bootstrapping technique described above. Figure 3 plots parameter values from the accelerated dataset against the same values from the non accelerated dataset in order to visualize an bias caused by using one technique vs the other. Finally, Figure 4 maps the difference in standard deviations of the bootstrapped distributions to identify the relative degree of uncertainty when estimating different parameters. Voxel-wise statistical analysis revealed no brain regions that were statistically significantly different between the two acquisitions, so statistical maps have been left out.Discussion
Statistical analysis suggests that the parameter maps derived from an accelerated acquisition are largely the same as those derived from an unaccelerated acquisition. Nevertheless, there are a few patterns in the data to note. Several of the bootstrap-derived distributions shown in Figure 2 appear to be significantly different while other distributions are almost identical, and it depends somewhat on which part of the brain is being analyzed as well as which microstructural parameter is being evaluated. Additionally, as shown in Figure 3, the mean diffusivity appears to be slightly underestimated by the accelerated data while propagator anisotropy and non-gaussianity appear, in general, to be overestimated. Finally, we note that aside from the mean diffusivity, the uncertainty in microstructural parameter estimation is generally larger when using slice acceleration. This may not be a major issue, as others have demonstrated the relatively good test re-test of slice-accelerated data9.Conclusion
The huge time savings and lack of statistical differences between data acquired may very well outweigh any of the potential downsides to SMS imaging discussed above. Without investigating effects of different relaxation times, magnetization transfer, and partial volume effects it is difficult to pinpoint the source of the subtle differences noted between the two techniques.Acknowledgements
No acknowledgement found.References
- Setsompop K, Gagoski BA, Polimeni JR, Witzel T, Wedeen VJ, Wald Lawrence. Blipped-controlled aliasing in parallel imaging for simultaneous multislice echo planar imaging with reduced g-factor penalty. Magnetic Resonance in Medicine. 2012 67(5): 1210-1224
- Caruyer E, Lenglet C, Sapir G, Deriche R. Design of multishell sampling schemes with uniform coverage in diffusion MRI. Magnetic Resonance in Medicine. 2013 69(6): 1534-1540
- J.L.R. Andersson, S. Skare, J. Ashburner How to correct susceptibility distortions in spin-echo echo-planar images: application to diffusion tensor imaging. NeuroImage, 20(2):870-888, 2003.
- Jesper L. R. Andersson and Stamatios N. Sotiropoulos. An integrated approach to correction for off-resonance effects and subject movement in diffusion MR imaging. NeuroImage, 125:1063-1078, 2016.
- Manjon JV, Coupe P, Concha L, Buades A, Collins DL, Robles M. Diffusion Weighted Image Denoising Using Overcomplete Local PCA. PLoS One. 2013 Sep 3;8(9).
- N. Tustison et al., N4ITK: Improved N3 Bias Correction, IEEE Transactions on Medical Imaging, 29(6):1310-1320, June 2010.
- Ozarslan E, Koay CG, Shpherd TM, Komlosh ME, Irfanoglu MO, Pierpaoli C, Basser PJ. Mean apparent propagator (MAP) MRI: a novel diffusion imaging method for mapping tissue microstructure. Neuroimage. 2013 Sep; 78:16-32
- Nichols TE, Holmes AP. Nonparametric Permutation Tests For Functional Neuroimaging: A Primer with Examples. Human Brain Mapping. 2001. 15:1-25
- Fei Duan BS, Tengda Zhao MS, Yong He PhD, Ni Shu PhD. Test-retest reliability of diffusion measures in cerebral white matter: A multiband diffusion MRI study. Journal of Magnetic Resonance Imaging. October 2015. 42(4): 1106-1116.
Figures