3393
16-channel pTx body MRI for reduced field of view lumbar spine and kidney imaging at 7 Tesla1Erwin L. Hahn Institute for MRI, University of Duisburg-Essen, Essen, Germany, 2High Field and Hybrid MR Imaging, University Hospital Essen, Essen, Germany, 3University of Applied Science Ruhr West, Mülheim an der Ruhr, Germany, 4Division of Medical Physics in Radiology, German Cancer Research Center (DKFZ), Heidelberg, Germany
Synopsis
In this work we present in-vivo pTx excitation results in the low flip angle regime with a 16-channel transceiver body array at 7 Tesla. The pTx pulse calculation was based on a jointly fast acquired B0 and single-channel B1+ dataset (B01TIAMO) of the central abdomen. The pTx pulse enabled us to acquire high-resolution reduced field of view images of the distal spinal cord and the unilateral left kidney. The results of the established workflow for abdominal pTx provide promising perspectives, especially for neuroradiological spine imaging.
Purpose
Parallel transmit (pTx) body imaging[1,2] offers the possibility for higher resolution reduced field of view imaging (rFOV), without fold-in artifacts and incorporating the mitigation of the inherent RF transmit field (B1+) inhomogeneities at ultrahigh field (UHF) MRI. To make use of this technique, not only suitable hardware but also an exact knowledge of the in-vivo main magnetic (B0) and B1+ field distribution is necessary. Accordingly, B01TIAMO[3,4] has proven to provide accurate data of the abdomen even for many transmit channels during a single breath-hold. Here we present results for spinal cord and kidney rFOV pTx in the low flip angle regime with a 16-channel transceiver array.Methods
Data were acquired on a 7T UHF MRI system (Magnetom 7T, Siemens Healthcare, Erlangen, Germany) equipped with a custom-built 16-channel Tx/Rx body array[5] (Figure 1). The amplitudes and phases of the individual transmit channels were controlled by an add-on system including online SAR supervision[6,7]. The 10s-average maximum forward input power per channel was below 10 W during all in-vivo pTx measurements.
One B0 offset map and 16 single-channel B1+ maps were jointly acquired with B01TIAMO in 12 seconds for a healthy male volunteer (1.89m; 80kg) at the axial position of the intervertebral disc between L2 and L3 (Figure 2). In a first step, error-prone low-SNR regions in the image center and air-filled compartments were masked to prevent false scaling. Afterwards, a linear least-square solver was applied for extrapolation of the respective voxels within the sparse matrix.
The pTx pulse calculation was solved for the RF excitation b = argmin{|| |Ab| - m ||2}, with system matrix A and target transverse magnetization m with a smooth and slowly varying spatial phase profile[8]. A 13-turn 2D spiral-in gradient trajectory with variable density was applied in combination with the resulting non-selective RF pulse of 5.6 ms duration for excitation of the spinal column and left kidney volume (Figure 3). An additional 2 ms non-selective fat-saturation RF pulse preceded the pTx excitation. The readout/phase-encoding direction of the 3D gradient echo (GRE) sequence was aligned to the longitudinal body axis to allow time-optimized acquisitions.
The full FOV 3D GRE pTx parameters for the spine/left kidney were TA 119 s/40 s, TE 8 ms, TR 25 ms, 256x160x104 matrix/128x80x52 matrix, 2 mm3/4 mm3 resolution, iPAT 2x2. For the zoomed-in rFOV pTx imaging of the spine/left kidney the parameters were TA 453 s/36 s, TE 8 ms, TR 25 ms, 770x192x160 matrix/320x60x52 matrix, 0.65 mm3/1.56 mm3 resolution, iPAT 2/2x2. For comparison, a standard 3D GRE with TIAMO[9] was conducted within a breath-hold: TA 48 s, TE 3 ms, TR 6 ms, 256x168x120 matrix, 2 mm3 resolution, partial Fourier 6/8(phase) 7/8(slice), iPAT 2x2.
Results
In Figure 3 the results of the Bloch simulation flip angles α show a normalized root-mean-square error (nRMSE) of 32.69% for the spinal cord and 10.26% for the left kidney region in comparison to the respective pTx target excitation patterns. Especially with strict α scaling, there were some residual signal areas visible in the outer body region and sporadic miscalculated voxels in the area of the ventral intestines, which result in local phase φ irregularities. Nevertheless, it was possible to achieve sufficient magnitude background suppression for the non-target sectors with an overall smooth phase profile for both selective excitations.
Image planes of the lumbar spine for the different techniques are presented in Figure 4. Despite the reported low nRMSE score, the in-vivo pTx results provide evidence of a distinct excitation profile along the longitudinal axis. This enabled high-resolution rFOV imaging of the distal spinal canal with clear depiction of the conus medullaris, cauda equina, and filum terminale that was not compromised by motion artifacts.
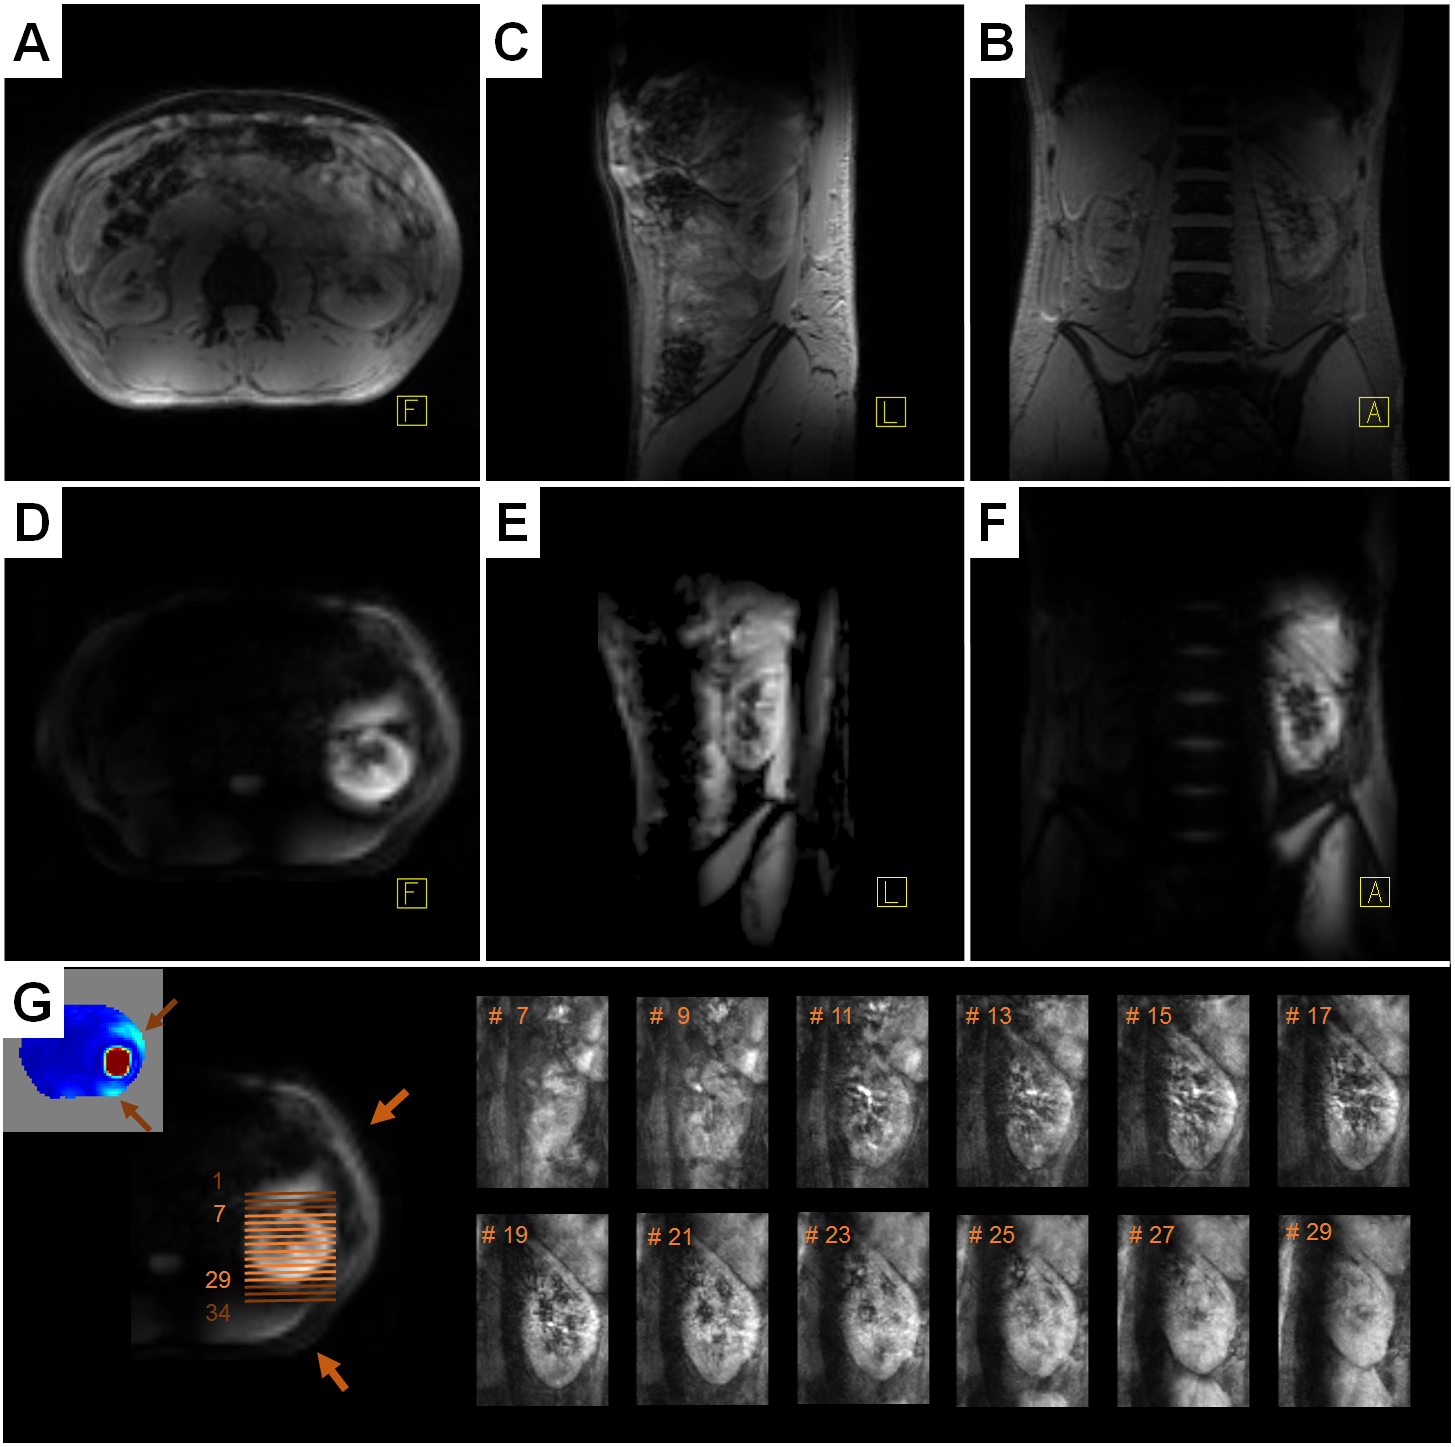
Figure 5 presents the in-vivo pTx results for the left kidney region. The excitation profile includes abdominal regions affected by intestinal activity and the need for breath-holding limited the acquisition parameters. Therefore, the rFOV pTx images contain fold-in artifacts but the discrimination of the renal cortex, medulla, and pelvis was possible with a 2.6-times higher resolution as for full FOV pTx.
Discussion and Conclusion
16-channel high-resolution rFOV pTx imaging of the abdomen with satisfactory background suppression has been demonstrated for defined regions. The quality of the single axial slice B0/B1+ data was adequate for pTx pulse calculation, in contrast to our previous assumption4. The spinal column results are promising, and the signal-to-noise ratio could be improved with an additional receive-only coil array. The application of rFOV pTx for single-organ excitation, as successfully presented here for the kidney, shows the potential but also demonstrates the limits of in-vivo application.Acknowledgements
The research leading to these results has received funding from the European Research Council under the European Union's Seventh Framework Programme (FP/2007-2013) / ERC Grant Agreement n. 291903 MRexcite.References
[1] Katscher U, Boernert P, Leussler C, et al. Transmit SENSE. (2003) MRM 49(1): 144-50.
[2] Grissom W, Yip CY, Zhang Z, et al. Spatial Domain Method for the Design of RF Pulses in Multicoil Parallel Excitation. (2006) MRM 56(3): 620-629.
[3] Brunheim S, Gratz M, Johst S, et al. Fast and Accurate Multi-channel B1+ Mapping Based on the TIAMO Technique for 7T UHF Body MRI. (2017) MRM [epub ahead of print]. DOI: 10.1002/mrm.26925
[4] Brunheim S, Johst S, Orzada S, et al. Fast Multi-slice B1 and B0 mapping (B01TIAMO) for 32-channel pTx Body MRI at 7 Tesla. (2017) Proc. Intl. Soc. Mag. Reson. Med. 25: p. 521.
[5] Orzada S, Maderwald S, Kraff O, et al. 16-channel Tx/Rx Body Coil for RF Shimming with Selected Cp Modes at 7T. (2010) Proc. Intl. Soc. Mag. Reson. Med. 18: p. 50.
[6] Shooshtary S, Gratz M, Ladd ME, Solbach K. High-Speed RF Modulation System for 32 Parallel Transmission Channels at 7T. (2014) Proc. Intl. Soc. Mag. Reson. Med. 22: p. 544.
[7] Orzada S, Bitz AK, Solbach K, Ladd ME. A receive chain add-on for implementation of a 32-channel integrated Tx/Rx body coil and use of local receive arrays at 7 Tesla. (2015) Proc. Intl. Soc. Mag. Reson. Med. 23: p. 3134.
[8] Setsompop K, Wald LL, Alagappan V, et al. Magnitude Least Squares Optimization for Parallel Radio Frequency Excitation Design Demonstrated at 7 Tesla With Eight Channels. (2008) MRM 59(4): 908-915.
[9] Orzada S, Maderwald S, Poser BA et al. RF excitation using time interleaved acquisition of modes (TIAMO) to address B1 inhomogeneity in high‐field MRI. (2010) MRM 64(2): 327-333.
Figures