3390
Contrast Preparation Pulses Robust to B1 and B0 Inhomogeneities: an Optimal Control Approach1CREATIS, Villeurbanne, France, 2Department of Chemistry, TUM, Munich, Germany, 3ICB, Dijon, France, 4TUM, Institute for Advanced Study, Munich, Germany
Synopsis
This abstract proposes an optimal control strategy for the computation of contrast preparation pulses robust to B1 (+/- 35%) and B0 (+/- 400Hz) inhomogeneities. The problem formulation allows to optimize the compromise between contrast performance and preparation time. An in vitro short-T2 enhancing contrast experiment validates the robustness superiority of the proposed preparation compared to a block pulse-based scheme, and shows a good match with simulations.
Introduction
Contrast preparation schemes create a significant signal difference on the longitudinal axis before running the excitation imaging sequence. For optimum image reliability, it is important to achieve uniform contrast despite B1 and B0 inhomogeneities, which especially occur at high magnetic fields. Existing methods typically use rectangular, composite, or adiabatic pulses, to perform robust T1[1] or robust T2[2,3] weighting. T1-weighted or T2-weighted based on saturation or inversion and echo time respectively limits the achievable contrast performance. Considering both relaxation times significantly complicates the design of preparation sequences, which is why optimal control has been proposed as an efficient pulse design strategy that fully controls the magnetization dynamics[4,5]. This abstract proposes an optimal control strategy for the computation of B1 and B0-robust contrast preparation pulses.
Methods
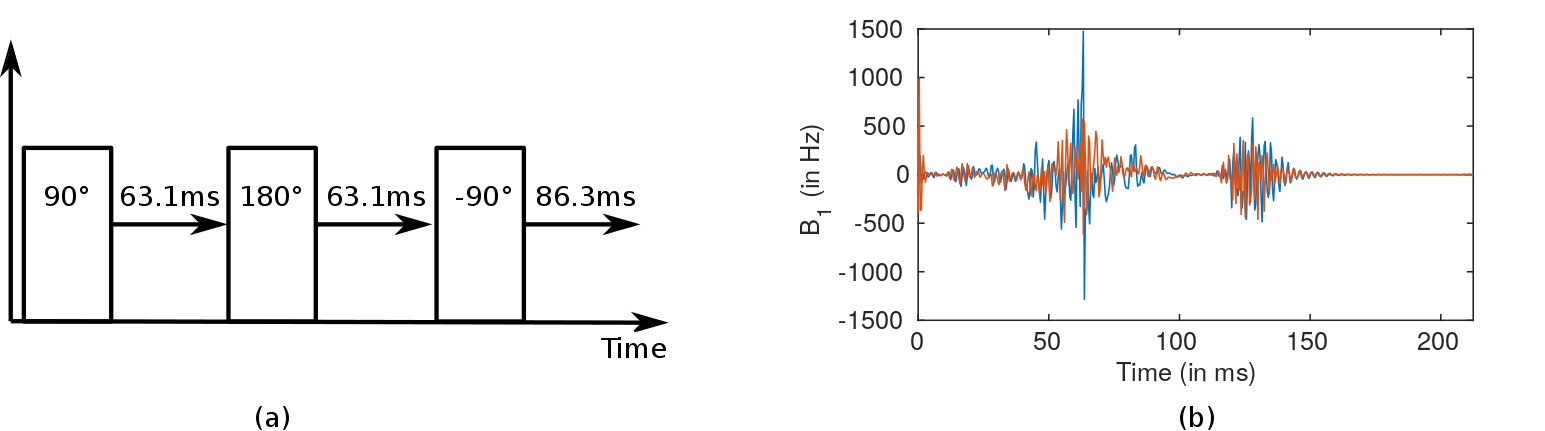
The optimal control pulse computation is performed with GRAPE[6], as a two-step procedure. In a first step, only a small number (N=3) of block pulses and delays are optimized, defined by their respective flip angle $$$\alpha^{(i)}$$$, phase $$$\theta^{(i)}$$$ and post-pulse delay $$$\tau^{(i)}$$$. Note that the duration of each block pulse is neglected with respect to the total preparation duration. This parameterization allows to incorporate the control time $$$(T = \sum \tau^{(i)})$$$ in the cost function, optimizing both contrast performance and preparation time:
$$C^{a>b} = \Vert \overrightarrow{M^b}(T) \Vert - \Vert \overrightarrow{M^a}(T) \Vert + \gamma \sum_{i<N}\tau^{(i)}$$
with $$$\overrightarrow{M^a}$$$ and $$$\overrightarrow{M^b}$$$ the macroscopic magnetization vectors of samples a and b, whose evolution is described by Bloch equations, and $$$\gamma$$$ a scalar that balances the influence of the control time penalization term. An example of such a sequence is illustrated in Figure 1a.
This sequence is subsequently converted into a finely-discretized complex pulse, where each time point becomes an optimization variable, and used as the initialization of the second optimization step. The objective is to make the initial time-efficient B0-robust sequence robust to B1-inhomogeneities by allowing additional degrees of freedom (Figure 1b). The cost function becomes:
$$ C^{a>b}_2 = \sum_i \Vert \overrightarrow{M_i^b}(T) \Vert - \Vert \overrightarrow{M_i^a}(T) \Vert $$
where the subscript i represents a specific B1-inhomogeneity value, taken inside a user-defined robustness interval. Note that a similar approach is used to handle B0-inhomogeneities – not detailed here for synthesis purpose.
The
B1-robustness of the optimized pulse is validated on a small-animal
4.7T Bruker MR system, by performing a non-trivial contrast
experiment that maximizes a short-T2 sample (90 ms), and minimizes a long-T2
sample (117 ms), both samples having similar T1 values (249 ms). The
pulse is optimized for +/-35% around the
theoretical B1 amplitude. The robustness is validated by measuring the
resulting contrast and intensity variations inside the targeted ROIs
for shifted amplitudes of the preparation scheme. Note that the amplitudes of the pulses used for excitation are not shifted, in order to analyze only the robustness of the preparation scheme.
Results
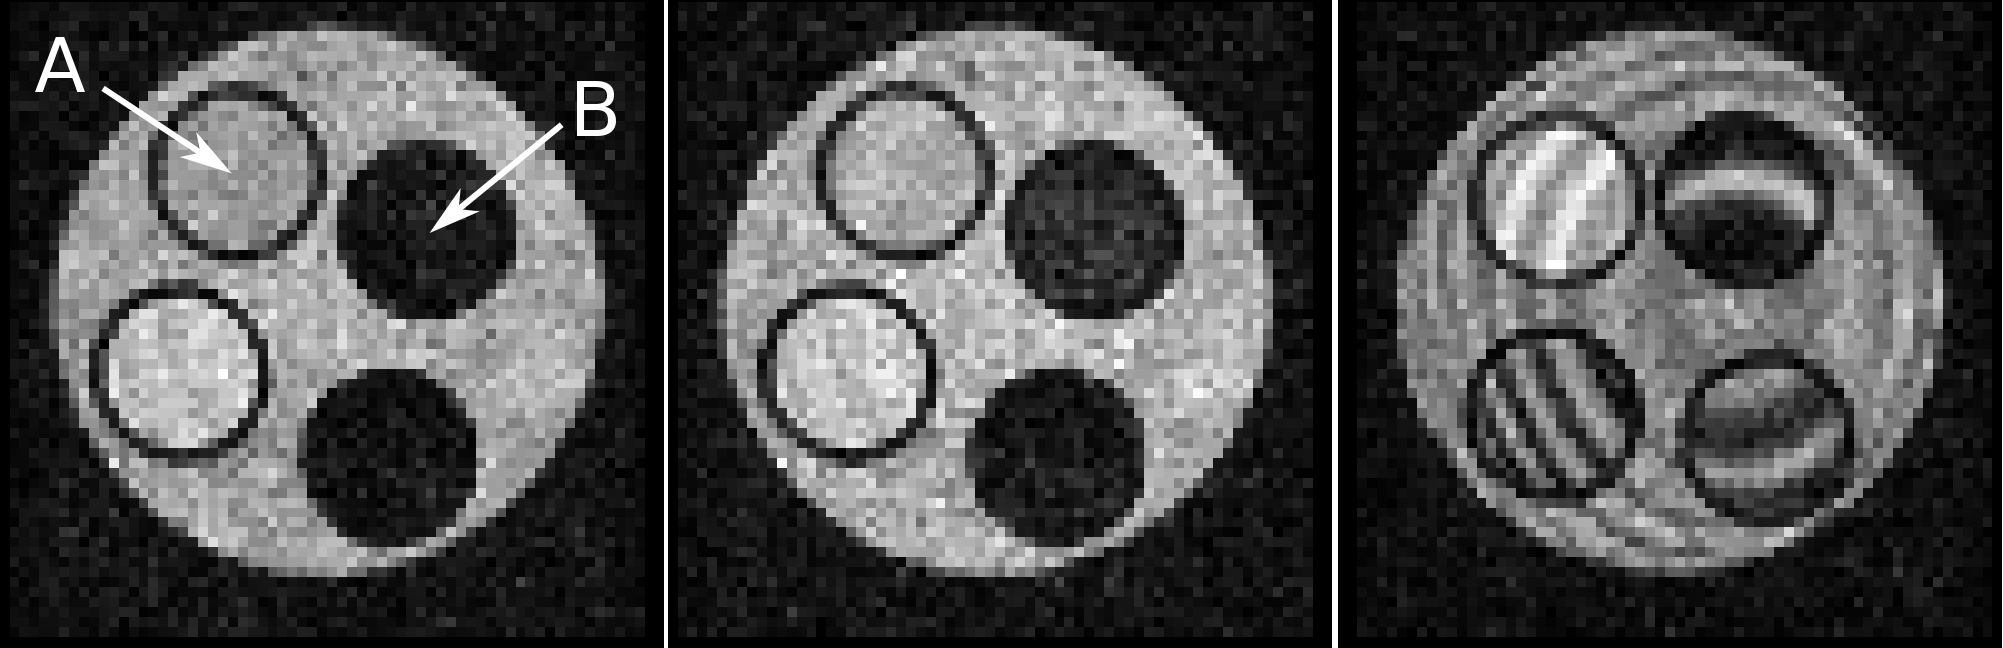
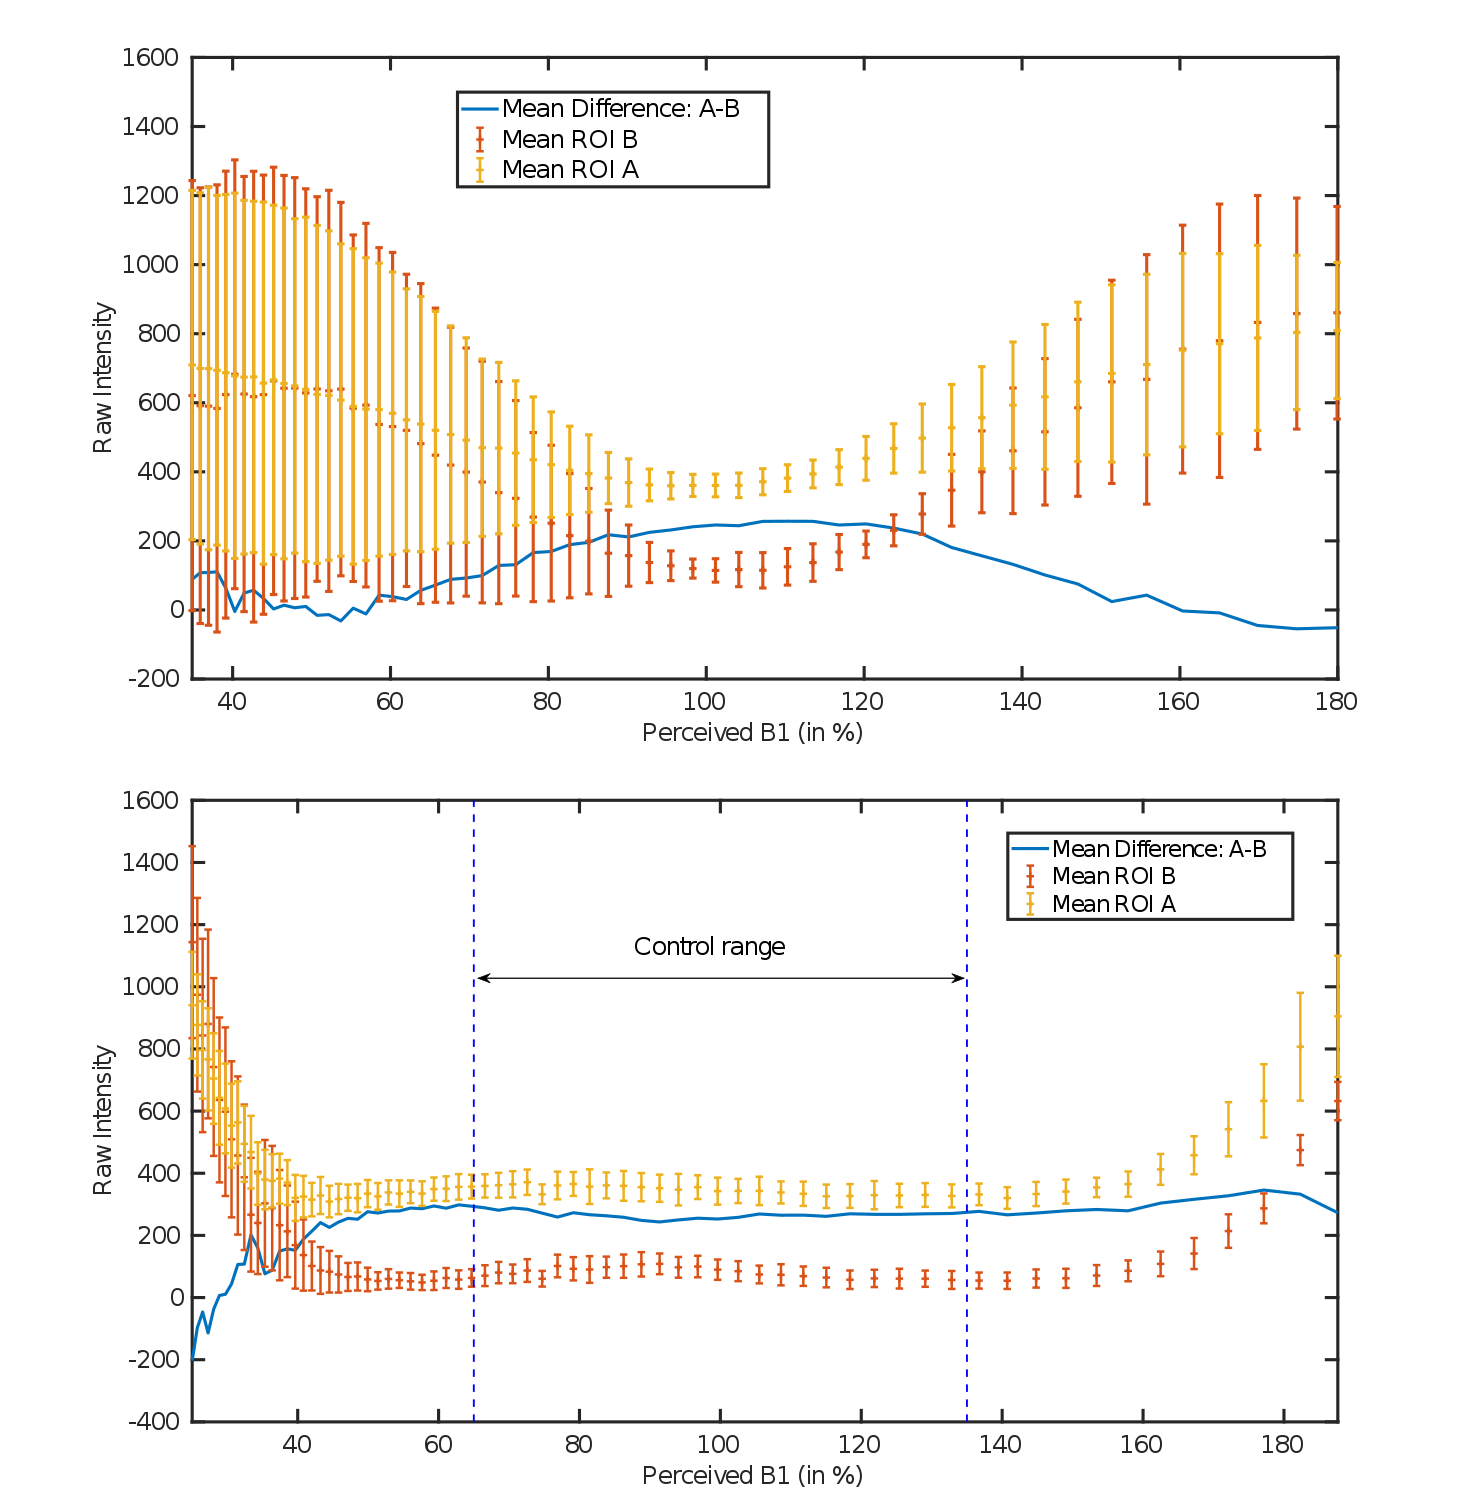
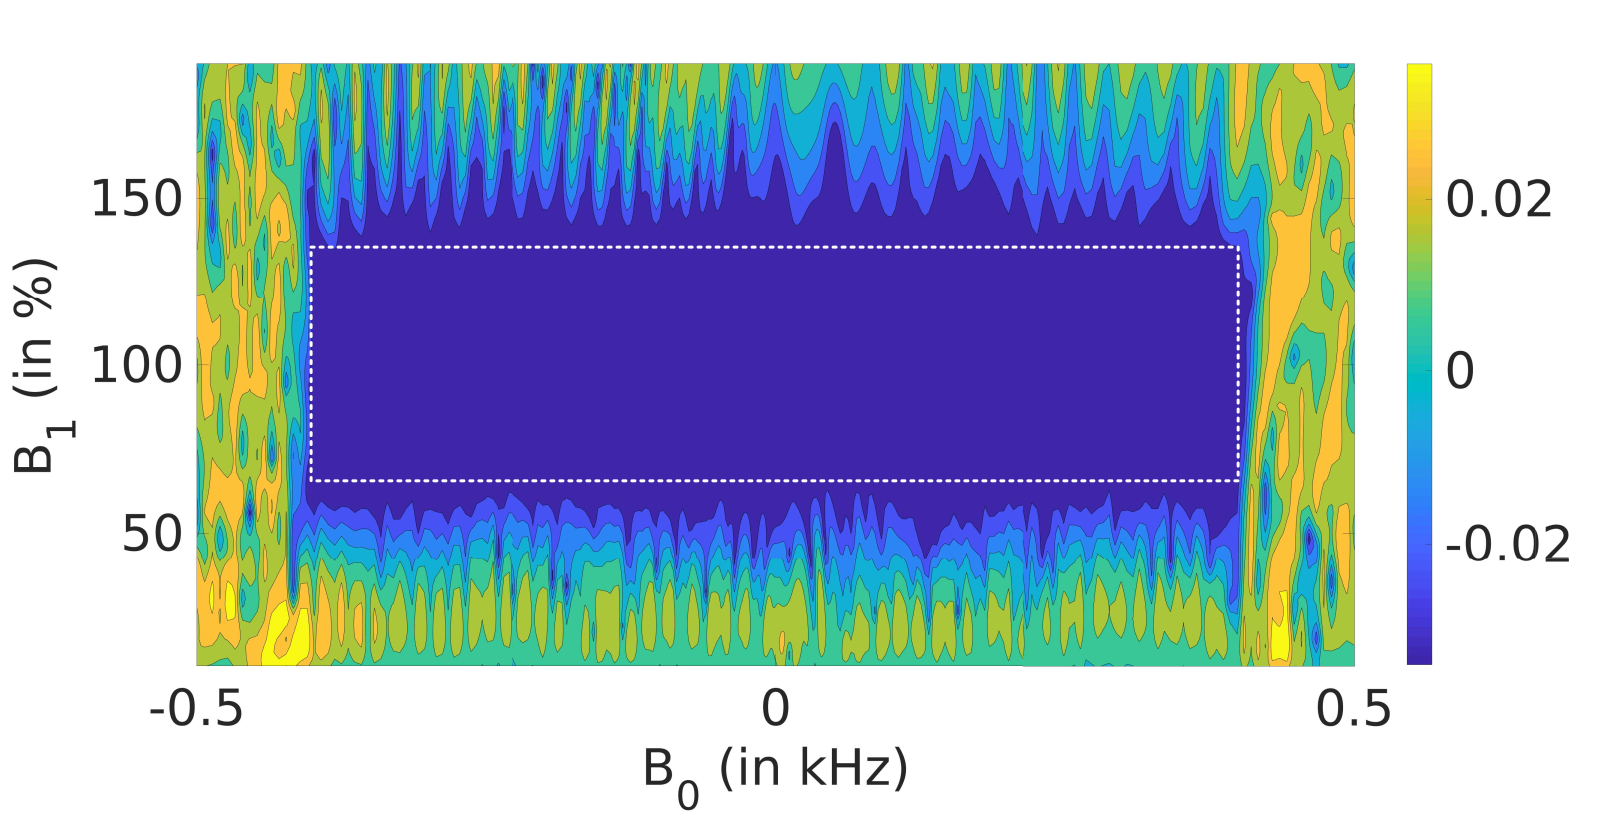
Figure 2 displays the acquired phantom images for various values of B1, with the block-pulse sequence of Figure 1a and the B1-robust sequence of Figure 1b. It clearly highlights the ability of the B1-robust pulse to preserve the short-T2 enhancing contrast for shifted B1 amplitudes. As could be expected, the image produced by the block-pulse scheme is highly deteriorated by a B1 amplitude shift. Figure 3 compares the contrast obtained on a wide range of B1 amplitudes for both preparation shemes. Note the good relative match with the simulated cost function map shown in Figure 4 as a function of B1 and B0-inhomogeneities. This figure illustrates that the cost – i.e. the resulting contrast – is almost constant within the control range (+/-400Hz for B0, and +/-35% for B1).Conclusion & Discussion
This abstract proposes an optimal control strategy for the computation of contrast preparation pulses robust to B1 (+/- 35%) and B0 (+/- 400Hz ~ +/-2ppm) inhomogeneities. The accurate control of the global magnetization dynamics allows to create of a non-trivial T2-enhancing contrast between two samples with similar T1 values. The computation of such pulses requires prior knowledge of the relaxation times of the targeted tissues, which can be previously quantified using T1/T2 mapping. Significant contrast performance and robustness improvements could be expected in cardiac imaging, such as coronary MR angiography[2], which suffers from B1 inhomogeneity effects at high magnetic fields. Future work will focus on considering SNR in the optimized cost function, for the optimization of contrast-to-noise ratio.Acknowledgements
This work is supported by the ANR-DFG research program Explosys (Grant No.ANR-14-CE35-0013-01; GL203/9-1), the Technische Universität München Institute for Advanced Study, the German Excellence Initiative, the E. U. Seventh Framework Program under Grant No. 291763, and the LABEX PRIMES (ANR-11-LABX-0063/ ANR-11-IDEX-0007). The authors would like to acknowledge support from the PILoT imaging platform, member of France Life Imaging network (grant ANR-11-INBS-0006).References
[1] J.V. Hajnal, B. De Coene, P.D. Lewis, C.J. Baudouin, F.M. Cowan, J.M. Pennock, I.R.Young, and G.M. Bydder. High signal regions in normal white matter shown by heavily T2-weighted CSF nulled IR sequences. Journal of computer assisted tomography, 16(4):506–513, 1992
[2] R. Nezafat, M. Stuber, R. Ouwerkerk, A.M. Gharib, M.Y. Desai, and R.I. Pettigrew. B1-Insensitive T2 Preparation for Improved Coronary Magnetic Resonance Angiography at 3 T. Magnetic Resonance in Medicine, 55, 858-864, 2006
[3] E.R. Jenista, W.G. Rehwald, E.L. Chen, H.W. Kim, I. Klem, M.A. Parker, and R.J. Kim. Motion and flow insensitive adiabatic T2-preparation module for cardiac MR imaging at 3 Tesla. Magnetic Resonance in Medicine, 70, 1360-1368, 2013
[4] E. Van Reeth, H. Ratiney, M. Tesch, D. Grenier, O. Beuf, S.J. Glaser, and D. Sugny. Optimal control design of preparation pulses for contrast optimization in MRI. Journal of Magnetic Resonance, 279:39-50, 2017
[5] M. Lapert, Y. Zhang, M. Janich, S.J. Glaser and D. Sugny. Exploring the physical limits of saturation contrast in Magnetic Resonance Imaging. Sci. Rep. 2, 589, 2012
[6] N. Khaneja, T. Reiss, C. Kehlet, T. Schulte-Herbrüggen, and S.J. Glaser. Optimal control of coupled spin dynamics: design of NMR pulse sequences by gradient ascent algorithms. Journal of Magnetic Resonance, 172(2):296-305, 2005
Figures