3381
High efficient reconstruction of overlapping-echo detachment (OLED) planar imaging based on deep residual network1Xiamen University, Xiamen, China, 2Xiamen University, xiamen, China, 3University of Rochester, Rochester, NY, United States
Synopsis
Overlapping-echo detachment (OLED) planar imaging sequence can provide reliable T2 mapping within milliseconds even under continuous object motion. A detachment algorithm based on the sparsity and structure similarity constraints has been used to separate the echo signals to form T2 map. However, the effectiveness of separation is limited and the reconstruction is time consuming. Here, an end-to-end deep convolutional network based on deep residual network was introduced. The results of simulation and in vivo human brain show that it can reconstruct T2 mapping efficiently and reduce the reconstruction time from minutes to milliseconds after deep residual network is trained.
Purpose
MR parameter mapping can provide quantitative information for characterizing specific tissue properties [1], which has found important clinical applications. Especially, quantitative evaluation of T2 relaxation time has attracted more and more attention recently [2]. However, the long data acquisition time and high sensitivity to subject motion [3] hinder its practical application. To accelerate the acquisition of T2 mapping, a pulse sequence named Overlapping-echo detachment (OLED) planar imaging has been proposed to achieve single-shot T2 mapping [4]. A traditional regularization-based reconstruction method based on the sparsity constraint and structure similarity constraint has been utilized to separate the overlapped echoes and calculate the corresponding T2 mapping. However, due to the highly non-linear mapping process of OLED imaging, the efficiency of reconstruction based on priori constraints is limited and the reconstruction is rather slow (in minutes), which will hinder its applications in real-time imaging. Deep learning (DL), a family of algorithms for efficient learning of complicated dependencies between input data and outputs by propagating a training dataset through several layers of hidden units, has shown explosive popularity in recent years with the availability of powerful GPUs [5]. In the present work, an end-to-end deep convolutional network based on deep residual network (ResNet) [5] was demonstrated to be able to provide better reconstructed T2 mapping with much faster reconstruction speed.Methods
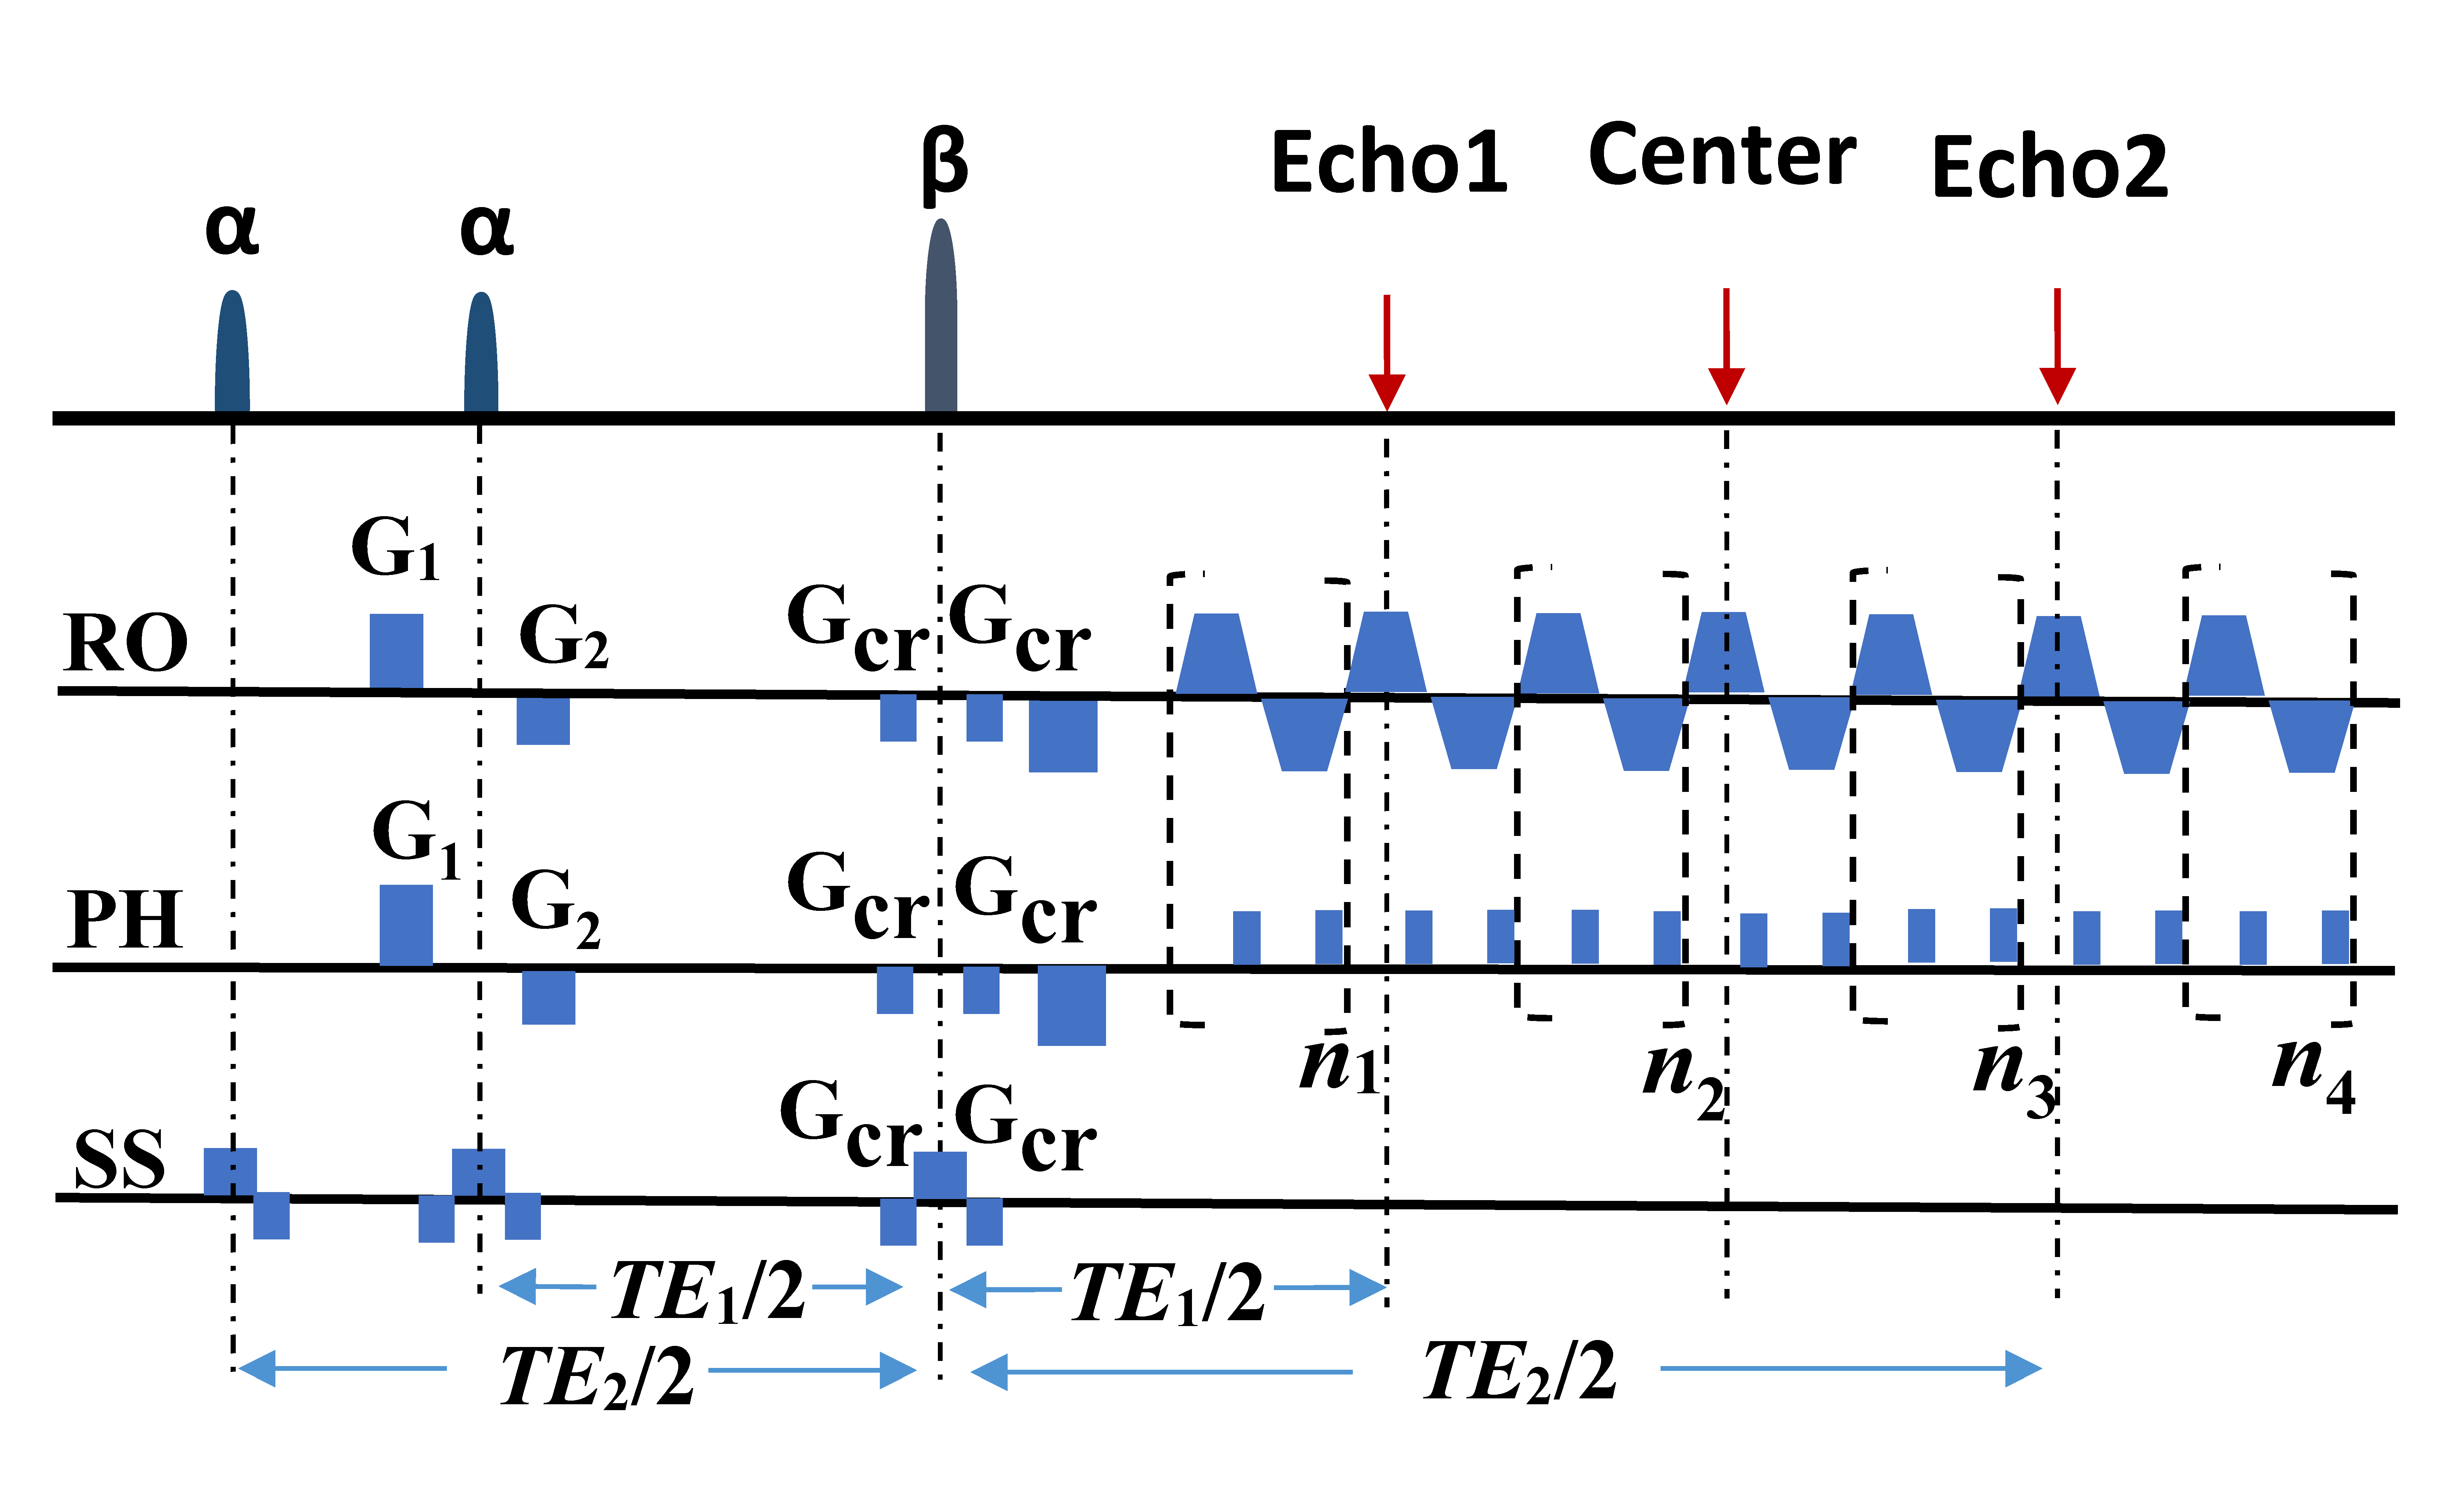
The OLED sequence is shown in Fig. 1. Three echo signals with different T2 weighting are obtained in the same k-space within a single shot:
\begin{cases}S_{1}(TE_{1})=\frac{1}{2}\int_{\overrightarrow{r}}\rho(\overrightarrow{r})|\sin\alpha\cos\alpha|(1-\cos\beta)e^{-TE_{1}/T_{2}(\overrightarrow{r})}d\overrightarrow{r} \ \ \ \ \ \ \ \ \ \ ,first -spin- echo \\S_{2}(TE_{2})=\frac{1}{4}\int_{\overrightarrow{r}}\rho(\overrightarrow{r})|\sin\alpha|(1+\cos\alpha)(1-\cos\beta)e^{-TE_{2}/T_{2}(\overrightarrow{r})}d\overrightarrow{r} \ , second- spin- echo\\S_{3}(TE_{1})=\frac{1}{4}\int_{\overrightarrow{r}}\rho(\overrightarrow{r})|\sin\alpha|(1-\cos\alpha)(1-\cos\beta)e^{-TE_{1}/T_{2}(\overrightarrow{r})}d\overrightarrow{r} \ , double-spin-echo\end{cases}
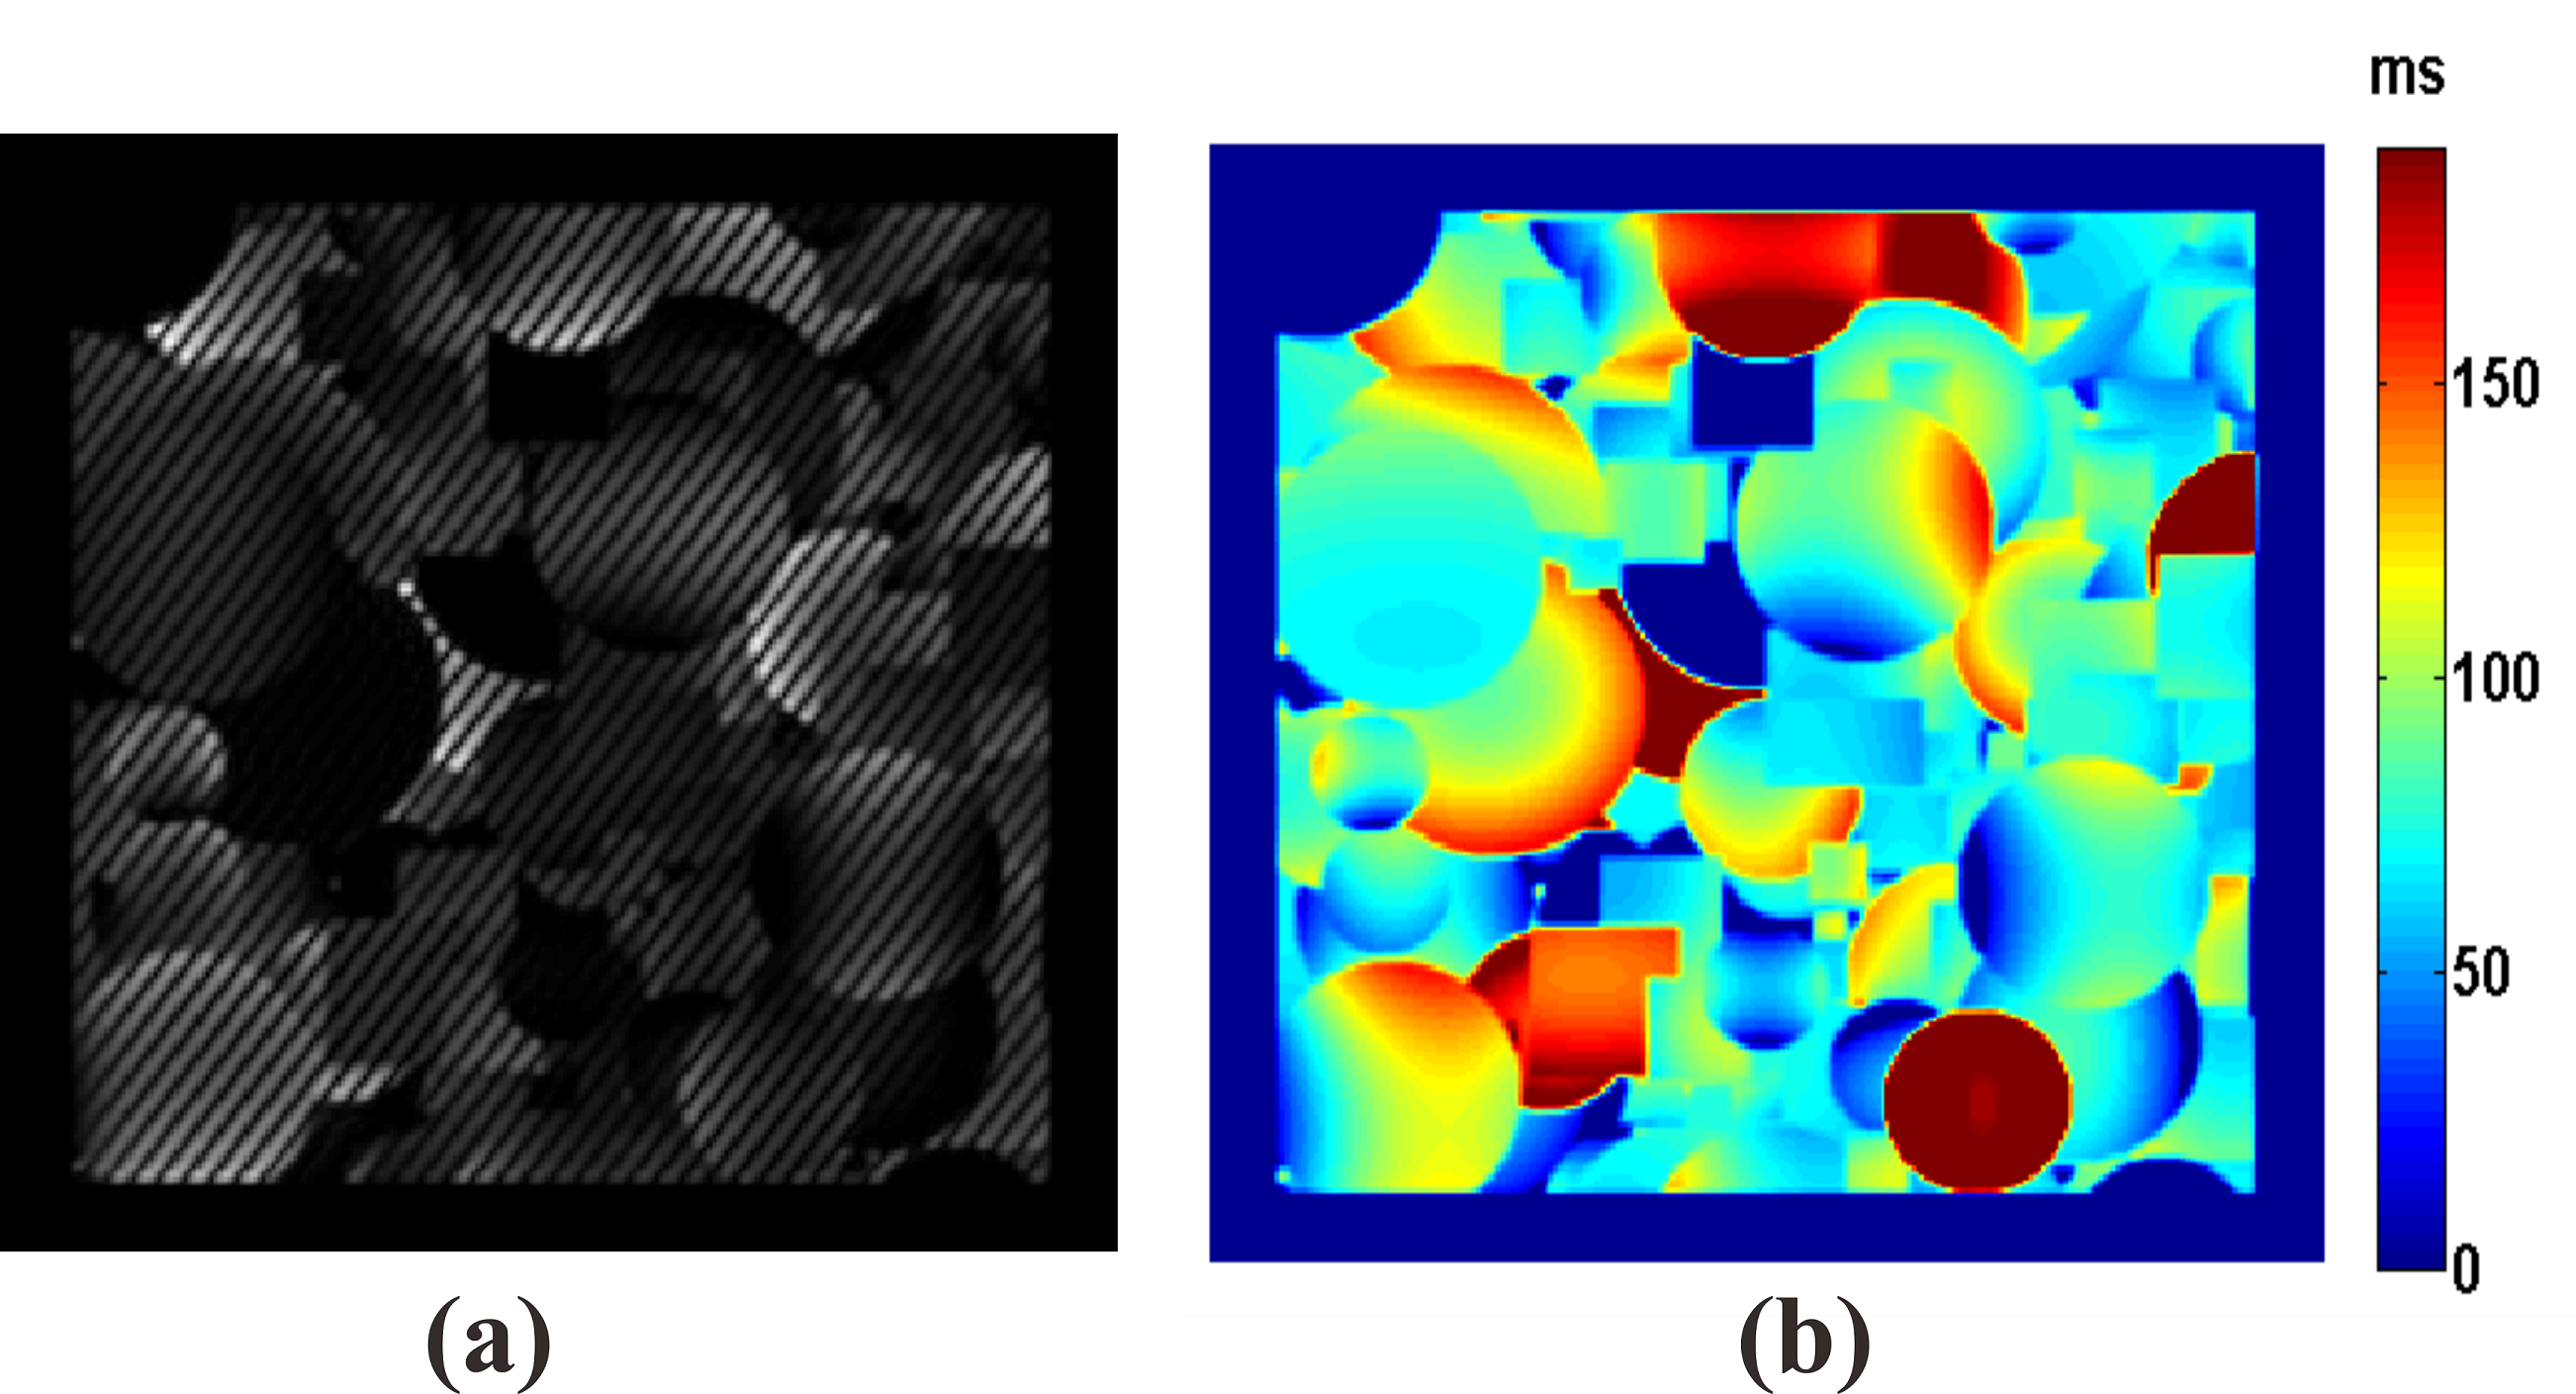
The details of the traditional reconstruction method can be found in our previous report [4]. For deep learning, a residual network with 14 parameter layers was used. In the network, all pooling operations were removed to preserve spatial information. Stochastic gradient descent (SGD) was used with the weight decay of 10-10, momentum of 0.9 and mini-batch size of 16. We started with a learning rate of 0.1, divided it by 10 at 3×10⁴ and 6×10⁴ iterations, and terminated training at 105 iterations. The filter size was 3×3, and the filter number was 64. No augmentation was used. The batch normalization (BN) was adopted right after each convolution and before activation. The output size was 64×64. The training dataset was obtained from the simulation of OLED sequence using the SPROM software developed by our group. Fig. 2(a) shows the input image and Fig. 2(b) shows the corresponding label image. In the simulations possible non-ideal experimental conditions were considered fully, and guided image filtering applied [6]. The training dataset included 100 images, and a 64×64 crop was randomly sampled from an image (256×256). The human brain experiments were performed on a whole-body 3T MRI system (MAGNETIOM Trio TIM, Siemens Healthcare, Erlangen, Germany).
Results
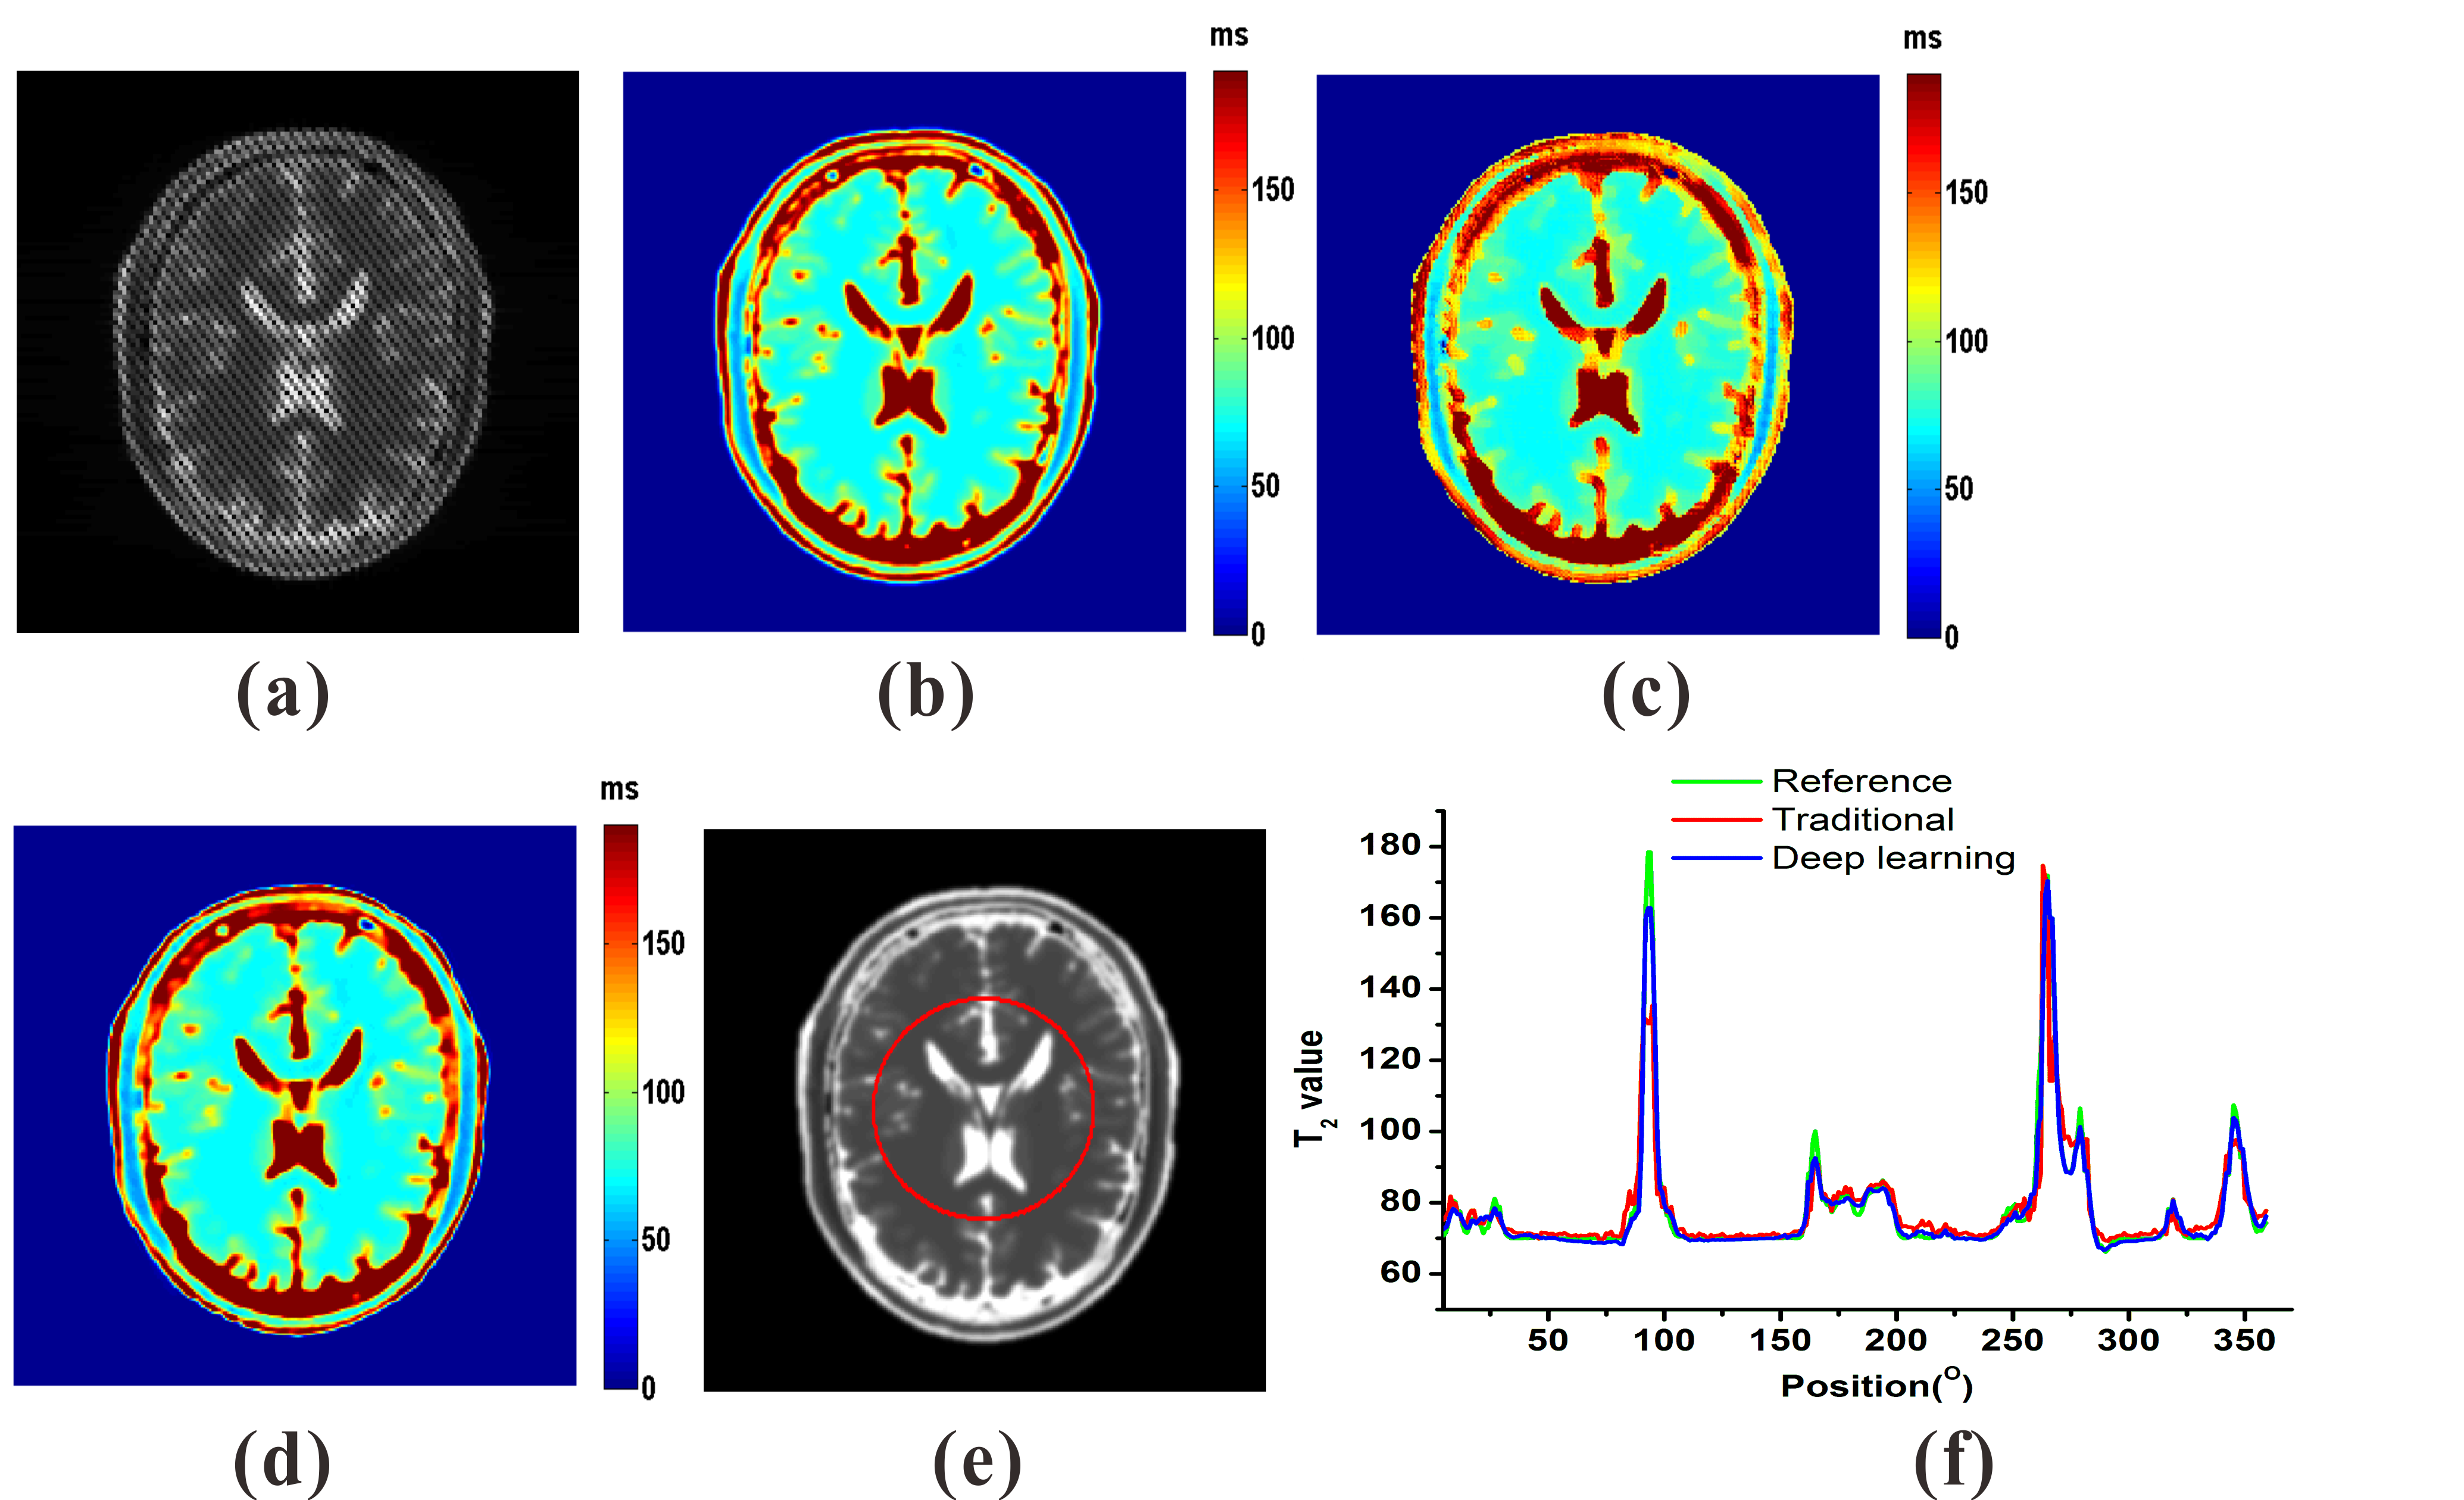
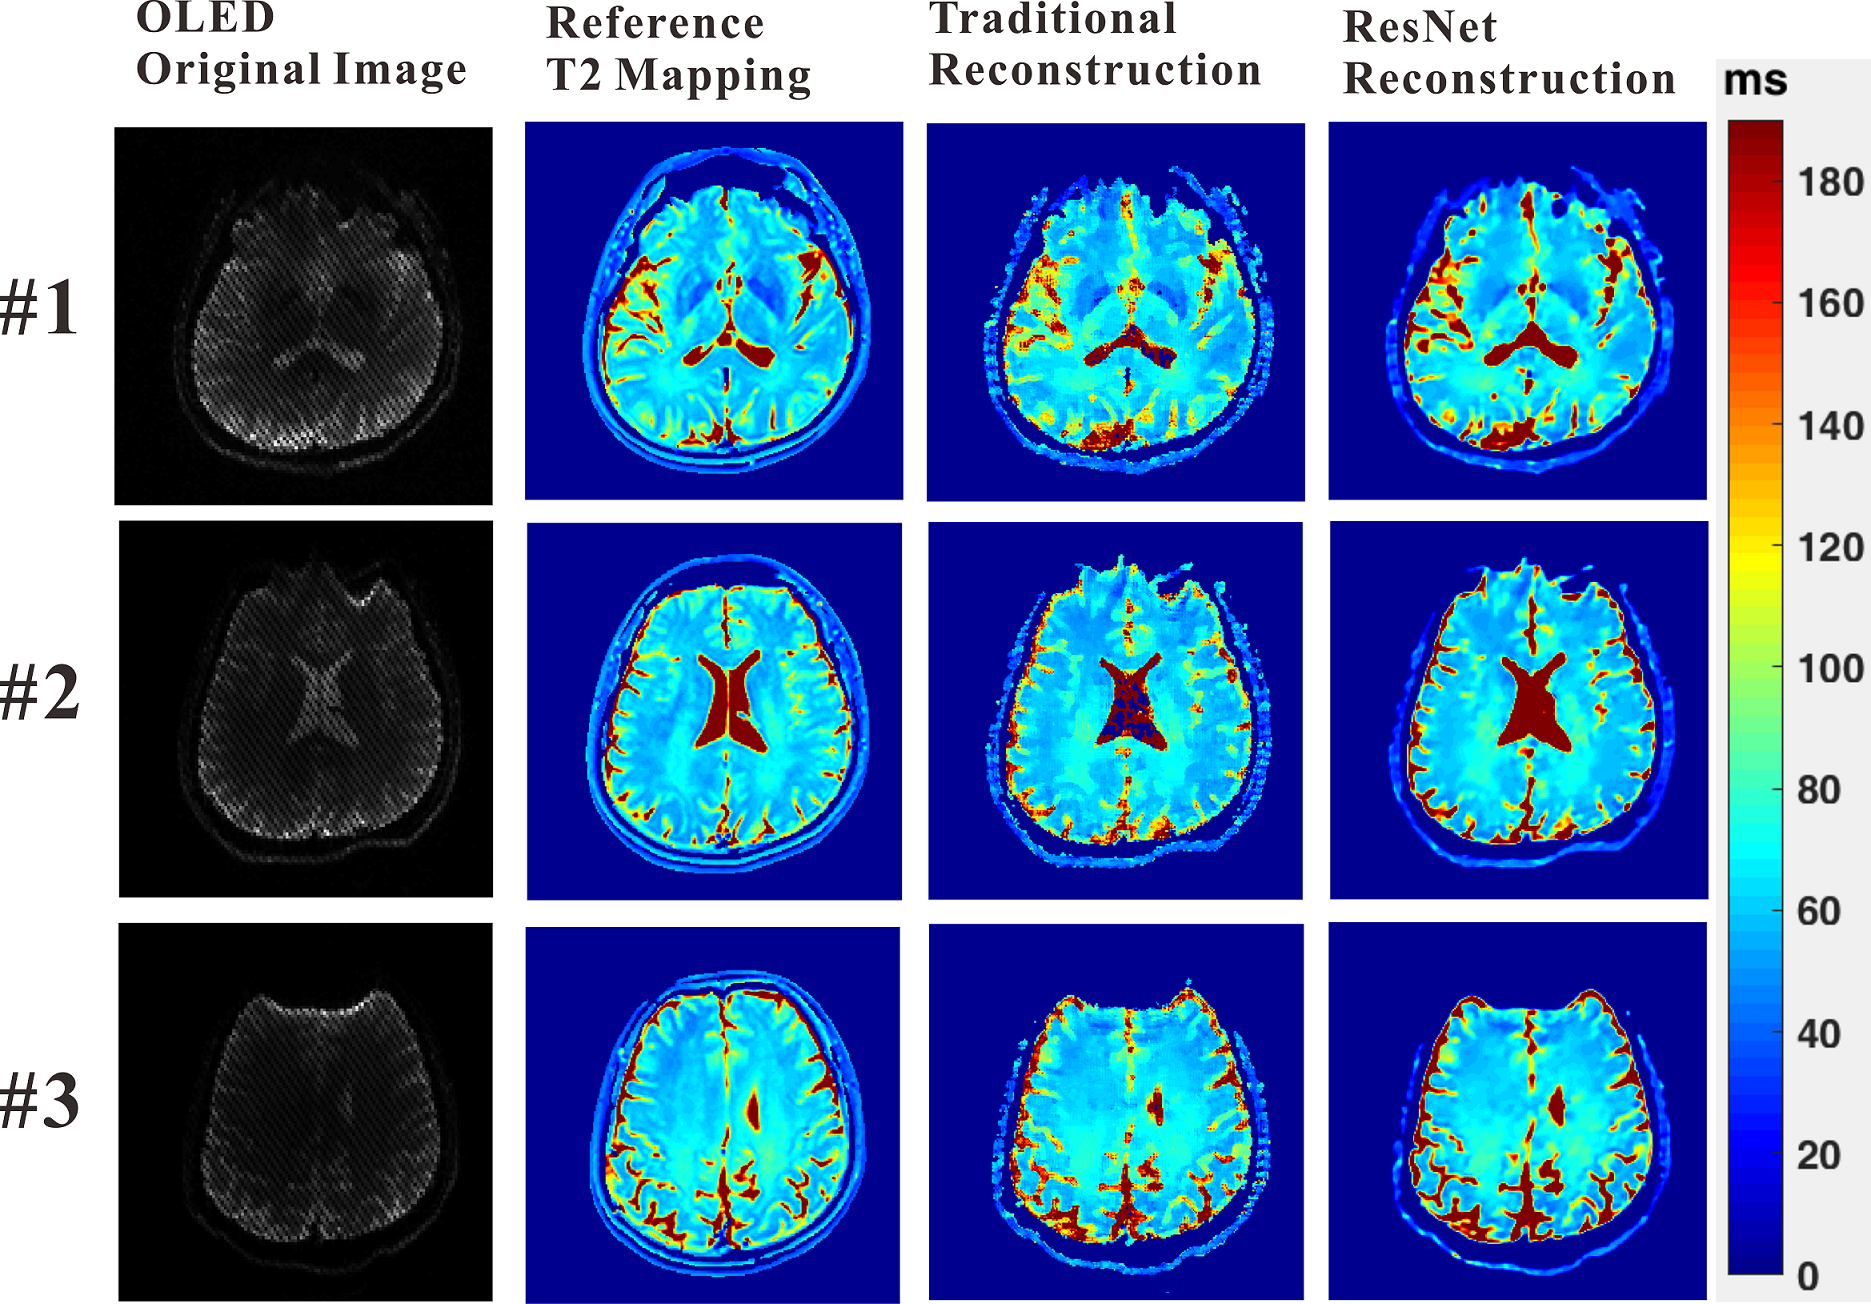
Numerical simulation and in vivo human brain experiments were performed to evaluate the DL method. For the reconstructions of numerical simulation and in vivo human brain experiments, the traditional method takes about 2 minutes on a desktop computer, while the DL method takes less than 1 second after the ResNet was trained. The results of numerical simulation are shown in Fig. 3. Fig. 3(c) and (d) show that both the traditional method and DL method can provide exact T2 mapping. However, the DL method provides better resolution than the traditional method. From Fig. 3(f), we can see that the DL method has better performance than the traditional method, especially in the region with relatively large T2 values. Fig. 4 illustrates the results of three different slices from in vivo human brain. Compared to the traditional method, we can see that the DL method can provide results with lower noises, higher resolution and more robustness.Discussion
In the simulation and in vivo experiments, the DL method shows excellent performance in reconstructing T2 mapping from the single-shot OLED images. The reconstruction time is also reduced to milliseconds, down from minutes in traditional methods, which is very important for real-time imaging. Although we train the network on simulated data, the learned network generalizes well to real brain data.Conclusion
This study shows that deep learning method can improve the clinical value of OLED in single-shot T2 mapping with better quality and faster reconstruction speed. On the other hand, it also implies that the reconstruction of images from complex MRI sequence would be easier under the benefits of deep learning.Acknowledgements
This work was supported in part by the NNSF of China underGrants 81171331, 81671674, 11474236.References
[1] Zhao B, Lam F, Liang Z. Model-based MR parameter mapping with sparsity constraints: parameter estimation and performance bounds. IEEE Trans. Med. Imaging, 2014; 33: 1832-1844. [2] Sumpf T, Petrovic A, Uecker M, et al. Fast T2 mapping with improved accuracy using undersampled spin-echo MRI and model-based reconstructions with a generating function. IEEE Trans. Med. Imaging, 2014; 33: 2213-2222. [3] Bihan DL, Poupon C, Amadon A, et al. Artifacts and pitfalls in diffusion MRI. J. Magn. Reson. Imaging, 2006; 24: 478-488. [4] Cai CB, Zeng YQ, Zhuang YC, et al. Single-shot T2 mapping through OverLapping-Echo Detachment (OLED) Planar Imaging. IEEE Trans. Biomed. Eng., 2017; 64: 2450-2461. [5] He KM, Zhang XY, Ren SQ, et al. Deep residual learning for image recognition. CVPR, 2016: 770-778. He KM, Sun J, Tang XO. Guided image filtering. IEEE Trans. Pattern Anal. Mach. Intell., 2013; 35: 1397-1409.Figures