3380
Quantification of relaxation times in MR Fingerprinting using deep learning1University of North Carolina at Chapel Hill, Chapel Hill, NC, United States
Synopsis
MRF is a new quantitative MR imaging technique, which can provide rapid and simultaneous measurement of multiple tissue properties. Compared to the fast speed for data acquisition, the post-processing to extract tissue properties with MRF is relatively slow and often requires a large memory for the storage of both image dataset and MRF dictionary. In this study, a convolutional neural network was developed, which can provide rapid estimation of multiple tissue properties in 0.1 sec. The T1 and T2 values obtained in white matter and gray matter are also in a good agreement with the results from pattern matching.
Target Audience
This work targets those interested in deep learning and MR Fingerprinting (MRF).Purpose
MRF is a new quantitative MR imaging technique for rapid and simultaneous assessment of multiple tissue properties (1). Unlike conventional approaches, MRF uses pseudo-randomized acquisition parameters to first create unique signal signatures for different tissue types. Then signals are matched to a pre-calculated dictionary to simultaneously extract multiple tissue properties using pattern matching. While the image acquisition for MRF is highly efficient with fast spiral readout and a high reduction factor, the post-processing is relatively slow and often requires a large memory for the storage of both image dataset and MRF dictionary. Recently, several studies have proposed to use deep learning for MRF post-processing (2,3). While the findings are promising, most of the studies have focused on fully sampled dataset or phantom measurement. Its performance with highly undersampled MRF data from in vivo measurement remains unknown. The purpose of this study was to develop a deep learning method to extract tissue properties from highly undersampled MRF data in brain imaging.Methods
The MRI experiments were performed on a Siemens 3T Prisma scanner using a 32-channel head coil. Highly undersampled 2D MRF dataset were acquired using FISP readout. For each measurement, about 2300 time points were acquired and each time point consists of data from only one spiral readout (reduction factor, 48). Other imaging parameters included: FOV, 30 cm; matrix size, 256x256; slice thickness, 5 mm; flip angle, 5°~12°. Overall, 20 dataset were acquired and the quantitative T1 and T2 maps obtained using pattern matching algorithm were used as the reference.
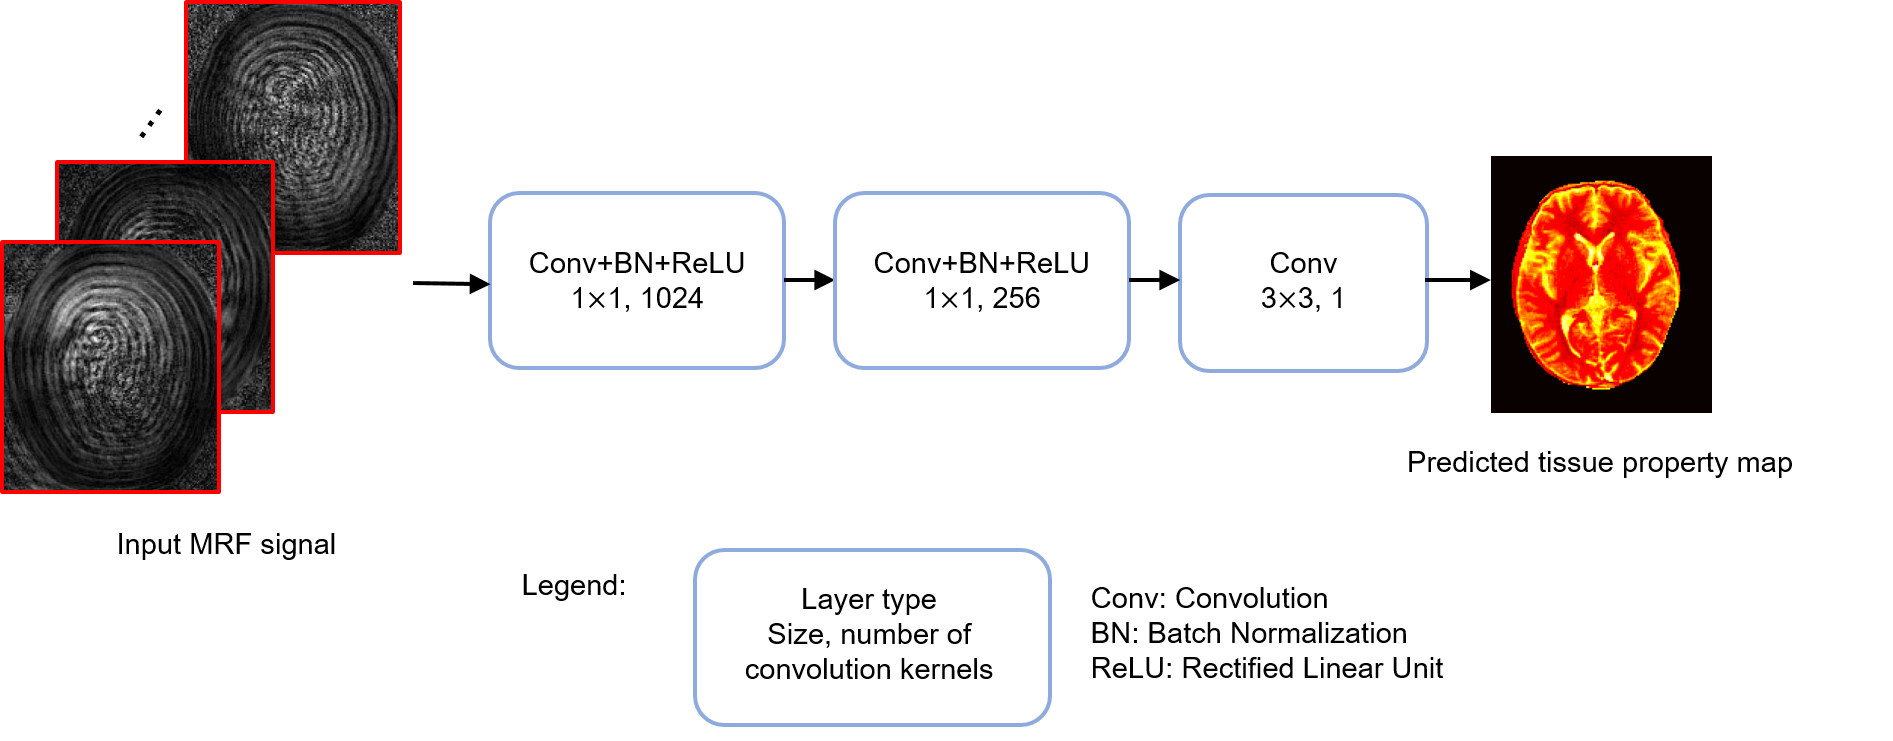
The structure of the convolutional neural network (CNN) (4) developed in this study is shown in Fig. 1. Highly undersampled image series acquired with MRF were used as input and the corresponding tissue property (T1 or T2) maps were used as outputs. The real and imaginary parts of complex signal were separated into two channels. Three convolutional layers were designed following the input layer. The kernel sizes are 1x1, 1x1 and 3x3, and the numbers of kernels are 1024, 256 and 1, respectively. The first two layers use batch normalization and ReLU activation. The third convolutional layer outputs the tissue property map. Overall, nine image dataset were used for training and 11 dataset were used for validation. To utilize correlated information between neighboring pixels, MRF signal from a patch of 32x32 pixels, instead of a single pixel, was used as an input for the training. Overall, 147,420 patches were generated from nine dataset in the study. The network was trained by minimizing the mean square difference between its output and the map retrieved from pattern matching. Larger weights were assigned for lower T1 and T2 values to achieve better training performance for white matter and gray matter in brain tissues. Each training took about three hours using a graphic processing unit (GPU) card, while the time to extract T1/T2 values from one 2D measurement was only 0.1 sec. We also evaluated the effect of the number of time points used in deep learning and the results were compared to those obtained using all 2300 time points with the pattern matching approach.
Results
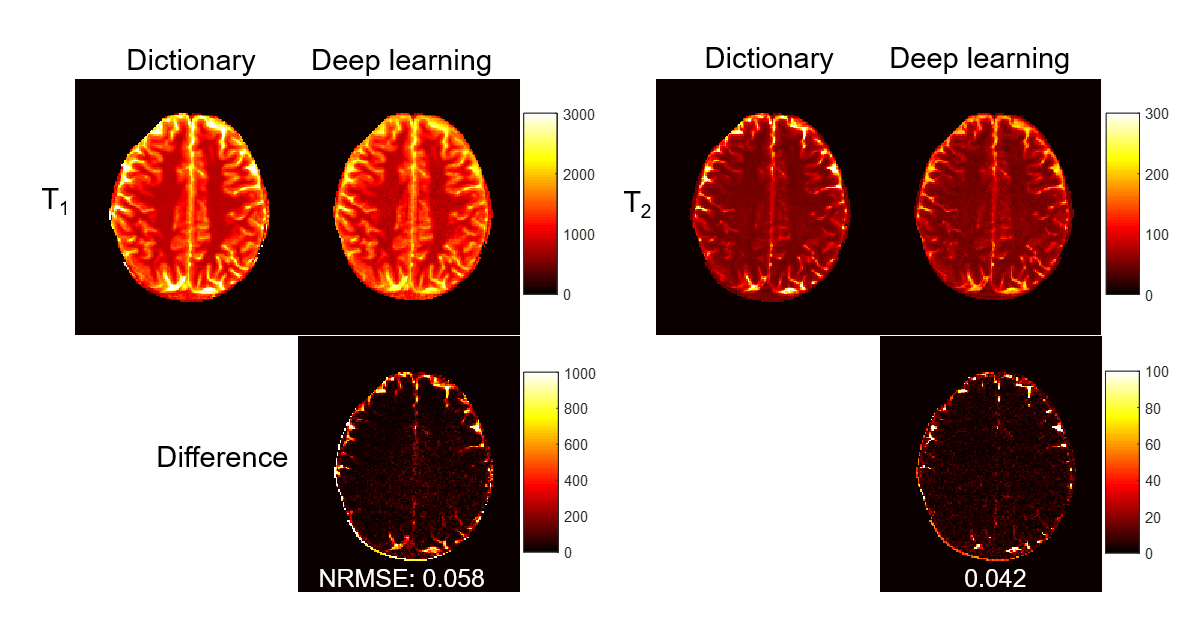
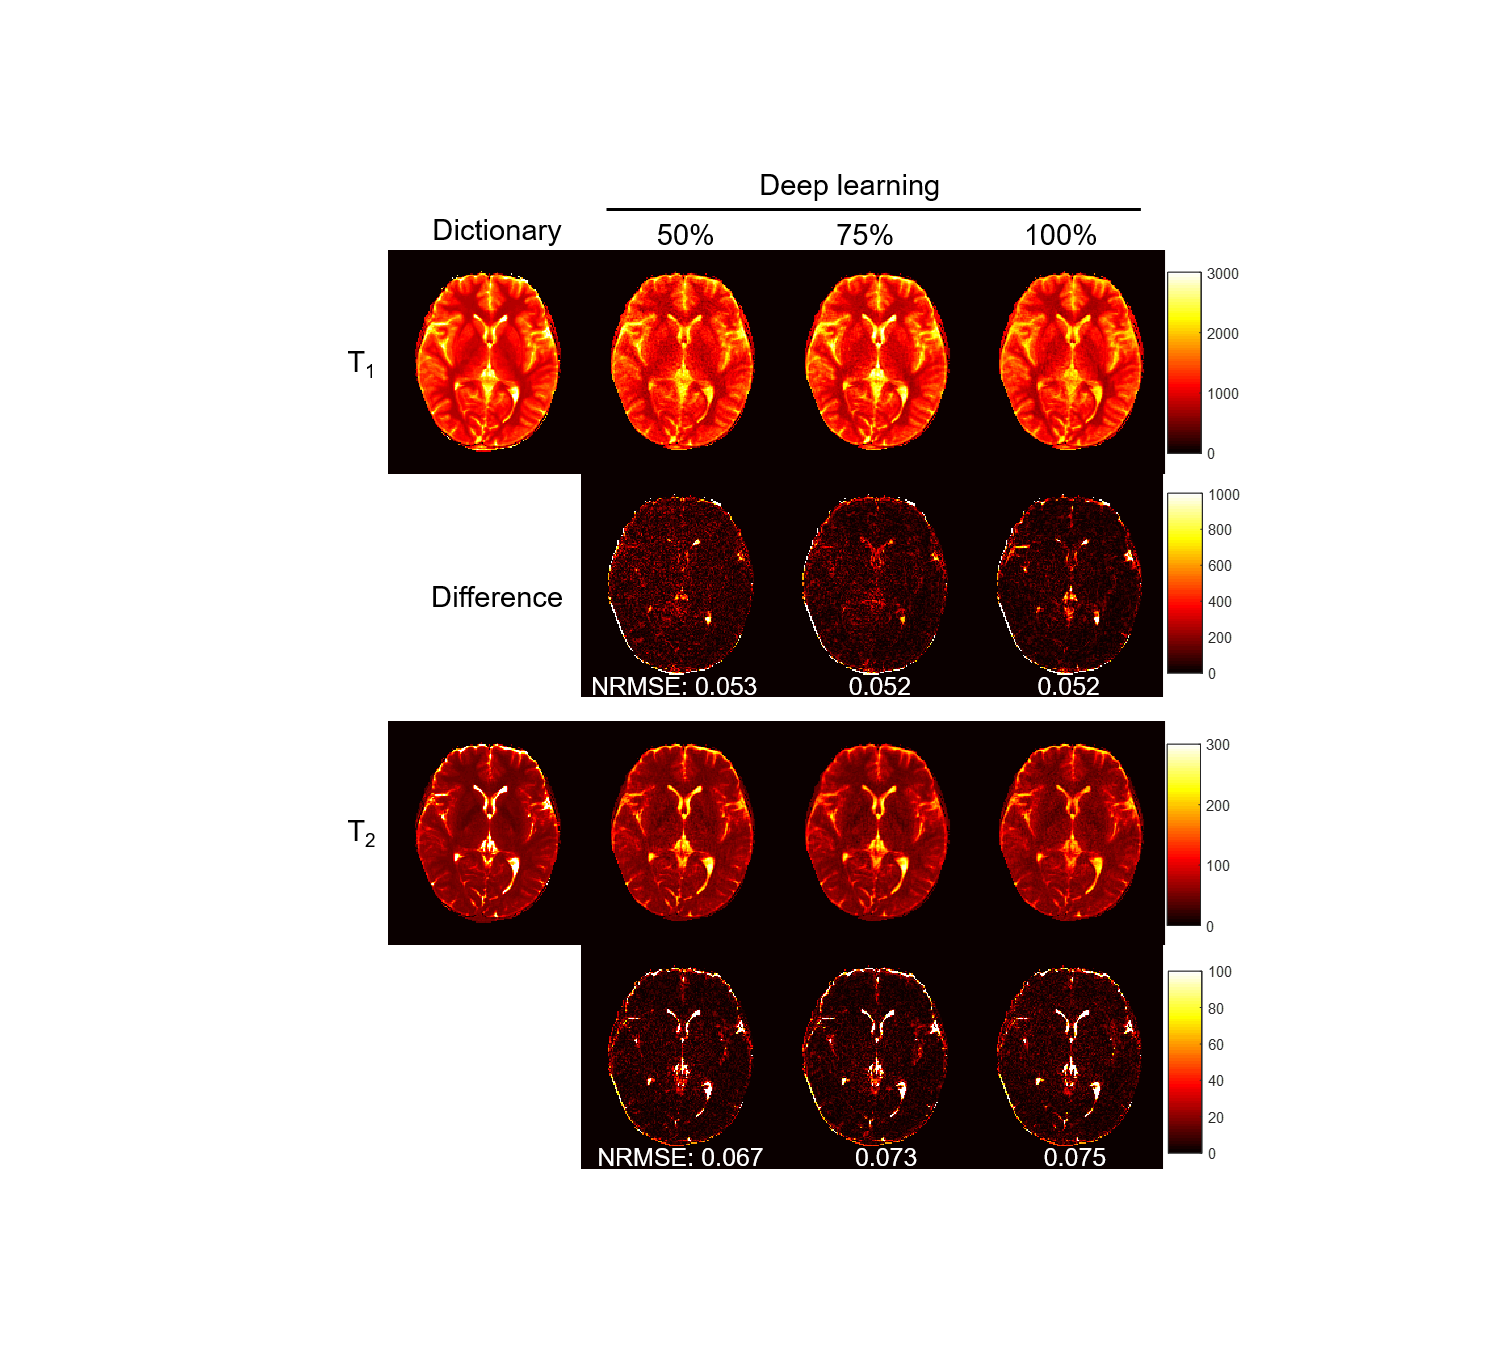
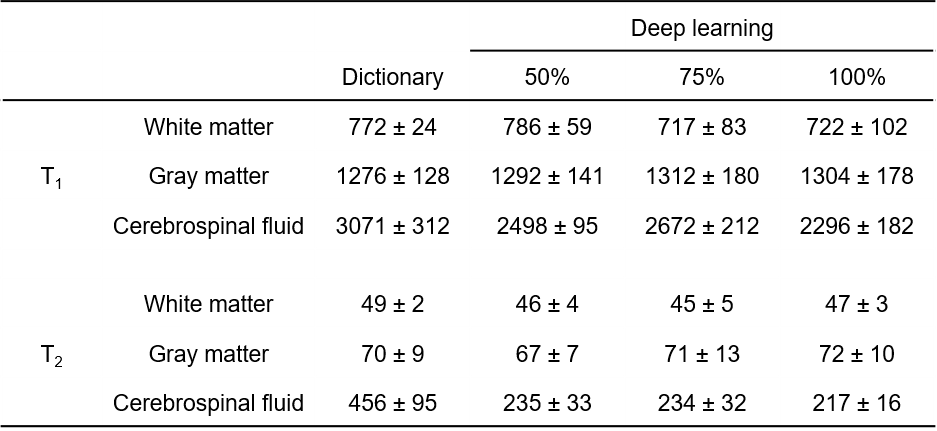
Fig. 2 shows representative results obtained using all 2300 time points. The effect of the number of time points used in the deep learning method is presented in Fig. 3. A ROI analysis was performed and the T1 and T2 values from white matter (WM), gray matter (GM) and cerebrospinal fluid (CSF) are summarized in Table 1. Compared to the results obtained with pattern matching, a good match in both T1 and T2 was observed in WM and GM with the deep learning method. Substantial differences exist in CSF between the two processing methods, which is likely due to the setting of different weights in the network. No clear difference was noticed in the results obtained with different time points, which suggests that deep learning can potentially extract tissue properties with reduced data.Discussion and Conclusion
In this proof-of-concept study, a convolutional neural network was developed for efficient extraction of multiple tissue properties from highly undersampled MRF data. Our results show that a good agreement in T1 and T2 quantification was achieved in both WM and GM as compared to the standard approach. Future work will focus on increasing the complexity of the network and size of training dataset to improve accuracy especially with CSF and eliminate the noise appearance in the quantitative maps.Acknowledgements
No acknowledgement found.References
1. Dan M, et al. Nature, 2013; 187–192. 2. Cohen O, et al., Int. Soc. Magn. Reson. Med. 2017;688. 3. Hoppe E, et al., Stud Health Technol Inform, 2017;243:202-206. 4. Bahrami K, et al., Deep Learning in Medical Image Analysis 2016;39-47.Figures