3371
A Learning-based Metal Artifacts Correction Method using Dual-Polarity Readout Gradients1KAIST, Daejeon, Republic of Korea
Synopsis
Metallic implants induce large field perturbations, which generate various types of artifacts according to the spatial encoding mechanisms in MRI. Especially, a frequency encoding dimension is influenced by bulk displacements with off-resonance frequencies and the pixel sizes are distorted in the frequency encoding dimension. In the abstract, a new learning-based method is proposed to map two metal-induced-artifacts images with positive and negative-polarity readout gradients into a metal-induced-artifacts-free image. Simulated data was utilized for training the network instead of real MR data that requires many resources to be collected.
Introduction
Metallic implants induce large field perturbations, which generate various types of artifacts according to the spatial encoding mechanisms in MRI. Especially, a frequency encoding dimension is influenced by bulk displacements with off-resonance frequencies and the pixel sizes are distorted in the frequency encoding dimension. Three-dimensional multispectral imaging methods significantly reduce bulk displacements to below single-pixel level, but they cannot handle distortions such as pile-up artifacts and signal loss which are induced by severe field perturbations within a pixel.1,2 Meanwhile, fully phase-encoded methods only utilize phase encoding processes without readout gradients, which can obtain metal-induced-artifacts-free images.3 But, they require very long imaging time. In the abstract, a new learning-based method is proposed to map two metal-induced-artifacts images with positive and negative-polarity readout gradients into a metal-induced-artifacts-free image. Simulated data was utilized for training the network instead of real MR data that requires many resources to be collected.Methods
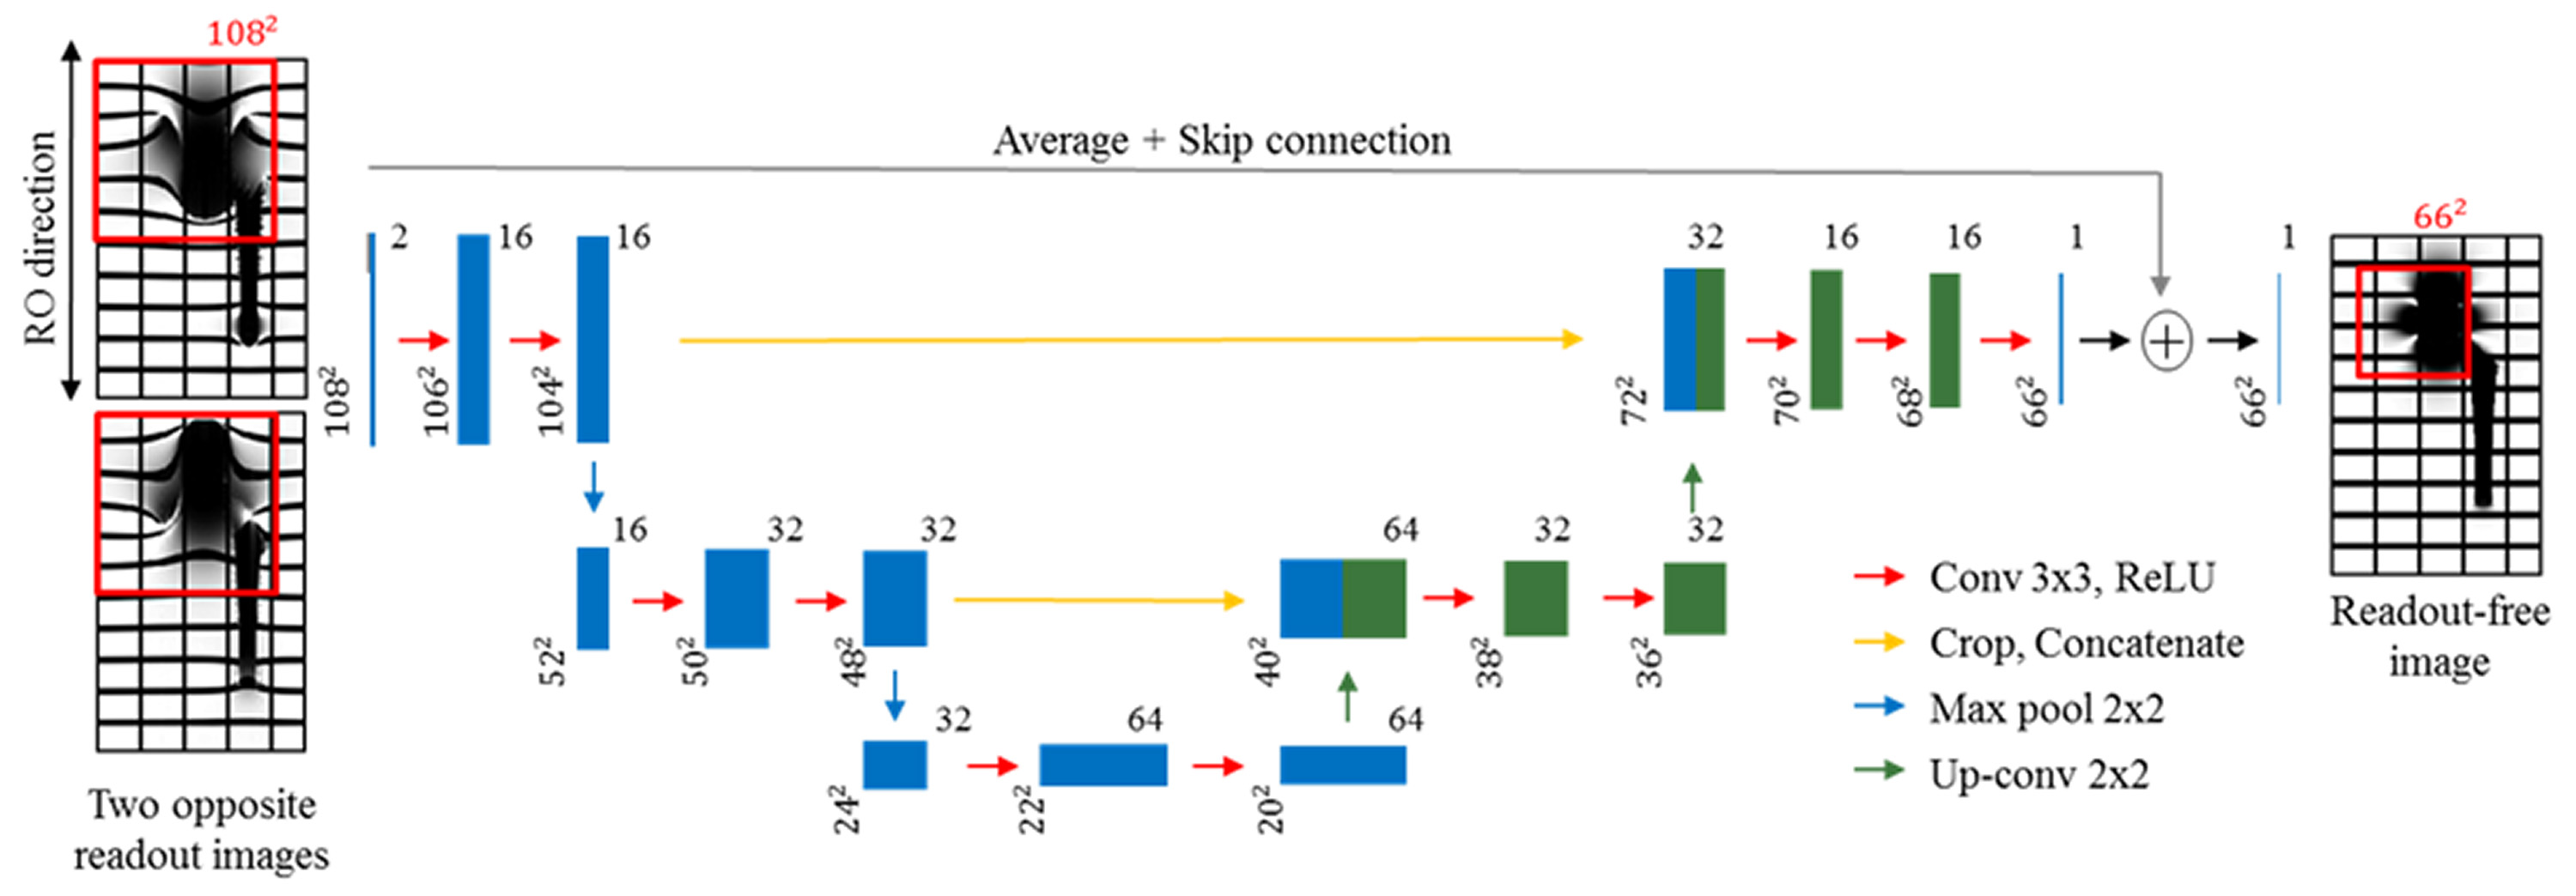
The proposed network was modified from U-net as shown in figure 1.4 The convolutional layers are appropriate to consider the bandlimited property of the field perturbation induced by metal. A multi-scale architecture of U-Net is efficient to increase receptive fields. The skip connection of each level (yellow) is utilized to avoid loss of information. The skip connection between input and output (gray) is utilized to learn only residual values between the connection, which helps learning to be stable and fast.5 Sub-images with 108$$$\times$$$108 and the corresponding sub-image with 66$$$\times$$$66 are utilized for input and output in the proposed network, respectively.
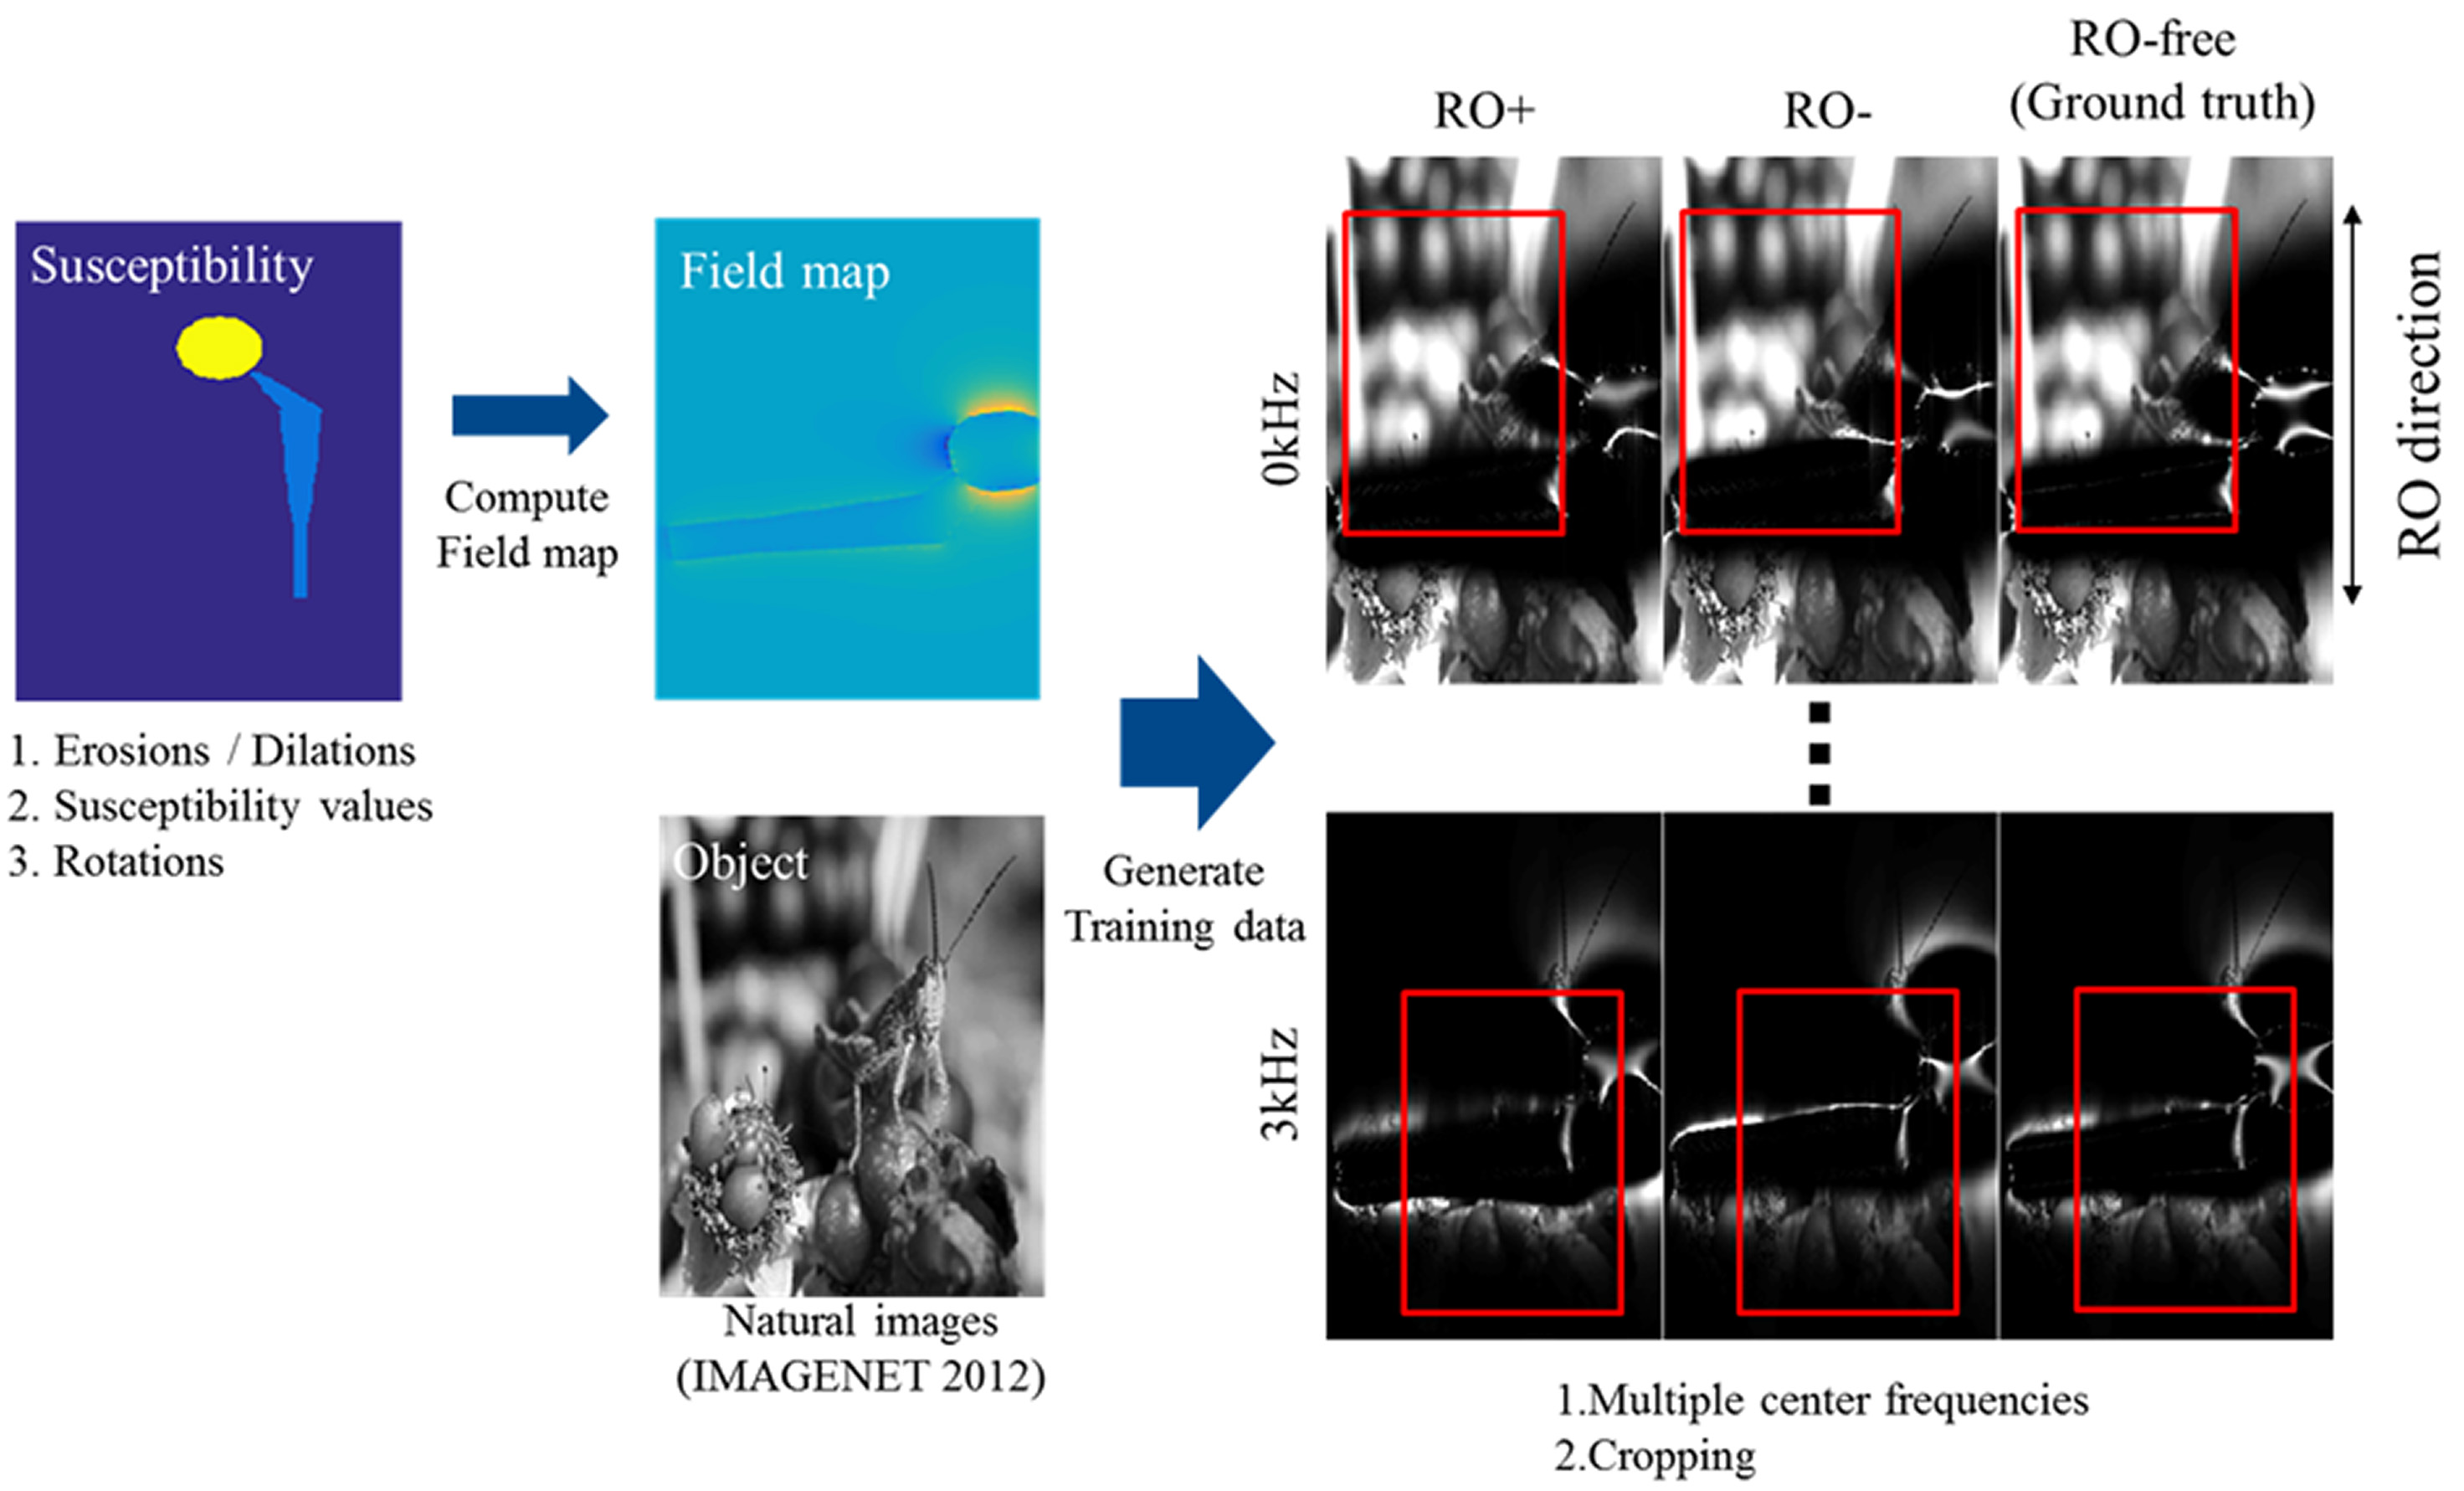
The overall scheme to generate the training data for the proposed network is displayed in figure 2. We additionally generate susceptibility maps by randomly performing erosion, dilation, and rotation operations and changing susceptibility values from the digital model of total hip replacement implant.6 The field maps are computed from the generated susceptibility maps.7 Two images with positive and negative-polarity readout gradients ($$$I_{RO+}$$$ and $$$I_{RO-}$$$) are generated, respectively, as follows:
$$I_{RO+}(x,y,b)=\rho(x+\frac{f-f_{b}}{rBW},y)\cdot RF(f-f_{b}) [1]$$
$$I_{RO-}(x,y,b)=\rho(x-\frac{f-f_{b}}{rBW},y)\cdot RF(f-f_{b}) [2]$$
where $$$x$$$ and $$$y$$$ are indices to represent spatial dimensions along the readout direction and the phase encoding direction, respectively, and $$$b$$$ is the spectral bins. In eqs. [1] and [2], $$$f$$$, $$$f_{b}$$$, and $$$rBW$$$ are off-resonance frequency, center frequency of the bin, and readout bandwidth per pixel, respectively; $$$\rho$$$ is the original image without spatial distortion; $$$RF$$$ is a function representing the RF excitation profile. A corresponding artifact-free image is generated as follows:
$$I_{RO-free}(x,y,b)=\rho(x,y)\cdot RF(f-f_{b}) [3]$$
In the abstract, natural images from ImageNet dataset were utilized for the original images.8 Total 0.5 million training data were generated by variations of field maps and RF profiles, and various original images.
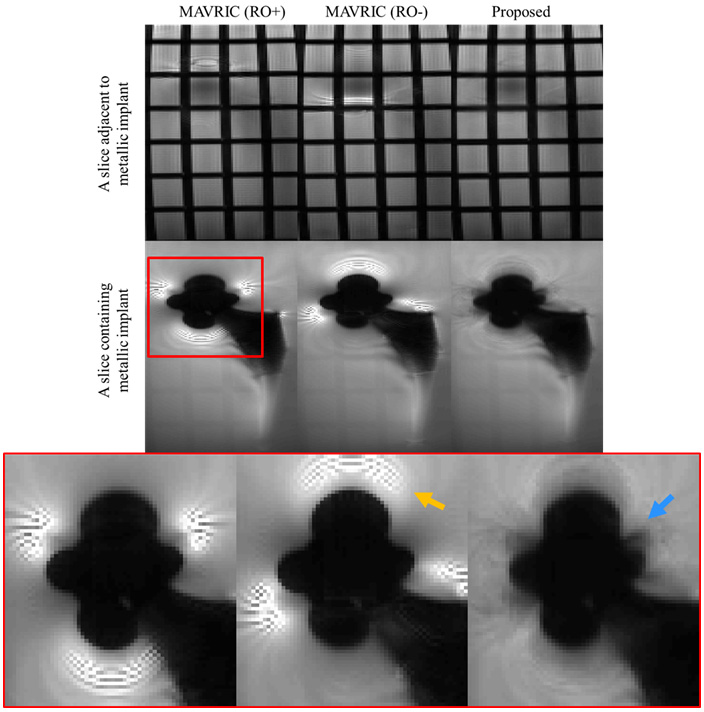
To show the performance of the proposed method, a physical phantom experiment was conducted using the 3T MRI system (Siemens Verio, Germany). The imaging sequences were based on MAVRIC,9 and a physical phantom with total hip replacement implant was scanned twice using positive and negative-polarity readout gradients. Their imaging parameters are given as follows: TR/TE=800/5ms, the number of spectral bins=25 (Gaussian RF profiles with 2.25 full-width-half-maximum separated by 1kHz), matrix size=512$$$\times$$$160$$$\times$$$20, voxel size=1$$$\times$$$1$$$\times$$$5$$$mm^{3}$$$, and readout bandwidth=780Hz/pixel.
Results
Discussion & Conclusion
We proposed a U-net based network to map two images with positive and negative-polarity readout gradients into artifact-free image. The simulated data was utilized for learning the network to overcome an impractical work that collects pairs of images with and without metal-induced artifacts. The proposed method significantly reduced the imaging time to acquire metal-artifact-free images by using the positive and negative-polarity readout gradients instead of all phase encodings.
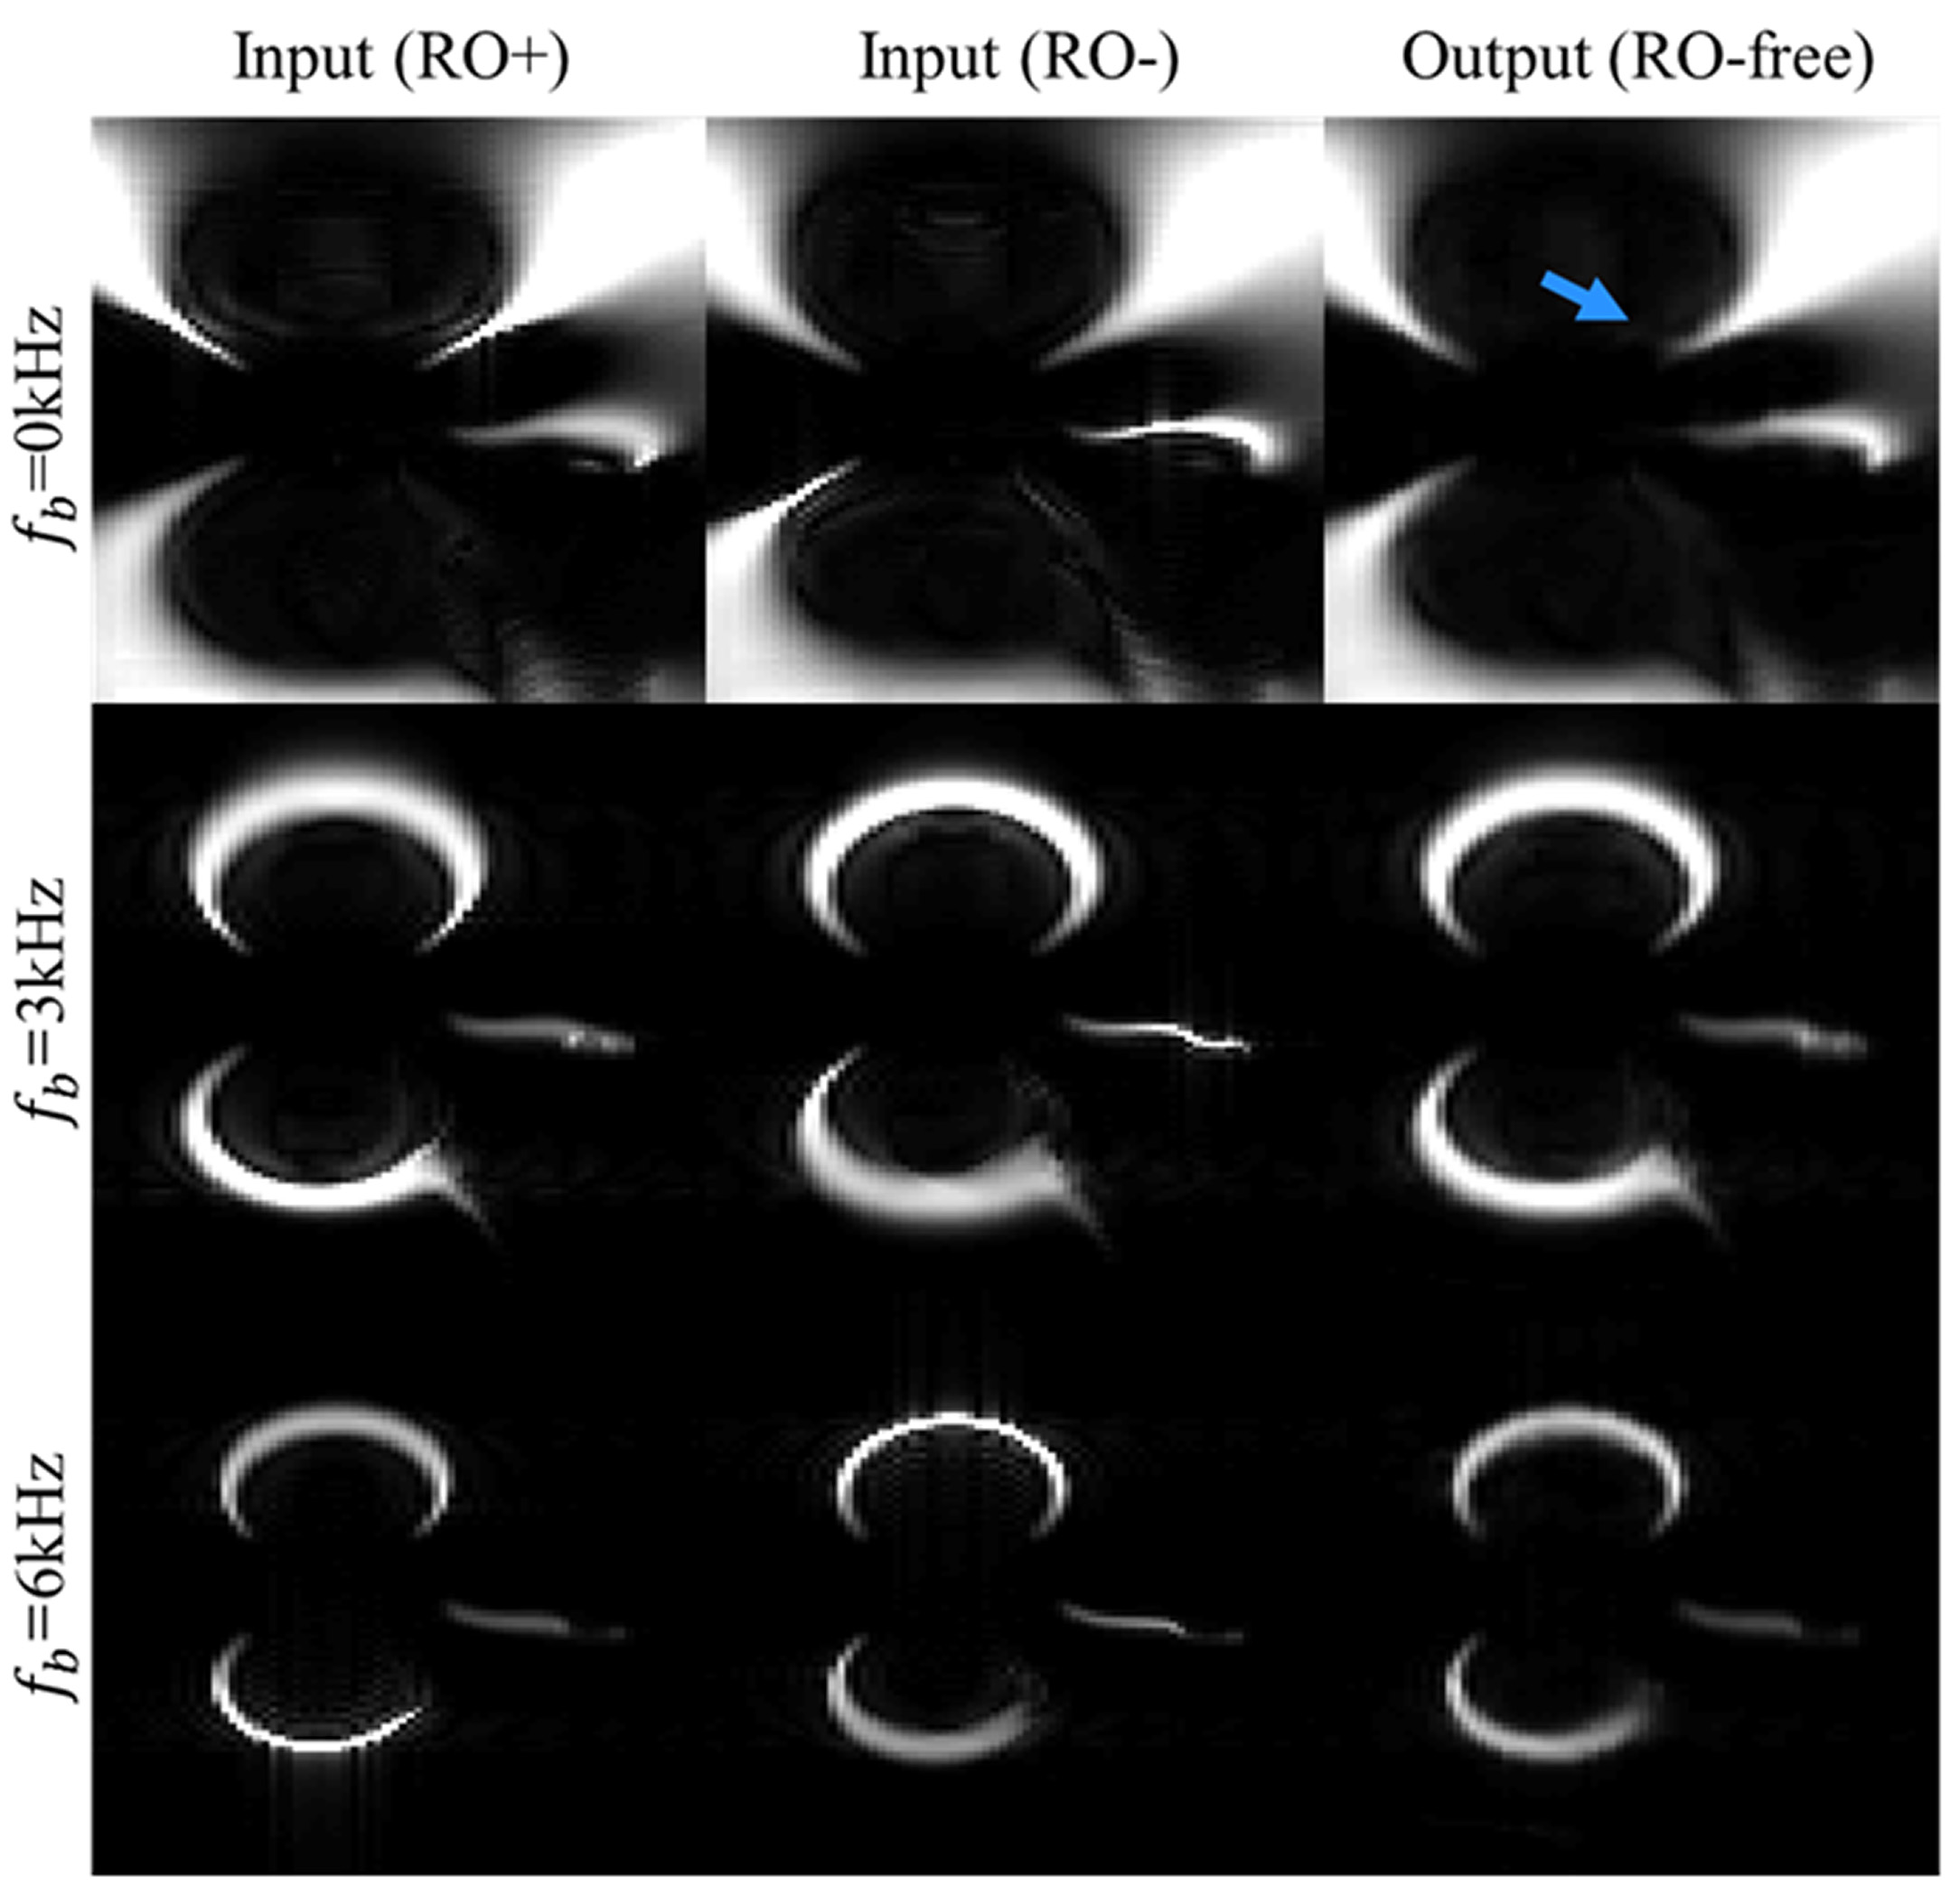
The proposed network was learned by minimizing mean squared error (MSE) between the estimated outputs and desired outputs. The MSE loss function has been known to produce blurring in estimated results,10 and their effects can be seen in figures 3 and 4 (blue arrows). Various loss functions like gradient difference loss would be applied to relieve this problem in future works.
Acknowledgements
This research was partly supported by the Brain Research Program through the National Research Foundation (NRF) grant funded by the Korea government (MSIT) (No.2014M3C7033999, Development of multi-channel/multi-nuclei MR imaging and reconstruction method for brain disease), and by Institute for Information & communications Technology Promotion (IITP) grant funded by the Korea government (MSIT) (No.2017-0-01778, Development of Explainable Human-level Deep Machine Learning Inference Framework).References
1. Koch KM, et al. Imaging Near Metal with a MAVRIC-SEMAC Hybrid. MRM 2011;65:71-82.
2. Koch KM, et al. Imaging Near Metal: The Impact of Extreme Static Local Field Gradients on Frequency Encoding Processes. MRM 2014;71:2024-2034.
3. Artz NS, et al. Spectrally Resolved Fully Phase-Encoded Three-Dimensional Fast Spin-Echo Imaging. MRM 2014;71-681-690.
4. Ronneberger O, et al. U-Net: Convolutional Networks for Biomedical Image Segmentation. MICCAI 2015:234-241.
5. He K, et al. Deep Residual Learning for Image Recognition. CVPR 2016.
6. Shi X, et al. Metallic Implant Geometry and Susceptibility Estimation Using Multispectral B0 Field Maps. MRM 2017;77:2402-2413.
7. Marques JP, et al. Application of a Fourier-Based Method for Rapid Calculation of Field Inhomogeneity Due to Spatial Variation of Magnetic Susceptibility. Concepts in Magnetic Resonance Part B: Magnetic Resonance Engineering 2005;25:65-78.
8. Russkovsky O, et al. ImageNet Large Scale Visual Recognition Challenge. IJCV, 2015
9. Koch KM, et al. A Multispectral Three-Dimensional Acquisition Technique for Imaging Near Metal Implants. MRM 2009;61:381-390.
10. Mathieu M, et al. Deep Multi-Scale Video Prediction beyond Mean Square Error. ICLR 2016.
Figures