3360
Multiparametric MRI Reveals Blood-Flow Dependent Spatial and Temporal Variations in Murine Venous Thrombosis1Biomedical Engineering, University of Michigan, Ann Arbor, MI, United States, 2Biomedical Engineering and Biostatistics, University of Michigan, Ann Arbor, MI, United States, 3Surgery, Vascular Surgery, University of Michigan, Ann Arbor, MI, United States
Synopsis
There is a critical need for a noninvasive method to determine the optimal treatment for patients with deep vein thrombosis (DVT), the 3rd most common cardiovascular disease. We have implemented multiparametric MRI to evaluate spatial and temporal changes in thrombus composition using two murine models of DVT. We show that T2- and T2*-weighted MRI detects blood-flow dependent variations in thrombus composition. Classification in fully occlusive thrombi indicated an increased inflammatory response and more rapid thrombus organization when compared to thrombi developed in the presence of blood flow. This work provides foundational methodology that could eventually inform optimal DVT treatment planning.
Introduction
Deep vein thrombosis (DVT) globally ranks as the 3rd most common cardiovascular disease1. Despite current treatments, 1/3 of cases result in fatality2. Some therapies, such as catheter-directed thrombolysis, are only effective on acute thrombi due to changing composition3. Determining the age of the thrombus by a timeline of symptoms alone is unreliable and puts the patient at risk. There is a need for a noninvasive method to provide information on thrombus composition as it relates to hemodynamics and composition changes over time, which could ultimately inform patient-specific treatment planning. Using multiparametric (MP) MRI, we evaluated the spatial and temporal changes in thrombus composition of two murine DVT models mimicking the two possible clinical scenarios, partial or total occlusion.Methods
DVT was induced in male C57BL6 mice aged 10-12 weeks by either total inferior vena cava (IVC) ligation (stasis model; ligation of the IVC just distal to the left renal vein and interruption of all branching vessels draining into the IVC between the left renal vein and iliac bifurcation), or by the electrolytic IVC model (blood flow model; ligation of lateral branches with application of 250 µA for 15 minutes via a copper wire placed within the IVC along the anterior wall).
Mice were imaged at 7T on days 2, 7, and 14. Contiguous axial slices (1 mm thick, field of view 30 x 30 mm2, matrix 2562 zero-filled to 5122) were acquired using a time-of-flight (TOF) bright blood gradient echo sequence to define the thrombus boundary (repetition time [TR]/echo time [TE] 15/4.9ms, flip angle [FA] 20º, number of excitations [NEX] 3, ~4min), a T2*-weighted sequence (TR/TE 200/6ms, FA 20º, NEX 4, ~4min), and a T2-weighted fast spin echo sequence (TR/TEeffective 1500/20ms, echo spacing 10ms, echo train length 2, NEX 3, ~10min).
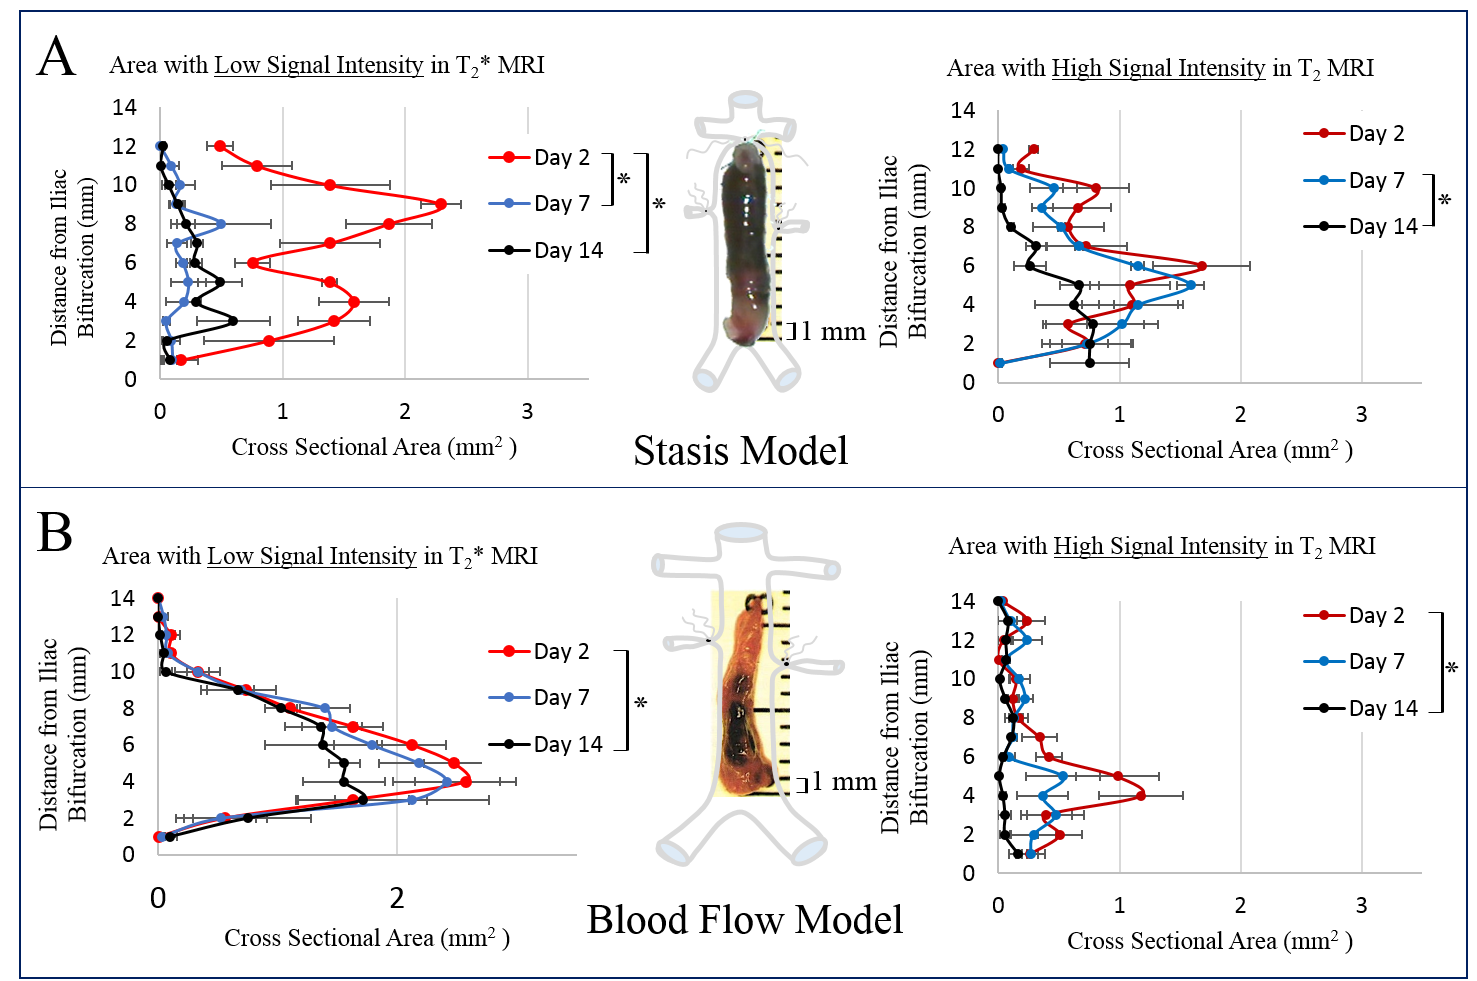
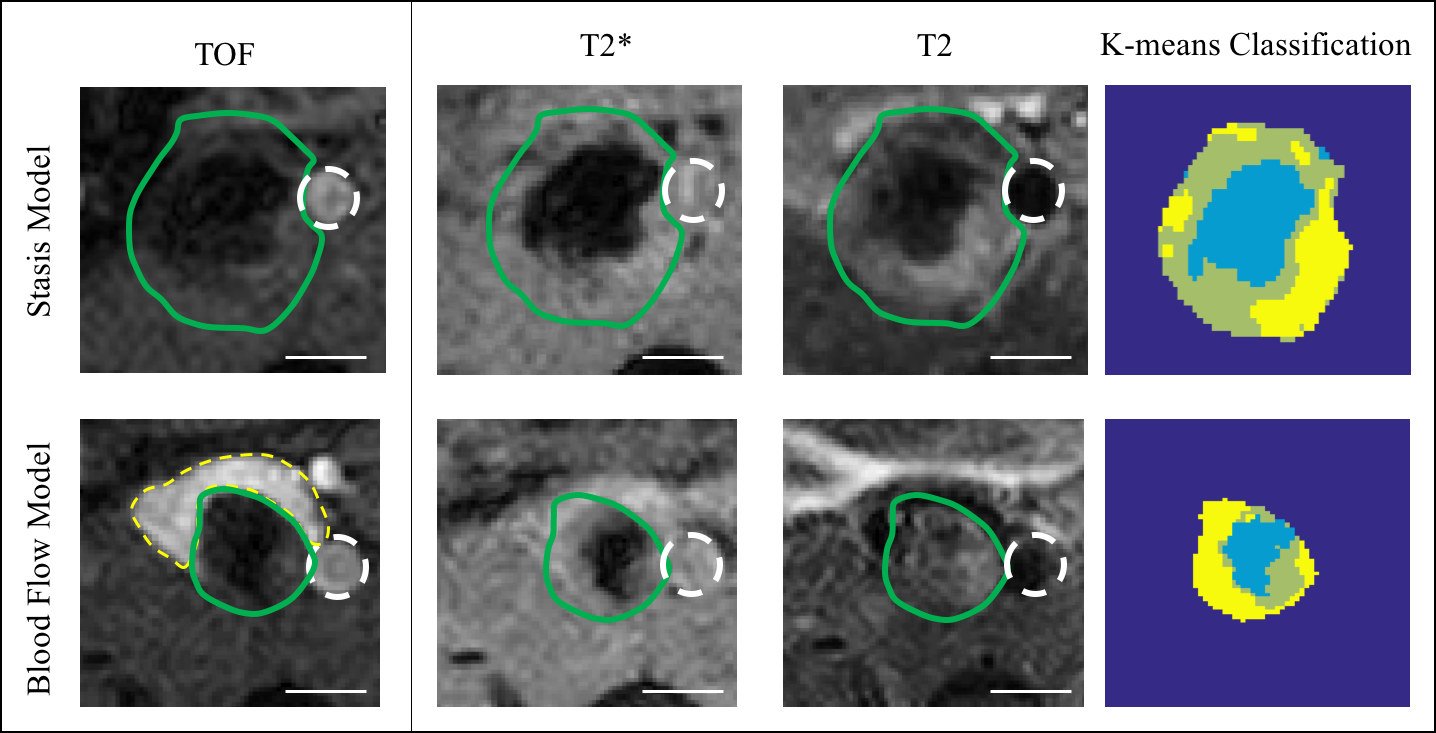
First, thresholding techniques were used to assess the individual MRI signals for similarities/differences across animals and between models (Fig. 1), focusing on low T2* signal as an indicator of highly structured material and/or the potential entrapment of deoxygenating red blood cells (RBCs; average signal intensity in a region of dark thrombus + 2 standard deviations = maximum threshold) and high T2 signal as an indicator of fluid related to edema (average signal intensity in a region of bright thrombus + 2 standard deviations = minimum threshold). Subsequently, a k-means clustering algorithm was used to classify voxels within the thrombus into three populations based on the MP-MRI (Fig. 2).
Results and Discussion
Thrombus composition varied spatially and temporally. Low T2* signal, indicating structured material such as a fibrin mesh or deoxygenating RBCs, was most prevalent at day 2 in both models (Fig. 1 left). Interestingly, thrombi developed under stasis conditions saw a sharp decrease in regions of low signal intensity in T2* at days 7 and 14 (Fig. 1A left), whereas thrombi developed under flow saw a more gradual decrease in the amount of low T2* signal intensity regions with time (Fig 1B left). Thrombi from the blood flow model showed low intensity T2* regions through day 14, centered on the site where current was applied to activate the endothelium. This suggests that totally occlusive thrombi may begin to remodel more quickly compared to thrombi in the presence of blood flow, via deposition of disorganized collagen eventually forming a collagen-rich scar. Regions with high T2 signal were more prevalent in the stasis model at all time points (Fig. 1 right), indicating an increased inflammatory response in occlusive thrombi.
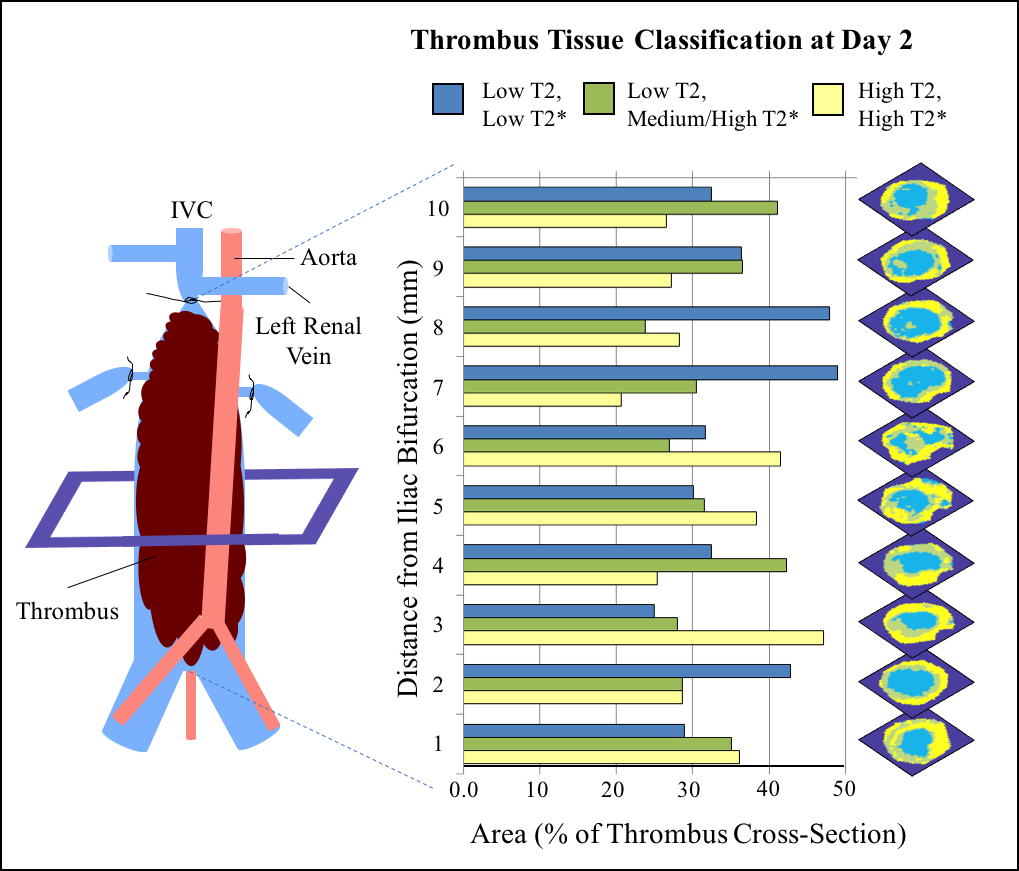
Tissue classification by k-means clustering further supports that blood flow conditions affect thrombus composition (Fig. 2). Spatial variation in tissue classification was assessed in stasis-induced thrombus at day 2 (Fig. 3). Highly structured tissue (low T2 and T2*) was most prevalent closer to the ligature site, while possible sites of edema (high T2 and T2*) tended to increase closer to the iliac bifurcation. This method of multiparametric classification will allow for the quantification of the amount of specific tissue populations within a thrombus over time.
Conclusion
This work demonstrates for the first time that non-contrast multispectral MRI provides information on thrombus composition, which was shown to vary in space and time. Consistent with ex vivo findings, thrombus composition determined by MRI is dependent on blood flow conditions. This work provides foundational methodology that could eventually be used clinically to predict patient-specific susceptibility to DVT lysis therapies, which would reduce risk of death and improve quality of life. Future work will map signal intensity signatures to specific tissue components determined by immunohistochemistry.Acknowledgements
No acknowledgement found.References
1. Raskob GE, Angchaisuksiri P, Blanco AN, et al. Thrombosis: A major contributor to global disease burden. Thromb Res. 2014;134(5):931-938. doi:10.1016/j.thromres.2014.08.014.
2. Heit J, Cohen A, Anderson F. Estimated annual number of incident and recurrent, non-fatal and fatal venous thromboembolism (VTE) events in the US. Blood. 2005;106(11):910.
3. Vedantham S. Catheter-directed thrombolysis to avoid late consequences of acute deep vein thrombosis. Thromb Res. August 2017. doi:10.1016/j.thromres.2017.08.010.
Figures