3346
Particle swarm optimization (PSO) and comparison of a water selective T2 preparation module for simultaneous robust fat suppression and tissue contrast enhancement at 3T1Radiology, Lausanne University Hospital (CHUV), Lausanne, Switzerland
Synopsis
Gradient echo based pulse sequences at 3T may lack the required contrast to distinguish blood from muscle. To overcome this, T2 preparation (T2-prep) modules are used in cardiac imaging to distinguish the blood pool from the myocardium. To suppress unwanted fat signals, we exploited the additional degrees of freedom that offer the multiple radiofrequency pulses of an adiabatic T2-prep and we used particle swarm optimization (PSO) to develop a T2-prep with robust fat suppression capabilities that works in the presence of flow. Its robustness against B1 and B0 inhomogeneities were predicted by the Bloch simulations for a range of fatty tissue frequencies, and could be confirmed experimentally both in phantoms and in volunteers.
Introduction
Gradient echo (GRE) based pulse sequences at 3T may lack the required contrast to distinguish blood from muscle. To overcome this, T2 preparation (T2-prep) modules [1] are used in cardiac imaging to distinguish the blood pool from the myocardium. To suppress unwanted fat signals, additional lengthy and specific absorption rate (SAR)-demanding modules are often necessary, as their brightness may distort image quality, or hinder anatomical visualization due to chemical shift artifacts. However, higher magnetic field strengths may complicate conventional fat saturation techniques, such as CHESS [2], which are sensitive to B1 and B0 field inhomogeneities.
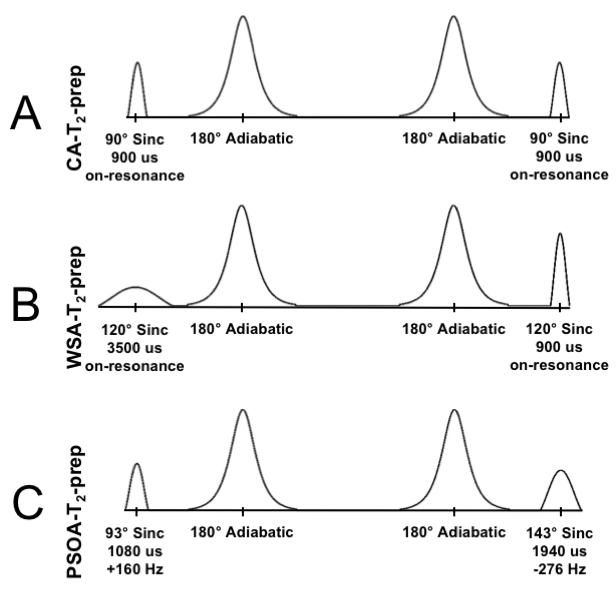
In this study, the aim was to exploit the additional degrees of freedom that the multiple radiofrequency (RF) pulses of an adiabatic T2-prep offer and to use particle swarm optimization (PSO) to develop a T2-prep with robust fat suppression capabilities that works in the presence of flow [3]. The new PSO adiabatic T2-prep (PSOA-T2-prep) was compared with a conventional adiabatic T2-prep (CA-T2-prep) [4] (Fig. 1A) and a water-selective adiabatic T2-prep [5] (WSA-T2-prep) (Fig. 1B) through numerical simulations, phantom experiments, and cardiac experiments in volunteers.
Methods
Simulations: The duration, frequency and amplitude of the RF excitation and restoration pulses, as well as the initial phase of the RF excitation pulses were optimized using particle swarm optimization (PSO)[6,7]. Bloch equation simulations of the T2-prep were performed in Matlab (The Mathworks) to compute its fitness function, which was defined as follows:
$f = SD(Fz,res - 0.05) + SD(Wz,exc) + SD(Wz,res - 1)$
where SD is the standard deviation, Fz and Wz are the longitudinal magnetizations of fat (resonance frequencies spanning from -600 Hz to -200 Hz) and water (frequency = 0 Hz) , subscript exc and res indicates the magnetization after excitation and restoration respectively. For each simulated tissue frequency, the B1 strength was varied between 80% and 120%.
Acquisitions: The three different T2-preps were implemented in a Cartesian, 2D segmented k-space GRE sequence at 3T system (Prisma, Siemens). The developed PSOA-T2-prep was tested against the CA-T2-prep and the WSA-T2-prep on a 3-compartment phantom that mimics the magnetic properties of blood, fat and myocardium. Sequence parameters: pixel size 1.1x1.1mm2 resolution, 14 k-space lines acquired per T2-prep (duration of 40 ms) spaced by 800 ms, RF excitation angle 15°, TE = 3.71 ms, TR = 8.07 ms, slice thickness = 5mm. In addition, ECG-triggered 2D breath-held acquisitions of the heart and thigh with parameters identical to the phantom scan were acquired on volunteers (N=3). The signal-to-noise ratio (SNR) and contrast-to-noise ratio (CNR) were computed in signal compartments containing blood, myocardium, chest fat, and epicardial fat. The specific absorption rate (SAR) was monitored during the scans. Differences were tested via a Student’s t-test for paired data, with a p-value < 0.05 considered as significant.
Results
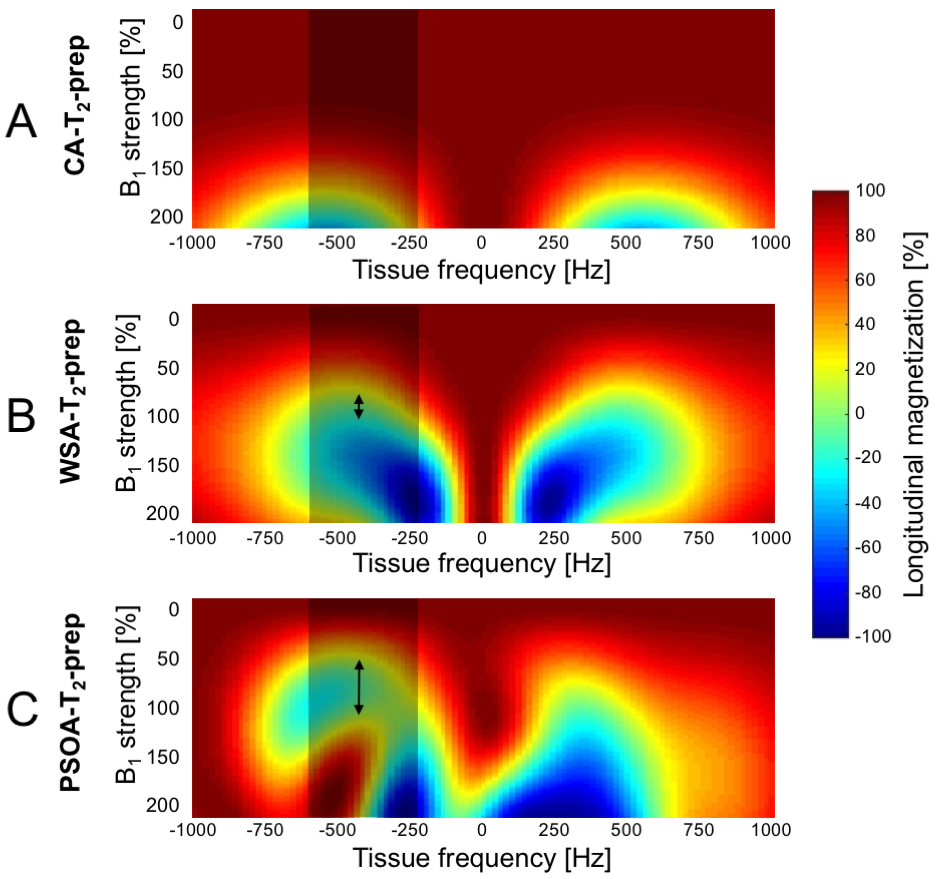
Simulations: The excitation and restoration pulses parameters obtained by PSO (Fig. 1C) show a complete T2 preparation of water, while suppressing a range of fat frequencies (See animation uploaded as Fig. 5). Bloch simulations predicted an increased robustness in fat suppression of the PSOA-T2-prep in comparison to the CA-T2-prep and the WSA-T2-prep (Fig. 2).
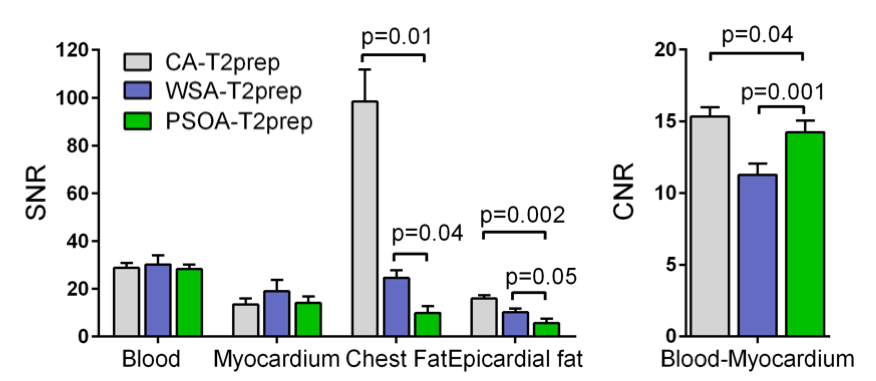
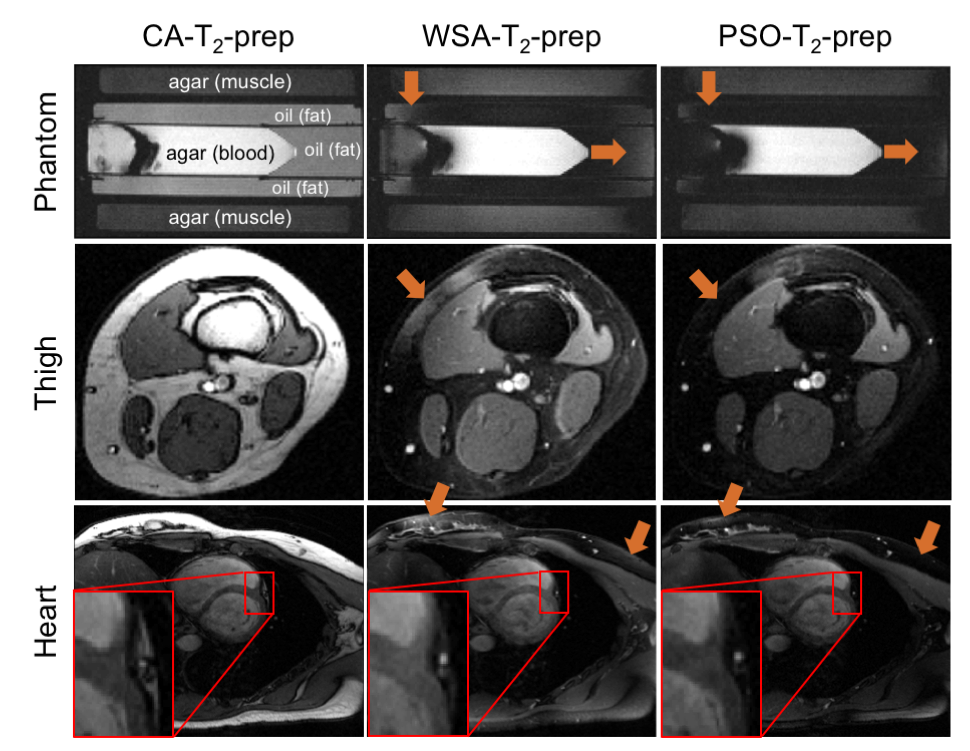
Acquisitions: The PSOA-T2-prep visually reduced fat signal compared to CA-T2-prep and WSA-T2-prep (Fig. 4). Compared to the CA-T2-prep, the PSOA-T2-prep reduced chest and epicardial fat SNR by 90.0% (p=0.01) and 64.8% (p=0.002) respectively (Fig. 3). Compared to the WSA-T2-prep, the PSOA-T2-prep decreased chest and epicardial fat signal by 59.9% (p=0.044) and by 44.9% non-significantly (p=0.051) respectively. The PSOA-T2-prep reduced blood-myocardium CNR by 7.3% (p=0.036) compared to the CA-T2-prep, but increased it by 26.3% (p=0.001) compared to the WSA-T2-prep.
Discussion
The robust fat suppression capabilities of the PSOA-T2-prep were predicted by the Bloch simulations for a range of fatty tissue frequencies, and could be confirmed experimentally both in phantoms and in volunteers, despite the challenging B0 and B1 inhomogeneities at 3T. Moreover, the on-resonance magnetization was fully T2-prepared, in contrast to the WSA-T2-prep which overtips the magnetization by 30° during the T2-prep and thus effectively protects the magnetization against T2 decay, decreasing the total T2 contrast, which may be particularly important in applications such as T2-mapping [8]. Conversely, the PSOA-T2-Prep may be more sensitive to B1 inhomogeneities in on-resonance tissues (e.g. water); these can seen in simulations (Fig. 2C) and may also explain the small decrease in CNR observed in vivo, as compared to the CA-T2-prep.Conclusion
We have developed a novel adiabatic T2 preparation module and demonstrated efficient T2 preparation while simultaneously providing robust fat suppression compared to the water-selective T2 preparation module.Acknowledgements
This work was supported by grants from theSwiss National Science Foundation (PZ00P3_167871) as well as by the Centre d’Imagerie BioMédicale (CIBM) of the UNIL, UNIGE, HUG, CHUV, EPFL, and the Leenaards and Jeantet Foundations.References
[1] Brittain JH, Hu BS, Wright GA, Meyer CH, Macovski A, Nishimura DG. Coronary angiography with magnetization-prepared T2 contrast. Magn Reson Med 1995;33:689–696.
[2] Haase A, Frahm J, Hanicke W, Matthaei D. 1H NMR chemical shift selective (CHESS) imaging. Phys Med Biol 1985;30:341–344.
[3] Nezafat R, Ouwerkerk R, Derbyshire AJ, Stuber M, McVeigh ER. Spectrally selective B1-insensitive T2 magnetization preparation sequence. Magn Reson Med 2009;61:1326–1335.
[4] Nezafat R, Stuber M, Ouwerkerk R, Gharib AM, Desai MY, Pettigrew RI. B1-insensitive T2 preparation for improved coronary magnetic resonance angiography at 3 T. Magn Reson Med 2006;55:858–864.
[5] Coristine A, van Heeswijk R, Stuber M, Fat Signal Suppression for Coronary MRA at 3T Using a Water-Selective Adiabatic T2-Preparation Technique. Magn Reson Med 2014; 72:763–769.
[6] Kennedy J, Eberhart R, Particle swarm optimization. Proceedings of the IEEE International Conference on Neural Networks, 1995;1942–1948.
[7] Clerc M, Standard Particle Swarm Optimisation. 15 pages. 2012.
[8] van Heeswijk RB, Feliciano H, Bongard C, et al. Free-breathing 3 T magnetic resonance T2-mapping of the heart. JACC Cardiovasc Imaging 2012;5:1231–1239.
Figures