3345
Monitoring intraluminal thrombus (ILT) progression in abdominal aortic aneurysm (AAA) using 3D black blood MRI: a longitudinal analysis1Radiology, University of California, San Francisco, San Francisco, CA, United States, 2Radiology, Xuanwu Hospital, Beijing, China, 3Radiology, Anzhen Hospital, Beijing, China
Synopsis
The composition of intraluminal thrombus (ILT) is uniquely identified by MRI and has been suggested as a marker of abdominal aortic aneurysm (AAA) growth. However, the natural history of ILT progression is still unknown. This study followed 25 AAA patients over 19±9 months using repeated high resolution black-blood MRI. We found baseline ILT types did not predict AAA growth, however, AAAs with new ILT formation or fresher ILT during follow-up grew 3 times faster than AAAs without ILT change or older ILT (4.0±2.3mm/year vs. 1.3±2.5 mm/year, p=0.009). Monitoring ILT change provides new insights into the AAA risk assessment.
Introduction
Clinical management of abdominal aortic aneurysms (AAA) is based on the maximal diameter. However, smaller AAAs also rupture1. A previous study suggested AAAs with hyper-intense signal on T1-weighted MRI, presumed to be fresh intraluminal thrombus (ILT), grew 3 times faster than AAAs without fresh ILT, although the baseline diameters were similar2. However, little is known about the natural history of ILT. This study aims to 1) evaluate the ILT progression overtime using high resolution black blood MRI, and 2) assess the relationship between ILT composition change and AAA growth.Methods
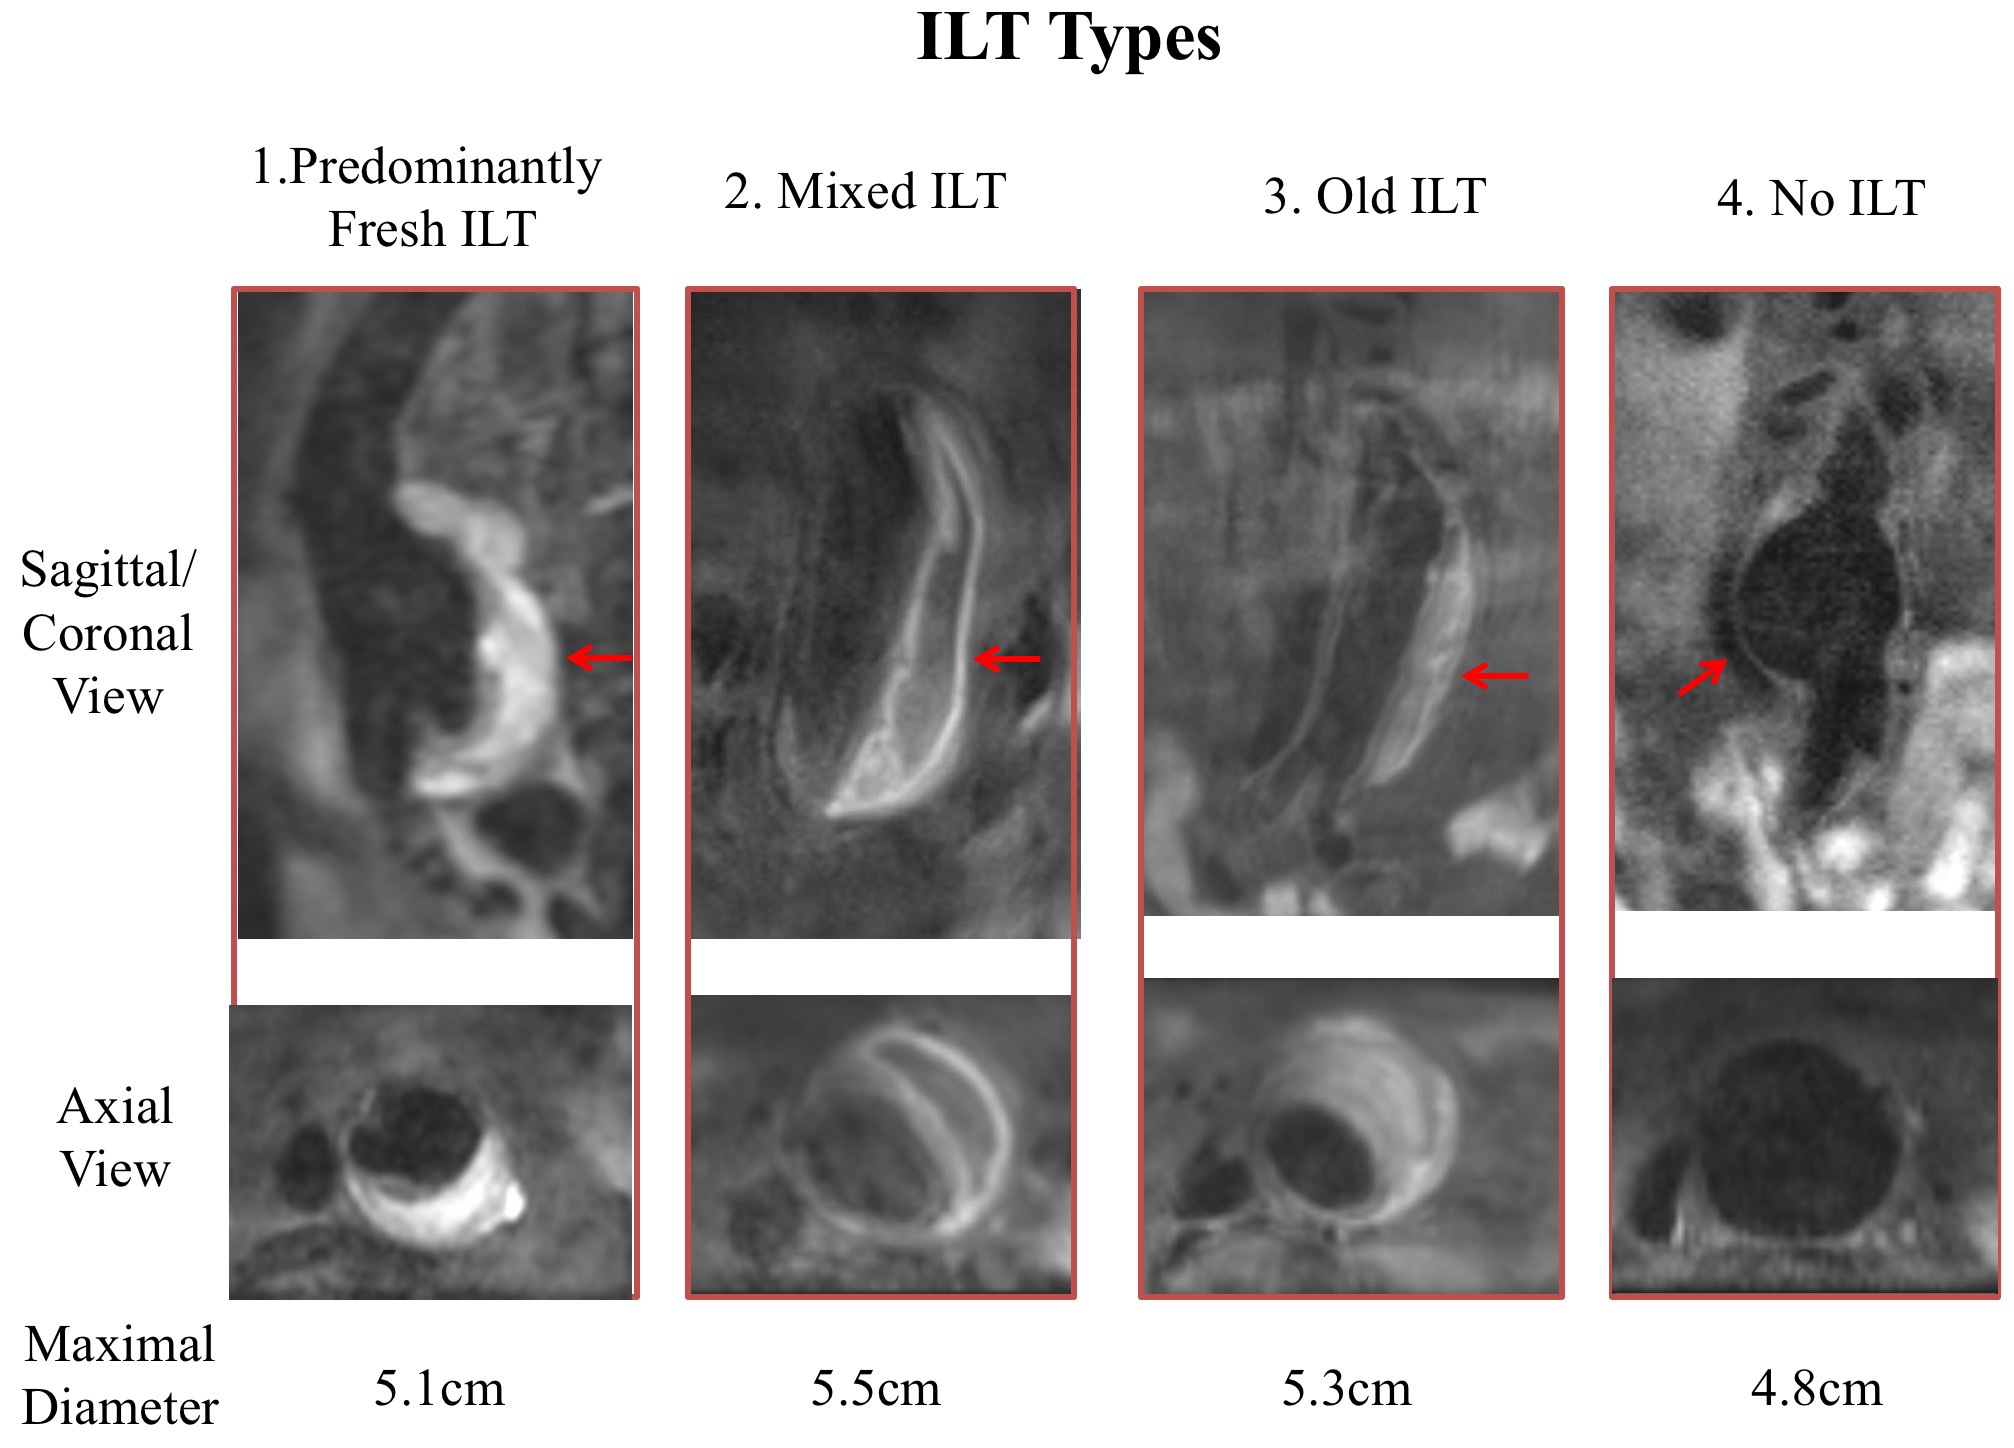
Study population: 30 patients (all male, age 71.7±8.3 years) with AAA diseases who were under surveillance with scans at two time points or more were included in this study. Scanning protocols: MR images were acquired on a Siemens 3T scanner (Skyra) using a previously developed sequence validated against CTA. 3D blood suppressed T1-weighted fast-spin-echo with variable flip angle train (DANTE-SPACE) 3 4 were used: TR/TE: 800ms/20ms, echo train length 60, 1.3mm isotropic resolution, scan time 7 minutes. Image analysis: Two radiologists independently measured the maximal AAA diameter using multi-planar reconstruction. ILT was categorized as fresh if its signal on black blood MRI was 1.2 times higher than that of adjacent psoas muscle 2. Four conditions were identified by the radiologists based on previously defined criteria4 (Figure 1): 1) Predominantly fresh; 2) Mixture of fresh and old ILT; 3) Old; and 4) No ILT. The relationship between baseline ILT types/ILT type changes over time and AAA growth were analysed. ANOVA was used to compare multiple groups.Results
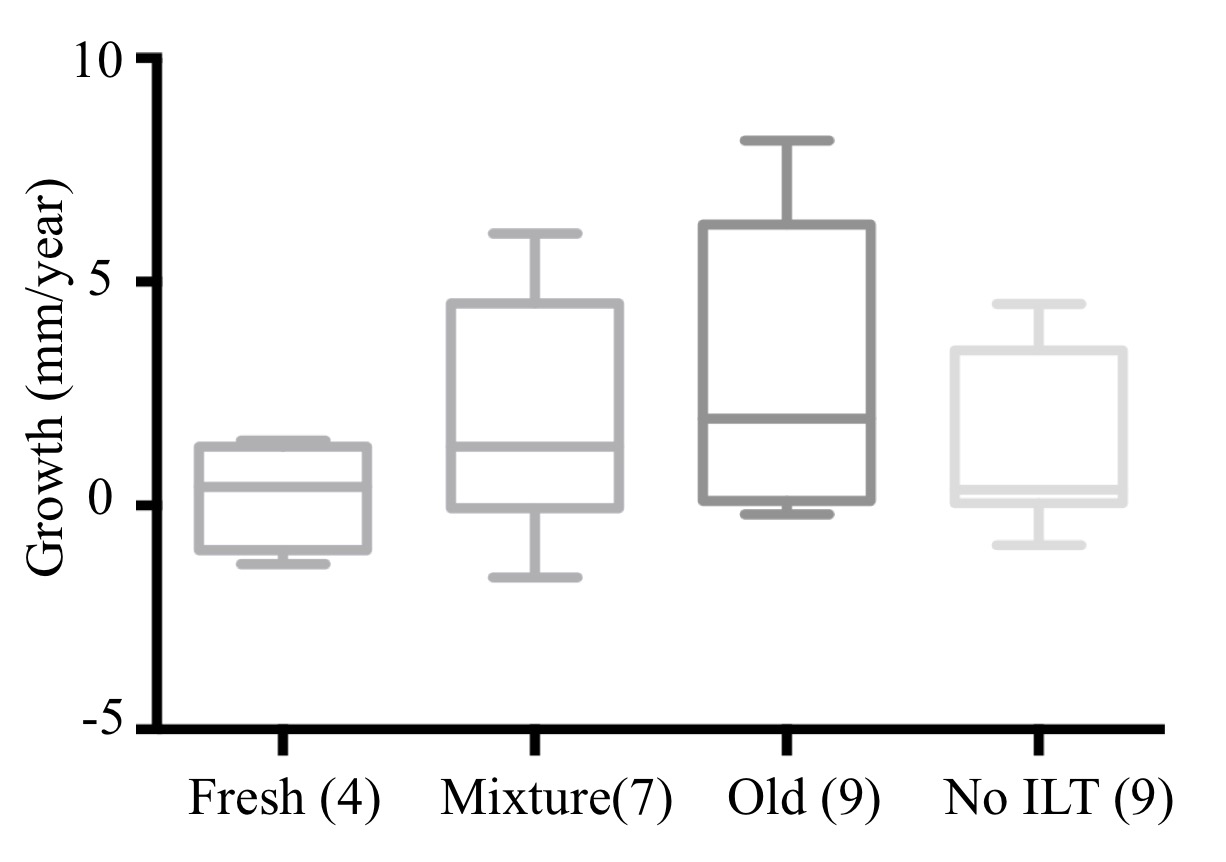
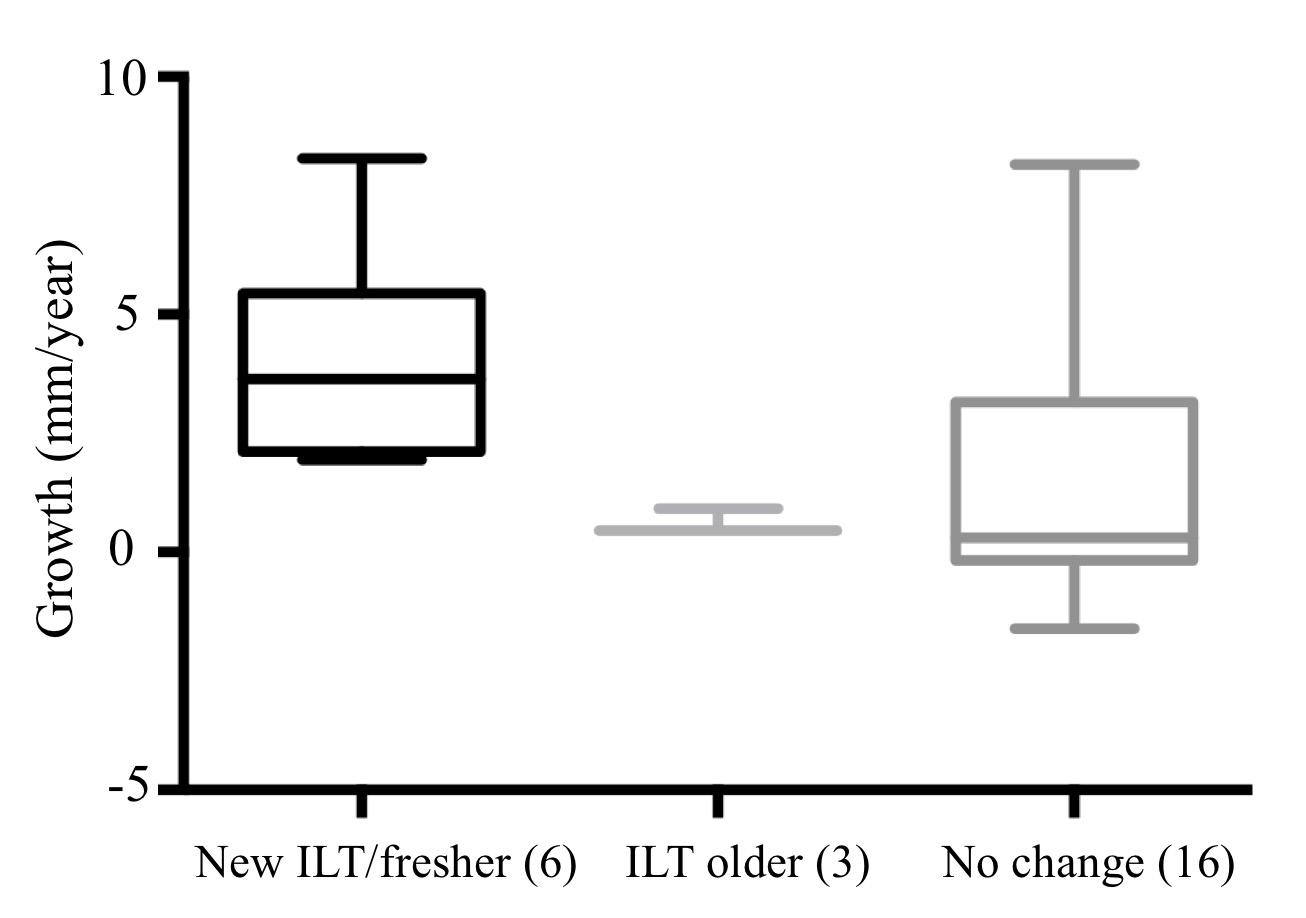
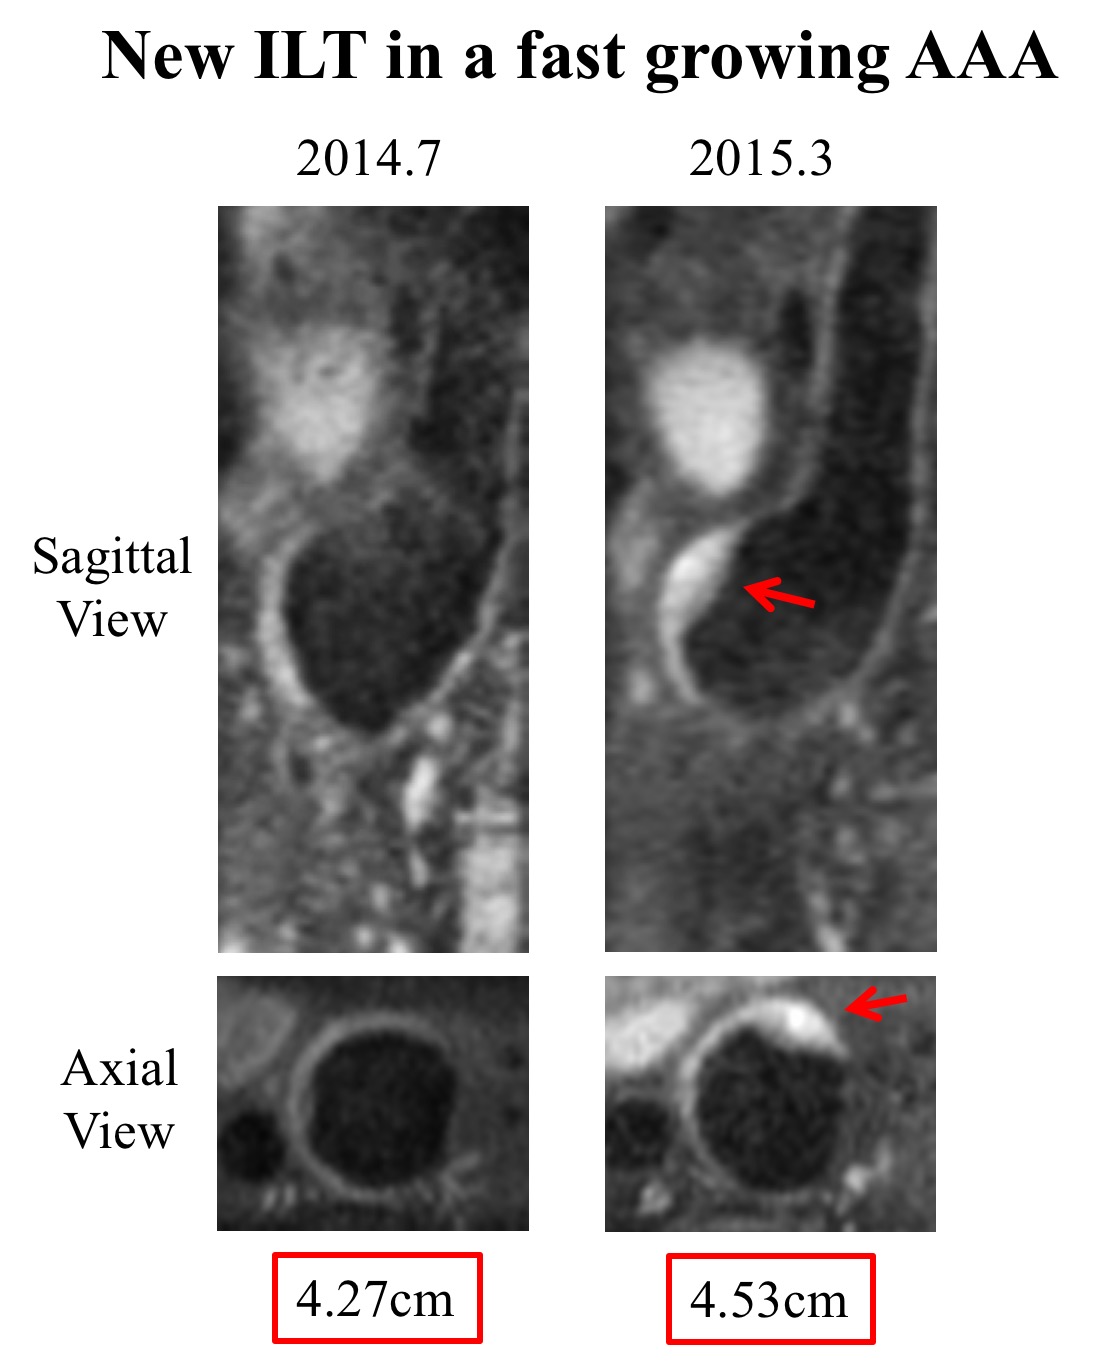
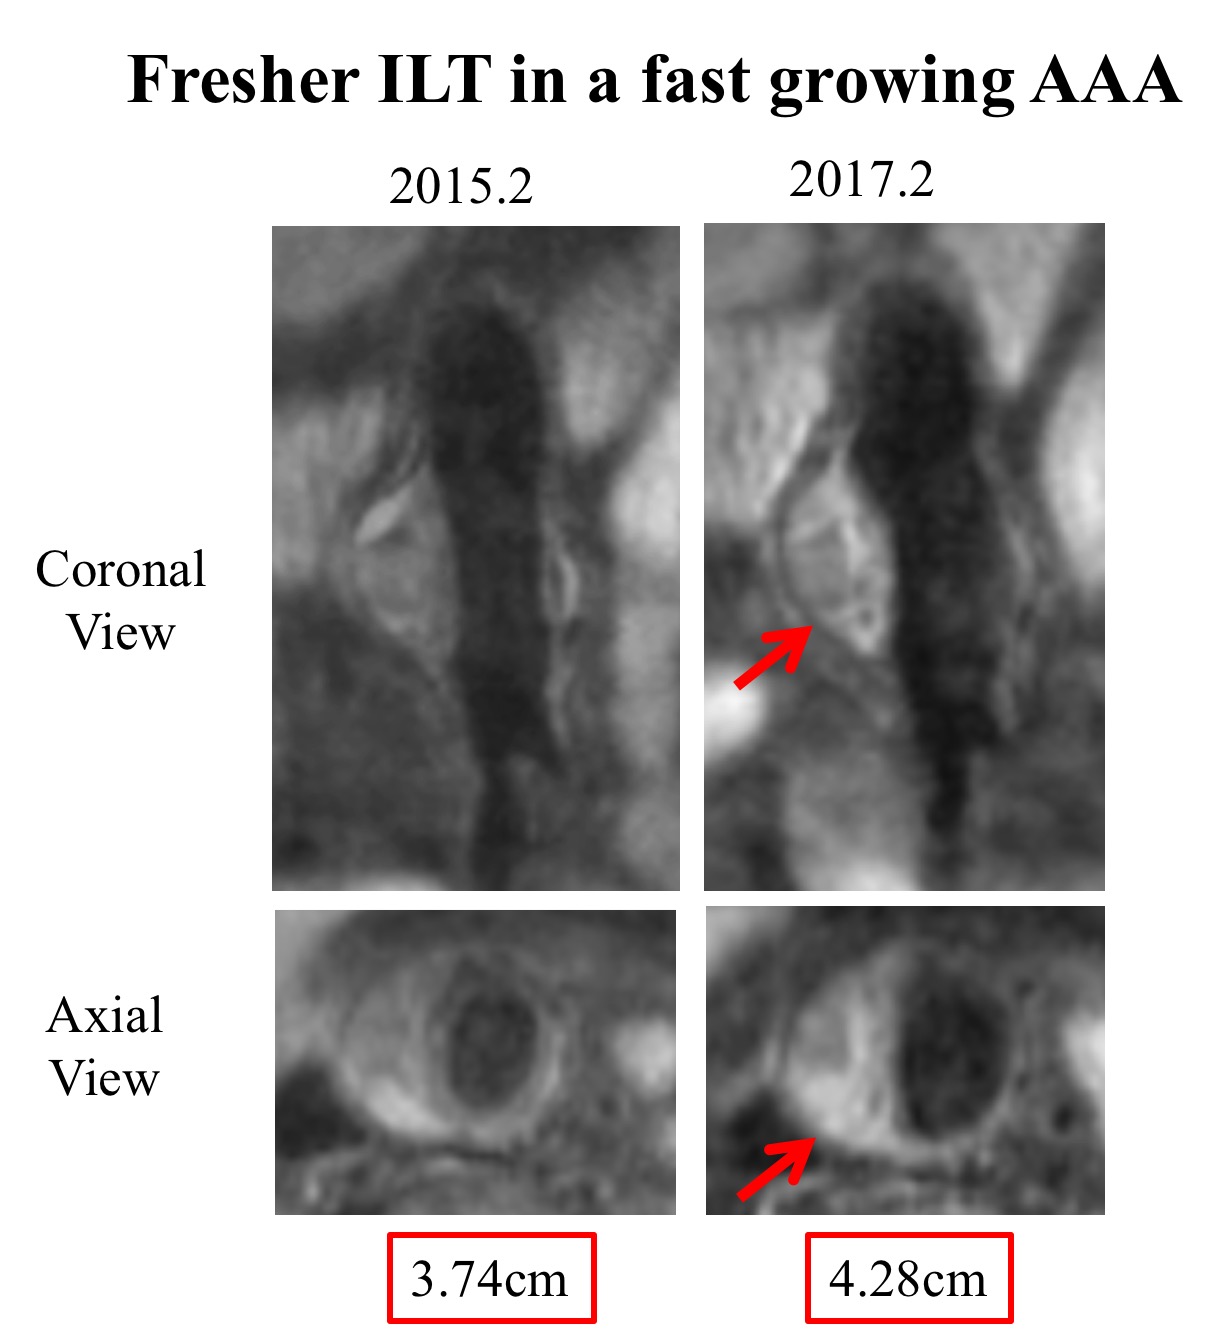
In the 30 patients, 5 patients had a follow-up interval less than 6 month were excluded from analysis. The remaining 25 patients were followed over 19±9 months, with baseline diameter of 4.6±1.2cm, and final study diameter 4.9±1.2cm, and average growth rate of 1.9±2.7 mm/year. ILT types: At baseline, there were 4 AAAs with predominately fresh ILT, 7 mixed ILT, 5 old ILT, and 9 AAAs with no ILT. There was no overall significant difference of growth rate among different ILT types (p=0.50, Figure 2). Presence of fresh ILT was not associated with AAA growth (Type 1&2, 1.9±3.1mm/year vs. Type 3&4, 2.0±2.5mm/year, p=0.73), and the baseline diameters were not significantly different (5.0±1.3cm vs. 4.3±0.8cm, p=0.20). ILT changes: As shown in Figure 3, during follow up, ILT types in the majority of patients remained unchanged (n=16), with a growth rate of 1.4±2.8 mm/year. 6 patients had either new ILT formation (n=2) or ILT appeared fresher (n=4). These patients showed a substantially faster growth of 4.0±2.3 mm/year. The ILT in 3 patients appeared to become older, with very slow growth (0.6±0.3 mm/year). The new/fresher ILT group had significantly higher growth rates compared with older/unchanged group (4.0±2.3mm/year vs. 1.3±2.5mm/year, p=0.009), while the baseline diameters were similar (4.9±1.1cm vs. 4.5±1.1cm, p=0.44). Two radiologists were in excellent agreement for diameter measurements (ICC=0.99). Sample images of two fast growing AAAs are shown in Figure 4 and 5.Discussion
To our knowledge, this is the first study reporting the ILT composition change over time using high resolution black blood MRI. We found the baseline ILT types did not predict growth, which was different from the results from a previous study2. This disagreement may be attributed to: 1) the use of maximal area change in that study versus diameter change in our study, and 2) follow-up duration of ~6 month versus ~19 month in our study. We observed the ILT types commonly did not change during short term follow up (<2 years). However, when new ILT formated, or the ILT appeared fresher, the growth rate could increase by more than 2 folds. New ILT may result from low/recirculating flow, which can promote outward remodeling. Fresher ILT may indicate active bleeding from vasa vasorum in the inflamed wall. When ILT ages, it tends to be protective, with a very low growth rate possibly indicating a reduced inflammatory burden. One limitation of this study is the lack of histology validation, and previous histology validation is also limited in a small number of cases2. Future histology studies are helpful. The findings of the current study also need to be validated in a large group of patients with a longer follow-up duration.Conclusion
New ILT formation or ILT becoming fresher over time are possibly associated with faster AAA growth. High resolution black blood MRI can monitor ILT compositional changes over time, which may provide new insights into AAA risk assessment.Acknowledgements
No acknowledgement found.References
1. LeFevre ML, Force USPST. Screening for abdominal aortic aneurysm: U.S. Preventive services task force recommendation statement. Ann Intern Med. 2014;161:281-290
2. Nguyen VL, Leiner T, Hellenthal FA, Backes WH, Wishaupt MC, van der Geest RJ, et al. Abdominal aortic aneurysms with high thrombus signal intensity on magnetic resonance imaging are associated with high growth rate. Eur J Vasc Endovasc Surg. 2014;48:676-684
3. Zhu C, Haraldsson H, Faraji F, Owens C, Gasper W, Ahn S, et al. Isotropic 3d black blood mri of abdominal aortic aneurysm wall and intraluminal thrombus. Magn Reson Imaging. 2016;34:18-25
4. Zhu C, Tian B, Leach JR, Liu Q, Lu J, Chen L, et al. Non-contrast 3d black blood mri for abdominal aortic aneurysm surveillance: Comparison with ct angiography. Eur Radiol. 2016
Figures