3337
Hypertrophic Cardiomyopathy: The Potential Value of Tissue-Tracking Strain AnalysisLindsay M Griffin1, Emily L Ferris1, Scott K Nagle1, and Christopher J Francois1
1Radiology, University of Wisconsin, Madison, WI, United States
Synopsis
In hypertrophic cardiomyopathy (HCM), myocardium is disorganized, causing contraction abnormalities, perhaps before wall motion abnormalities are visually apparent. Tissue-tracking, a post-processing technique using routinely-acquired cine images, can assess strain, a multidimensional measure of contraction. We assess strain in 19 HCM cases. Global circumferential strain (GCS) and radial strain (GRS) correlated well (r > -0.85, p < 0.0001) and were worse in those with late gadolinium enhancement (p < 0.05). GCS modestly correlated with segment thickness (r = 0.46, p < 0.05). These data suggest strain may add value as a diagnostic/prognostic tool in assessment of HCM, available without additional imaging time.
Introduction
Left ventricular contraction consists of longitudinal and circumferential shortening, radial thickening, and torsion. Strain can be measured on cardiac MRI (CMR) using tissue tracking, a post-processing technique which uses routinely acquired steady state free precession (SSFP) cine images.1 While inter-vendor variability and lack of normative values complicates true quantification of strain abnormalities, global circumferential strain has been shown to be reproducible2 and an independent predictor of major adverse cardiac events (MACE) in patients with left ventricular ejection fraction >35%.3 In hypertrophic cardiomyopathy (HCM), disordered organization of myocardial fibers, connective tissue, and fibrosis can result in regional subclinical left ventricular dysfunction, as assessed by tissue tracking.4 In this preliminary cross-sectional, retrospective study, we explore correlations between global and regional strain, late gadolinium enhancement (LGE), and wall thickness (WT) in patients with HCM.Method
This retrospective, HIPAA-compliant, IRB-approved study included CMR performed for evaluation of HCM from June 2016 – August 2017. Hypertrophy pattern, maximum WT in diastole, diastolic muscle mass (g), left ventricular end diastolic (LVEDV) and end systolic (LVESV) volumes adjusted for body surface area (BSA), left ventricular ejection fraction (LVEF), presence of late gadolinium enhancement (LGE), and focal wall motion abnormalities (WMA) were recorded. Strain analysis was performed using cmr42 (Circle Cardiovascular Imaging, Inc. Calgary, Canada). Both global (GS) and American Heart Association (AHA) segmental strain (SS) measurements were recorded. Pearson’s correlation assessed the relationship between strain measurements and WT. Two-tailed Student’s T-tests were used to assess differences between groups.Results
36 cases were performed to assess for HCM, and HCM was confirmed in 21 cases. Two cases also had myocardial infarction and were excluded. Of the 19 HCM cases analyzed, twelve patients (63%) were male and the mean age was 55 (14-78) years. HCM pattern was septal (N=13), concentric (N=3), apical (N=2), and other (N=1). The median maximum WT in diastole was 21 mm (range 16-32 mm) and the median diastolic mass was 163 g (range 114-364 g). LVEF was normal in all subjects (mean 66%, 55-82%). Indexed LVEDV and LVESV were normal to decreased (LVEDV median 73 mL/m2, range 46-163 mL/m2; LVSEV median 24 mL/m2, 12-60mL/m2). LGE was identified in 74% (14 patients) and focal WMA in 74% (14 patients), with LGE and focal WMA in 10 patients. GS measurements are summarized in Table 1. Radial and circumferential strain were closely associated for both 2D and 3D measurements (Figure 2). 3D longitudinal strain did not correlate with any other GS measures. GS was decreased in patients with LGE (3D circumferential strain: LGE -14% (confidence interval (CI) -16 - -11%) versus no LGE -20% (CI -23 - -18%) p < 0.01; 3D radial strain: LGE 22% (CI 16 – 28%) versus no LGE 36% (CI 27 – 46%) p < 0.05) (Figure 3). For SS analysis, segmental circumferential strain moderately correlated with segment WT (r = 0.46, p < 0.05) (Figure 4).Discussion
In this preliminary study of patients with HCM, global circumferential and global radial strain were closely associated, with wide variability in longitudinal strain. Radial and circumferential GS measurements were worse in those with LGE, suggesting strain measures may be able to predict areas with fibrosis in HCM. As tissue tracking technology and normative data become more robust, prospective study of strain in HCM may provide additional prognostic information in natural disease course and treatment response.Acknowledgements
No acknowledgement found.References
- Scatteia A, Baritussio A, Bucciarelli-Ducci C. Strain imaging using cardiac magnetic resonance. Heart Fail Rev 2017;22:465-476.
- Shuster A. Cardiovascular magnetic resonance feature-tracking assessment of myocardial mechanics: Intervendor agreement and considerations regarding reproducibility. Clin Radiol 2015; 70(9):989-98.
- Ify M, Bezerra H, Crrick D, Tzemos N. Value of LVEF, Late Gadolinium Enhancement, and Global Circumferential Strain Assessed by CMR. J Am Coll Cardiol Img 2015;8:540-9.
- Xu H et al. Early Marker of Regional Left Ventricular Deformation in Patients with Hypertrophic Cardiomyopathy Evaluation by MRI Tissue Tracking: The Effects of Myocardial Hypertrophy and Fibrosis. J Magn Reson Imaging 2017; Ahead of print 29 Mar 2017.
Figures
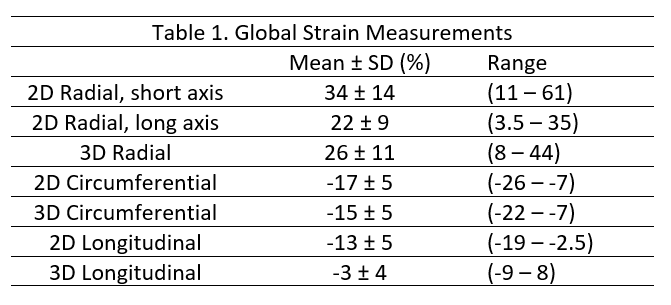
Table of global radial, circumferential, and longitudinal strain, measured in two and three dimensions (2D and 3D). As there is shortening in the circumferential and longitudinal dimensions, these are negative percentages. In the radial dimension, there is thickening, hence a positive percentage.
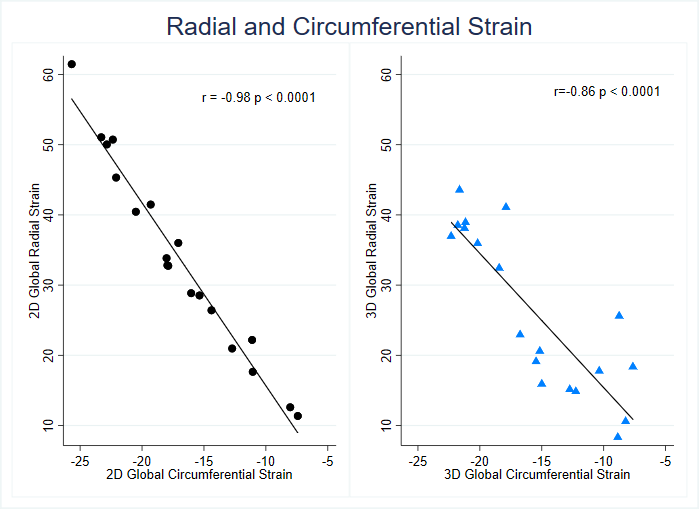
Scatter plot and linear fit showing close correlation of
2D and 3D global radial and circumferential strain values.
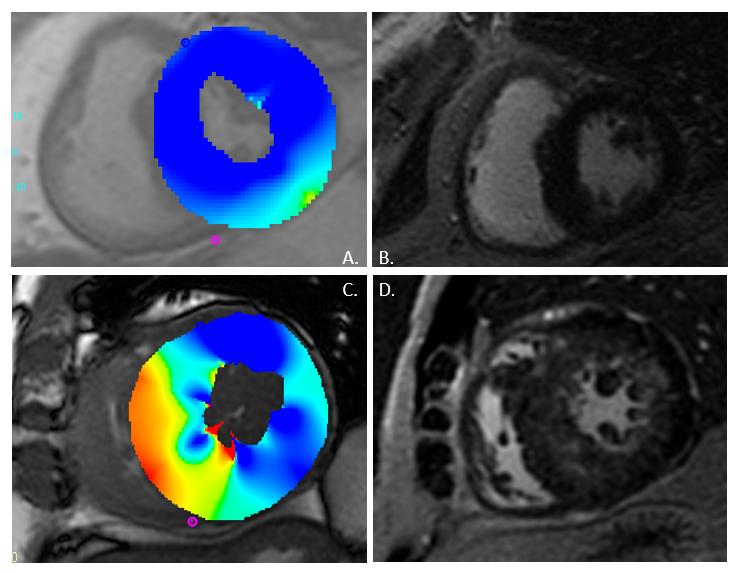
2D circumferential
strain at the site of maximal wall thickness. Top row: Case without late
gadolinium enhancement (LGE). Image A: The circumferential strain map shows relatively
normal and uniform 2D circumferential strain (blue). Image B: Post contrast
image shows normally nulled myocardium and no LGE. Bottom row: Case with LGE.
Image C: The circumferential strain map shows decreased strain in the septal
and inferoseptal segments (yellow-red). Image D: Post contrast image shows patchy,
diffuse midmyocardial LGE affecting all segments on the slice.
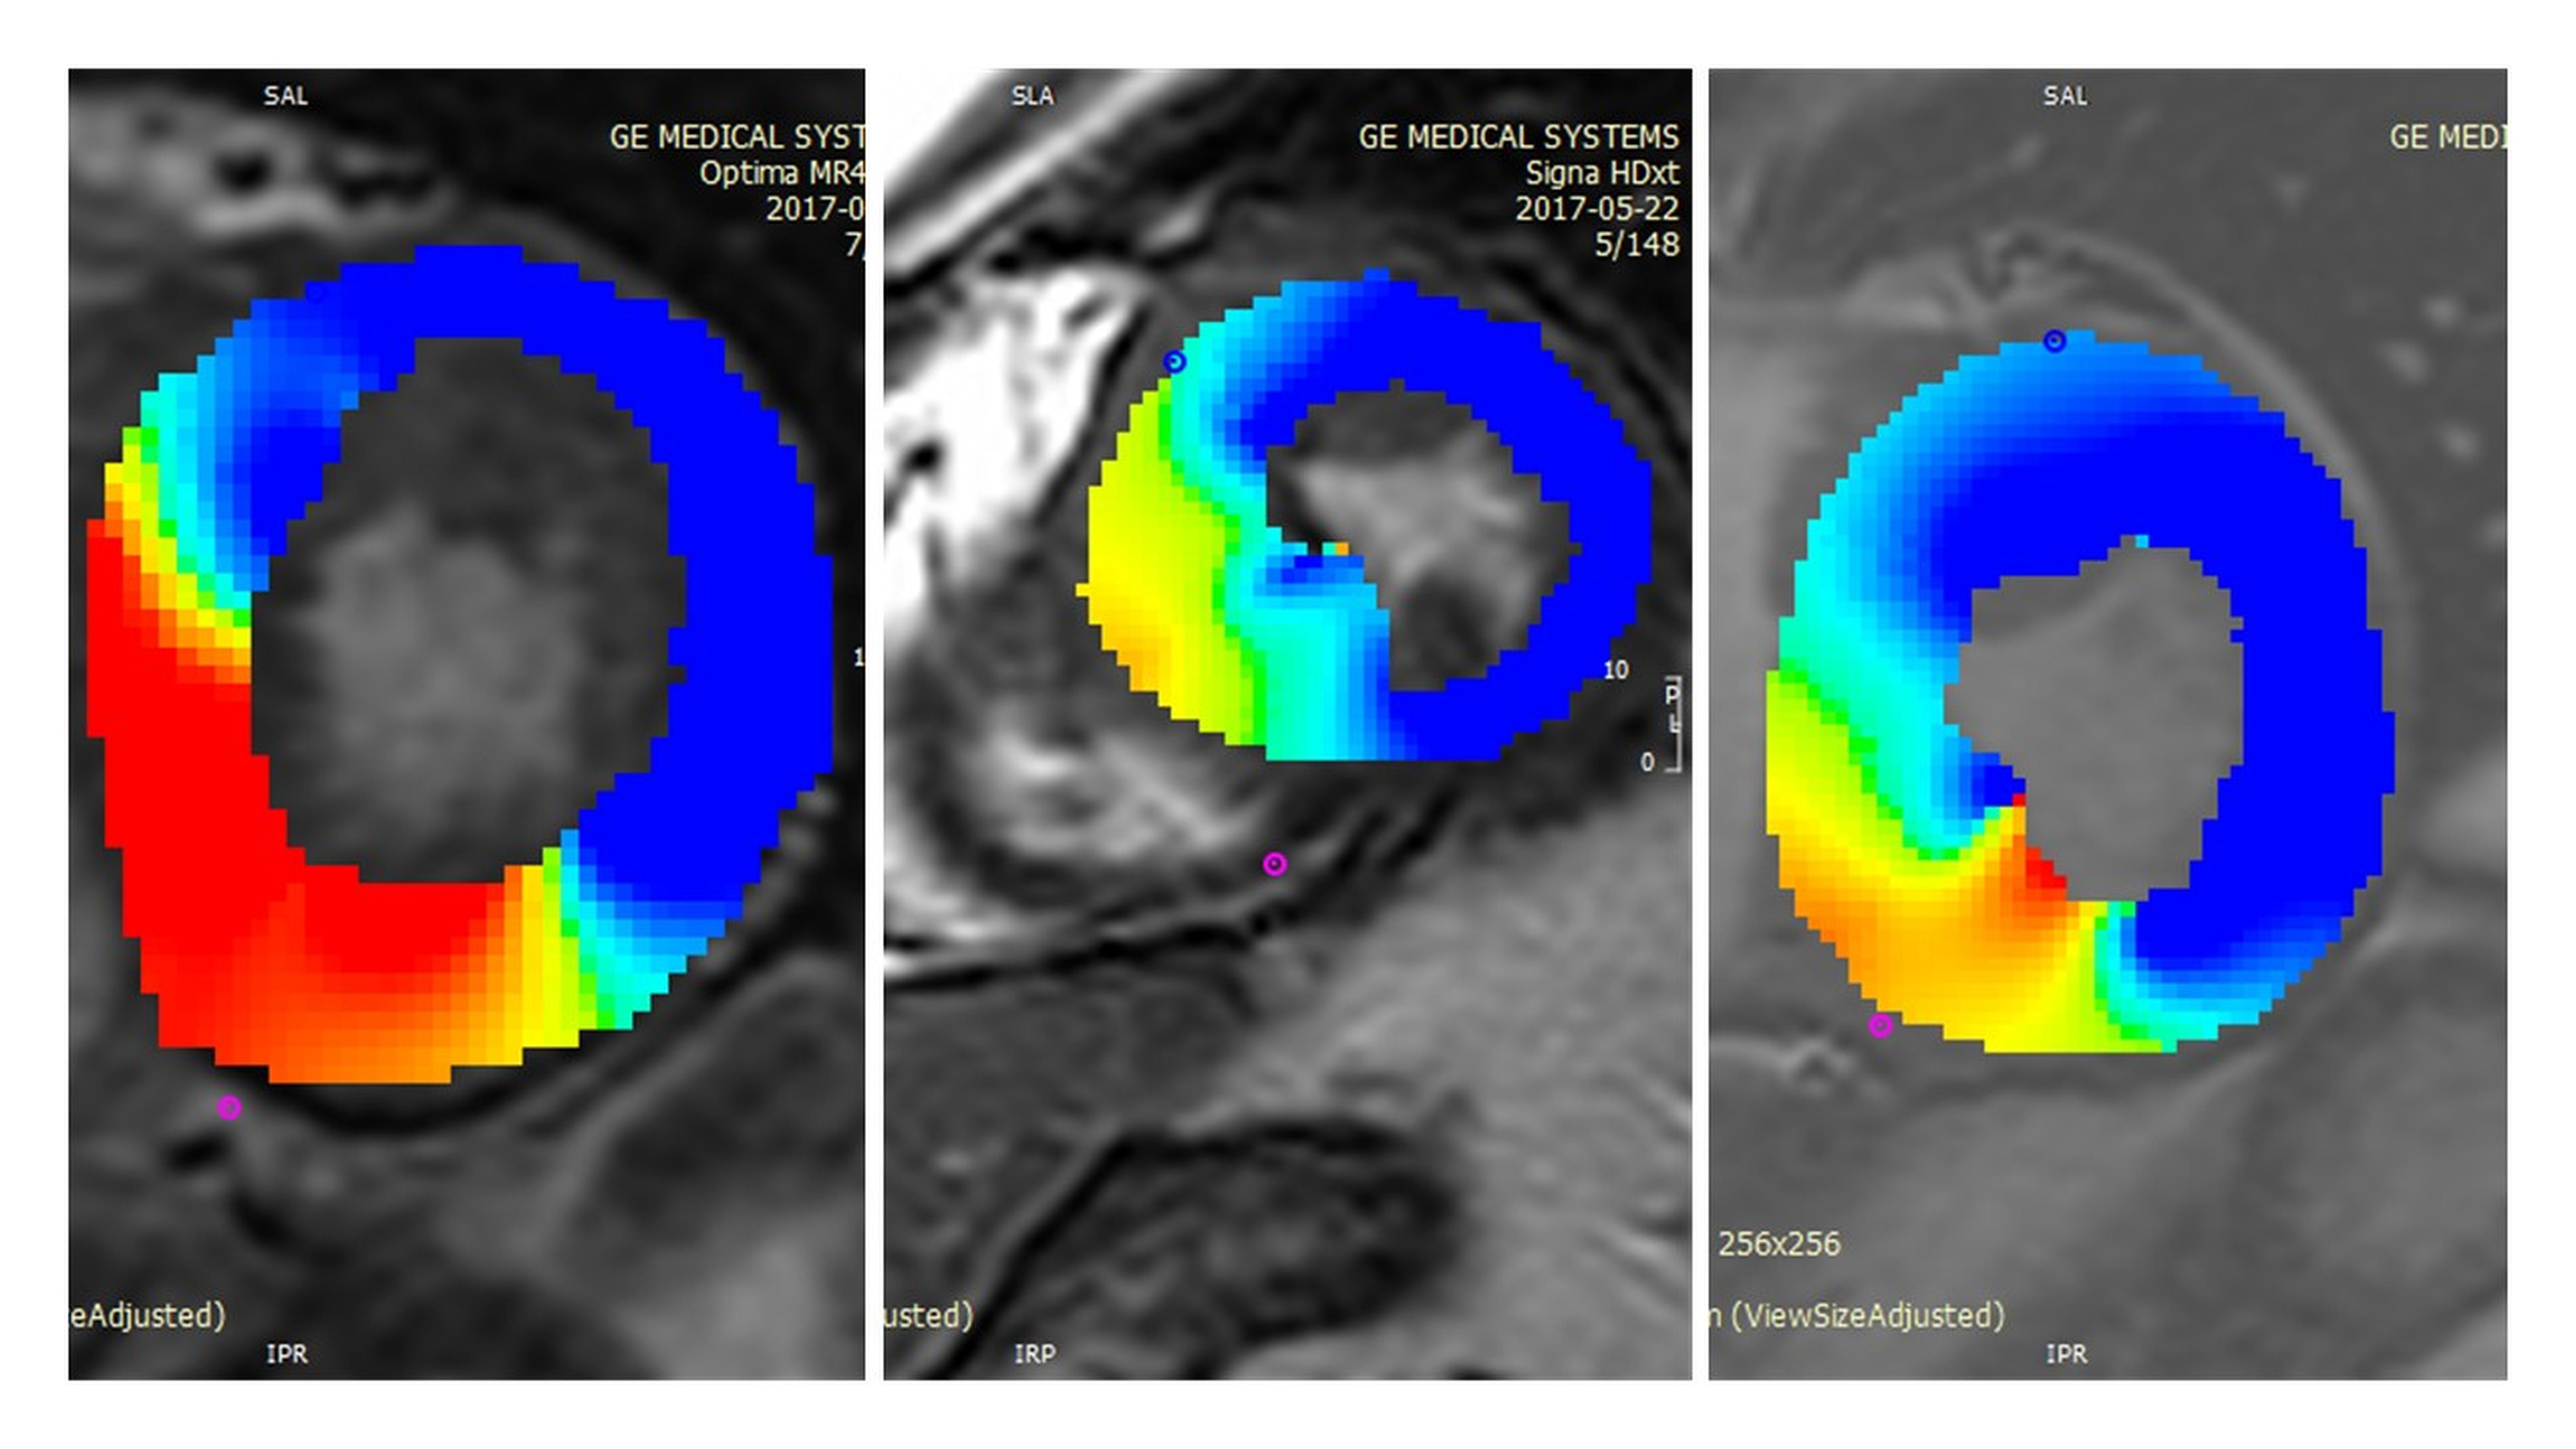
Circumferential
strain map at site of thickest AHA segment (mid septal and inferoseptal
segments) showing decreased circumferential strain (yellow/red) in comparison with
other AHA segments on the same slice (blue).