3329
Fully automated spatio-temporal segmentation approach for myocardium ischemic lesions detection and tissue classification1Univ Lyon, INSA‐Lyon, Université Claude Bernard Lyon 1, UJM-Saint Etienne, CNRS, Inserm, CREATIS UMR 5220, U1206, F-69621, Villeurbanne, France, Villeurbanne, France, 2Siemens Medical Solutions USA, Inc. Boston, USA., Boston, MA, United States, 3Univ Lyon, INSA‐Lyon, UJM-Saint Etienne, Université Claude Bernard Lyon 1,CNRS, Inserm, CREATIS UMR 5220, U1206, F-42023, SAINT-ETIENNE, France, Saint-Etienne, France
Synopsis
CMR Perfusion Imaging proved its role in patient triage, identifying visually ischemia and its capability in quantifying heart perfusion1,2, but failed to transfer this technology to clinical routine and to show how this worth information could be used to improve tissue lesions comprehension. Deconvolution techniques are sensitive to noise present on time intensity curves S(t), when observation scale decreases. Automated segmentation prior modelling would be a powerful adjunct. Indeed, prior tissue classification would optimize perfusion quantification accuracy since enabling advanced modelling leading to additional markers while reducing processing time. Such automated method is proposed here.
Introduction
MR contrast enhanced Myocardial Perfusion Imaging (ceMPI) has already proven its capability for providing insight into microcirculation in the myocardial tissue. It also gives crucial information on myocardial angiogenesis, and how coronary flow is reduced which could affect the myocardial tissue. Numerous studies1,2 proved possibility to quantify perfusion from Perfusion Weighted (PW) Image series. However, at voxel observation scale low SNR prevents accurate and time-efficient modelling leading to precise quantitative index characterizing perfusion and tissue. Various techniques have been proposed to improve SNR like regional averaging segmental analysis (AHA-segmentation)3 but this technique does not consider the lesion shape. Recently, Ismail proposed4 to locally cluster voxels having similar perfusion indexes taking account of suffering territory shape though the segmentation is carried out a posteriori of the quantification. We propose a new method based on spatio-temporal region growing to cluster neighboring myocardium’s voxels with similar tissue characteristics based on temporal signal behavior wisely conditioned by personalized features.Method
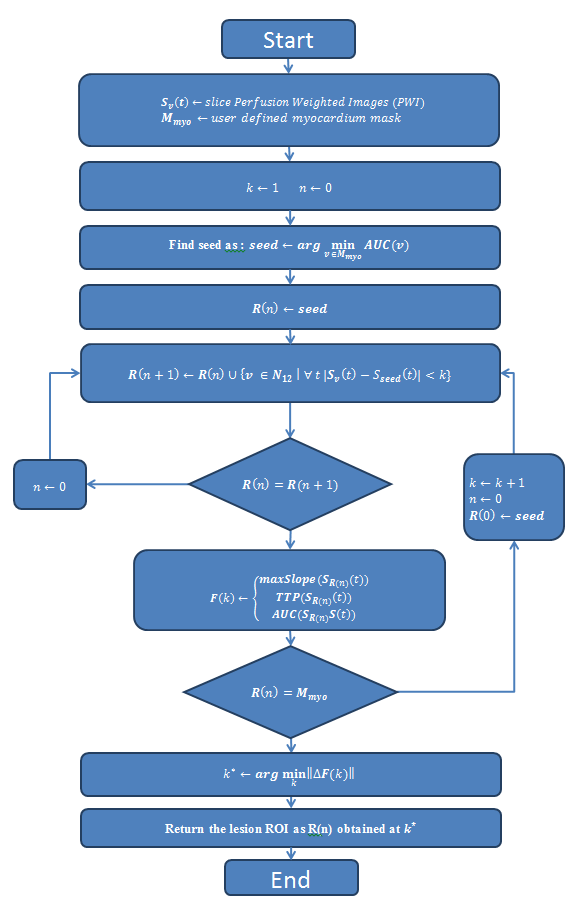
The study involved 20 patients referred for ischemia (stress MRI). PW-Images were acquired on clinical 3T MR-Siemens Prisma scanner with dual-delay saturation-recovery TurboFlash sequence5 .Registered PW-Images were manually segmented by a clinician to identify myocardium and restrict region prior automated lesion segmentation. Expert was requested to plot suffering and remote areas, restricted with absolute certainty.Automated lesion segmentation was carried out on voxels within the user-defined myocardium mask with a region-growing based algorithm. This latter, specifically designed for heart perfusion, considers spatial and temporal aspects and is described Figure1.Automated optimization of threshold k for the Spatio-temporal region growing algorithm that defines a lesion region R(k), was based on personalized behavior of calculated quantitative features F(k): time-to-peak TTP(k)), area under the curve AUC(k) and maximum slope maxSlope(k) of R(k) average time curve SR(k)(t). Norm of features difference ||ΔF(k)|| was calculated as shown in equation(1) by caring fo reducing features to relative values ranging from 0 to 1, balancing each feature influence as their dynamics are very different.
$$ \parallel\triangle F(k)\parallel = \left[ \left(\triangle AUC(k)\right)^{2} + \left(\triangle TTP(k)\right)^{2} + \left(\triangle maxSlope(k)\right)^{2}\right] ^{\frac{1}{2}}$$
Optimal value k* for lesion segmentation was set as the one maximizing ||ΔF(k)||, meaning the shape of Sk(t)k>k* are too different from Sseed(t) to be considered as in the region. The lesion area R(k*) was submitted to experts for visual control and correction by manually adding or removing pixels to automated segmentation and scores of under/oversegmentation were calculated for comparison with inter-experts segmentation differences.
Results
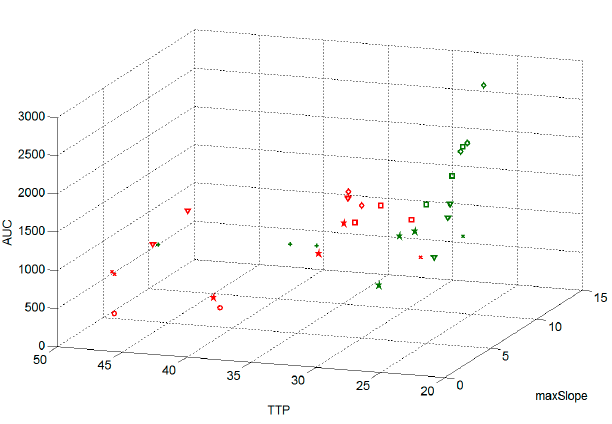
Fig2
shows ROI average S(t) features defined by clinician plotted in feature
space. Healthy tissues had generally lower TTP values, greater AUC and maximum
slope, showing there is no unique k value that could separate the different tissue classes with a single
threshold value.
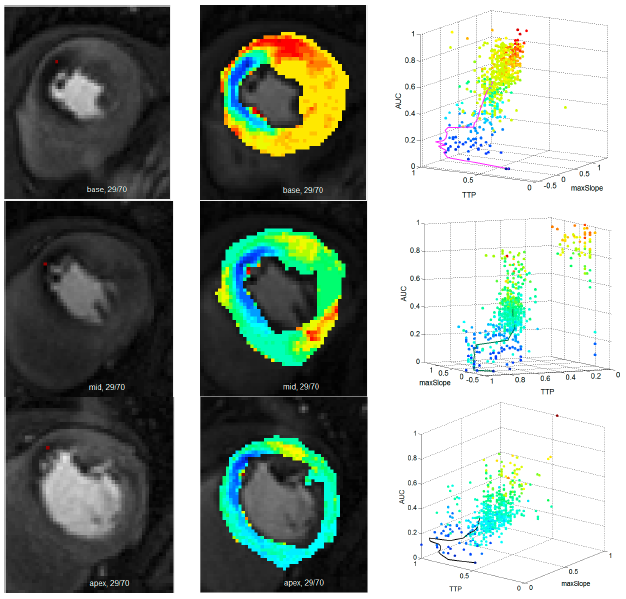
Fig3
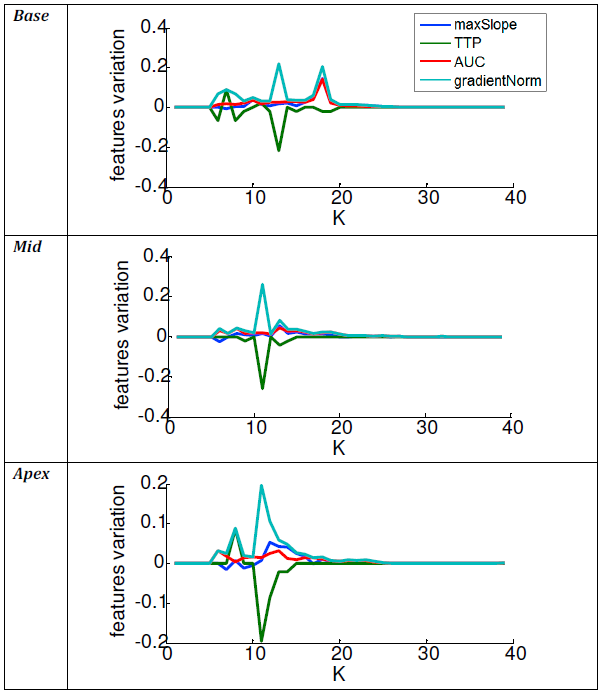
shows the ROI growth against k until including the total myocardium. In each dataset, we observed that
||ΔF(k)|| as
shown in Ffigure4,
was a marker enabling to determine k*
to accurately cover the lesion area (see Fig5).
For all
datasets included in the study, the segmented lesion location and size were
considered optimal after the confrontation of experts’ corrections considering
the low score of under/oversegmentation (1%)<<inter-individual
differences(2%).Discussion
Signal intensities and shapes variability between patients, either in suffering or healthy tissues, requires adaptive solution to accurately unravel lesion voxels from healthy ones. We observed that not only one feature can be considered to address this issue. Using a region growing based algorithm that takes in account shape and features of SROI(t), enables an accurate segmentation. Combinations of appropriate SROI(t) features enabled to emphasize gradient ||ΔF(k)|| peaks, highlighting threshold leading to an precise segmentation. As we can observe Fig4, several gradient peaks were observed (apex and base). We chose to use k* given by maximum peak value, because objective was to locate tissue lesion and cluster abnormal tissue with maximum accuracy. However, these peaks characterizing differences of tissue behaviors within the lesion are full of interest for heart diseases comprehension. These preliminary results, are promising and shall be confirmed on a larger dataset. Variance of k values could also be explored to define finer classes of tissues like lesion border zone or grade within normal tissue.Conclusion
This study proposes an automated segmentation of lesions method based on spatial boundaries of the core and temporal key features of the signal time curves. Automated classification of tissue could be crucial key tools for clinical decision in perfusion analysis, prediction by understanding factors that influence the classified tissue evolution and/or improve performances of advanced and SNR sensitive complex modeling of the affected myocardial tissue thus increasing accuracy/reproducibility of derived perfusion index estimation.Acknowledgements
We want to thank Labex Primes for financial supportReferences
1. Lee D, Johnson N. Quantification of Absolute Myocardial Blood Flow by Magnetic Resonance Perfusion Imaging, JACC : Cardiovascular imaging .2, n° 6 , 2009
2. Engblom H, Xue H, Akil S, et al. Fully quantitative cardiovascular magnetic resonance myocardial perfusion ready for clinical use: a comparison between cardiovascular magnetic resonance imaging and positron emission tomography Journal of Cardiovascular Magnetic Resonance (2017) 19:78
3. Cerqueira M, Weissman N, Dilsizian V, et al. Standardized myocardial segmentation and nomenclature for tomographic imaging of the heart: A statement for healthcare professionals from the Cardiac Imaging Committee of the Council on Clinical Cardiology of the American Heart Association, Circulation, vol. 105, no. 4, pp. 539–542, 2002.
4. Ismail T, Hsu L, Greve A, et al. Coronary microvascular ischemia in hypertrophic cardiomyopathy - a pixel-wise quantitative cardiovascular magnetic resonance perfusion study. Journal of Cardiovascular Magnetic Resonance; 2014
5. Gatehouse P, Elkington A, Ablitt N et al. Accurate Assessment of the Arterial Input Function during High-Dose Myocardial Perfusion Cardiovascular Magnetic Resonance. . Journal of Cardiovascular Magnetic Resonance Imaging 2004;20:39-45
6. Contin L, Beer C, Bynevelt H, et al. Semi-automatic segmentation of core and penumbra regions in acute ischemic stroke : preliminary results. 17th International Conference on Systems, Signals and Image Processing; 2010
Figures