3327
Dynamic contrast-enhanced and phase contrast MRI of a novel 3D printed cardiac phantom mimicking transmural myocardial perfusion gradients1School of Biomedical Engineering and Imaging Sciences, King's College London, London, United Kingdom, 2ZMT Zurich MedTech AG, Zurich, Switzerland, 3Laboratory for Aero- and Hydrodynamics, Technische Universiteit Delft, Delft, Netherlands, 4VSL B.V., Delft, Netherlands, 5Physikalisch-Technische Bundesanstalt, Berlin, Germany
Synopsis
In recognition of the lack of a physical standard for the assessment and validation of myocardial perfusion imaging methodologies, a phantom simulating first-pass perfusion has recently been developed. This study builds on this work by introducing a novel 3D printed myocardial compartment with a radial variation in flow that mimics physiological transmural perfusion gradients. Velocity and perfusion rate estimates using phase contrast and dynamic contrast-enhanced MRI of the myocardium, respectively, were found to be repeatable. The myocardium shows potential in multi-modality evaluation and validation of perfusion pulse sequences and quantification algorithms before their introduction into routine clinical use.
Introduction
Cardiovascular first-pass perfusion MRI is recommended for ischemia testing in international clinical guidelines in patients with suspected coronary artery disease. However, a variety of relevant pulse sequences and quantification algorithms have been proposed, the accuracy and reproducibility of which has not been systematically evaluated due to the lack of a clearly defined gold standard. In response to this deficiency, a cardiac phantom with myocardial tissue compartments has recently been developed.1 The phantom can generate dynamic signal enhancement curves in a highly controlled fashion, but the myocardium has a limited usage as it does not realistically mimic the physiological diversity in capillary size and the transmural (radial) variation in perfusion from endocardial to epicardial layers which is typically observed in vivo. As part of a large European project (EMPIR 15HLT05), a novel multi-capillary 3D-printed myocardium capable of generating signal enhancement curves dependent on the transmural location has been developed. The performance of the myocardium was assessed by dynamic contrast-enhanced (DCE) and phase contrast (PC) MRI experiments.Methods
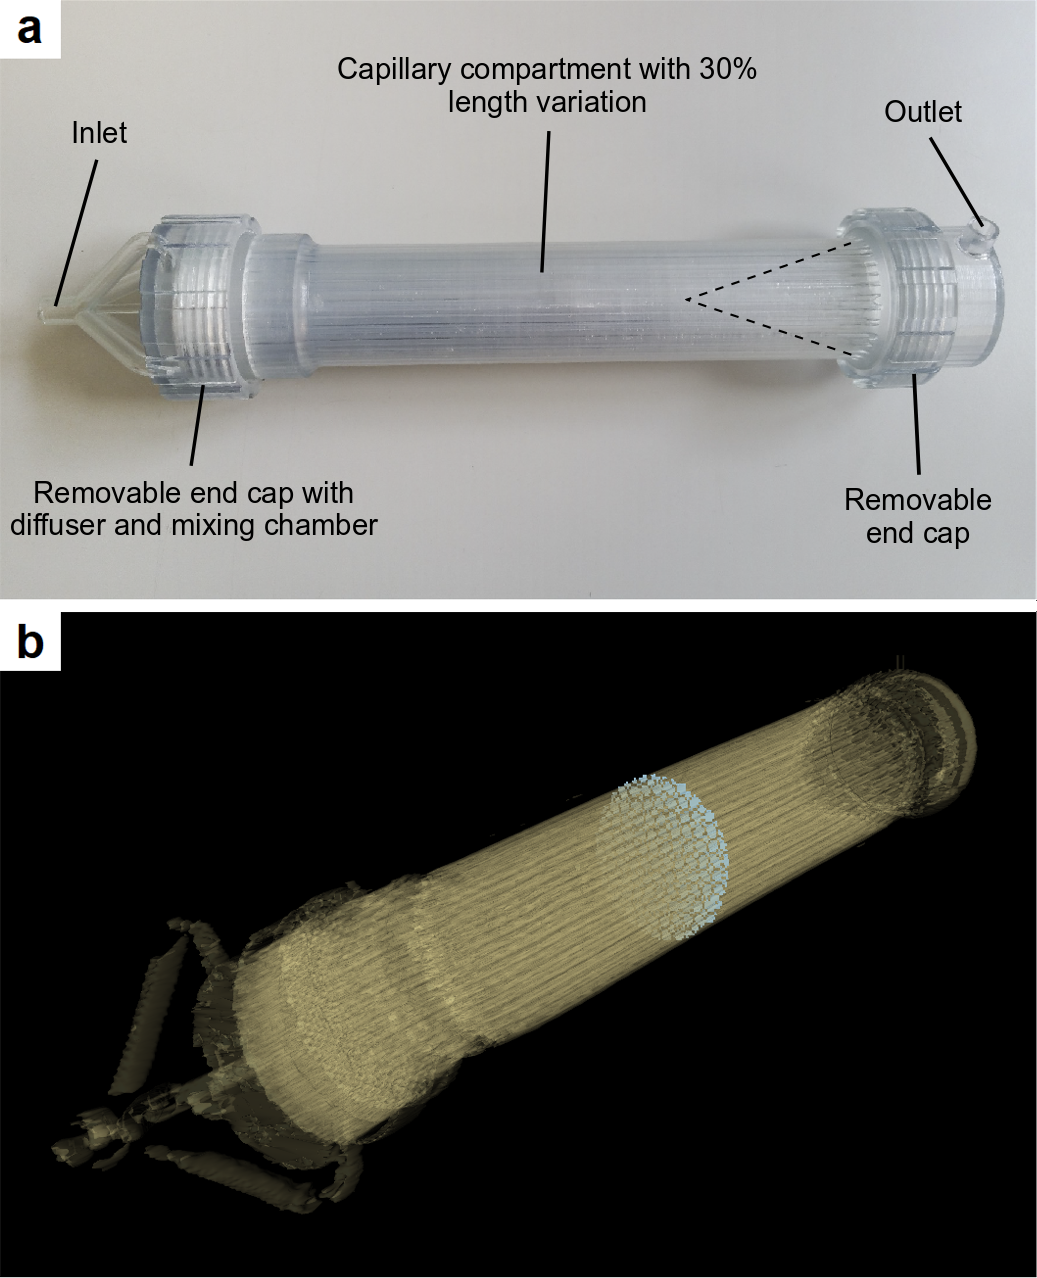
The design of the myocardium was optimized using computational fluid dynamics. It consists of a four-point oblique inlet that directs water into a cylindrical system of capillaries with five different cross-sectional areas (Figure 1). The capillaries have a 30% length difference from the center to the periphery to simulate perfusion with a transmural variation of similar extent, as observed in a typical human myocardium. The myocardium was printed with MR-compatible thermoplastic compound using a high-precision 3D printer. It was then used in conjunction with a previously developed phantom consisting of ultrasonic Atrato flow meters (Titan Enterprises, Sherborne, UK) that provide ground truth flow rates across the myocardium; a detailed description of the phantom and its use can be found elsewhere.1 The flow rates were converted to mean velocity and perfusion rates. The myocardium was scanned twice for a fixed cardiac output (3 L/min) and each of five different perfusion rates (1-5 mL/g/min) with a 3T Philips Achieva scanner equipped with a 32-channel cardiac phased array surface coil (Philips Healthcare, Best, Netherlands). A standard clinical perfusion imaging protocol was used for DCE-MRI. This involved a dual-bolus injection scheme (1:10 pre- to main bolus concentration of Gadovist®, 2 minutes delay between boluses) and ECG-triggered imaging with a turbo field echo (TFE) sequence (TR = 162.7 ms, TE = 0.99 ms, TI = 100 ms, 10° flip angle, 1 average, 192×144 matrix, 1.875×1.875 mm2 resolution, 10 mm slice thickness). Additionally, high-resolution 2D gradient echo PC-MRI was performed at the same axial slice as DCE-MRI (VENC = 5-10 cm/s, TR = 10.4-11.8 ms, TE = 5.9-7.3 ms, 10° flip angle, 4 averages, 512×512 matrix, 0.39×0.39 mm2 resolution, 5 mm slice thickness). Data were analyzed using MATLAB routines developed in-house. DCE-MRI scans were quantified using optimized Fermi model-based deconvolution,2,3 in a global and a voxel-wise fashion to obtain mean perfusion rates and perfusion maps respectively. PC-MRI scans were analyzed to generate velocity maps, from which the mean velocity was estimated. Both measures were compared with the ground truth.Results & Discussion
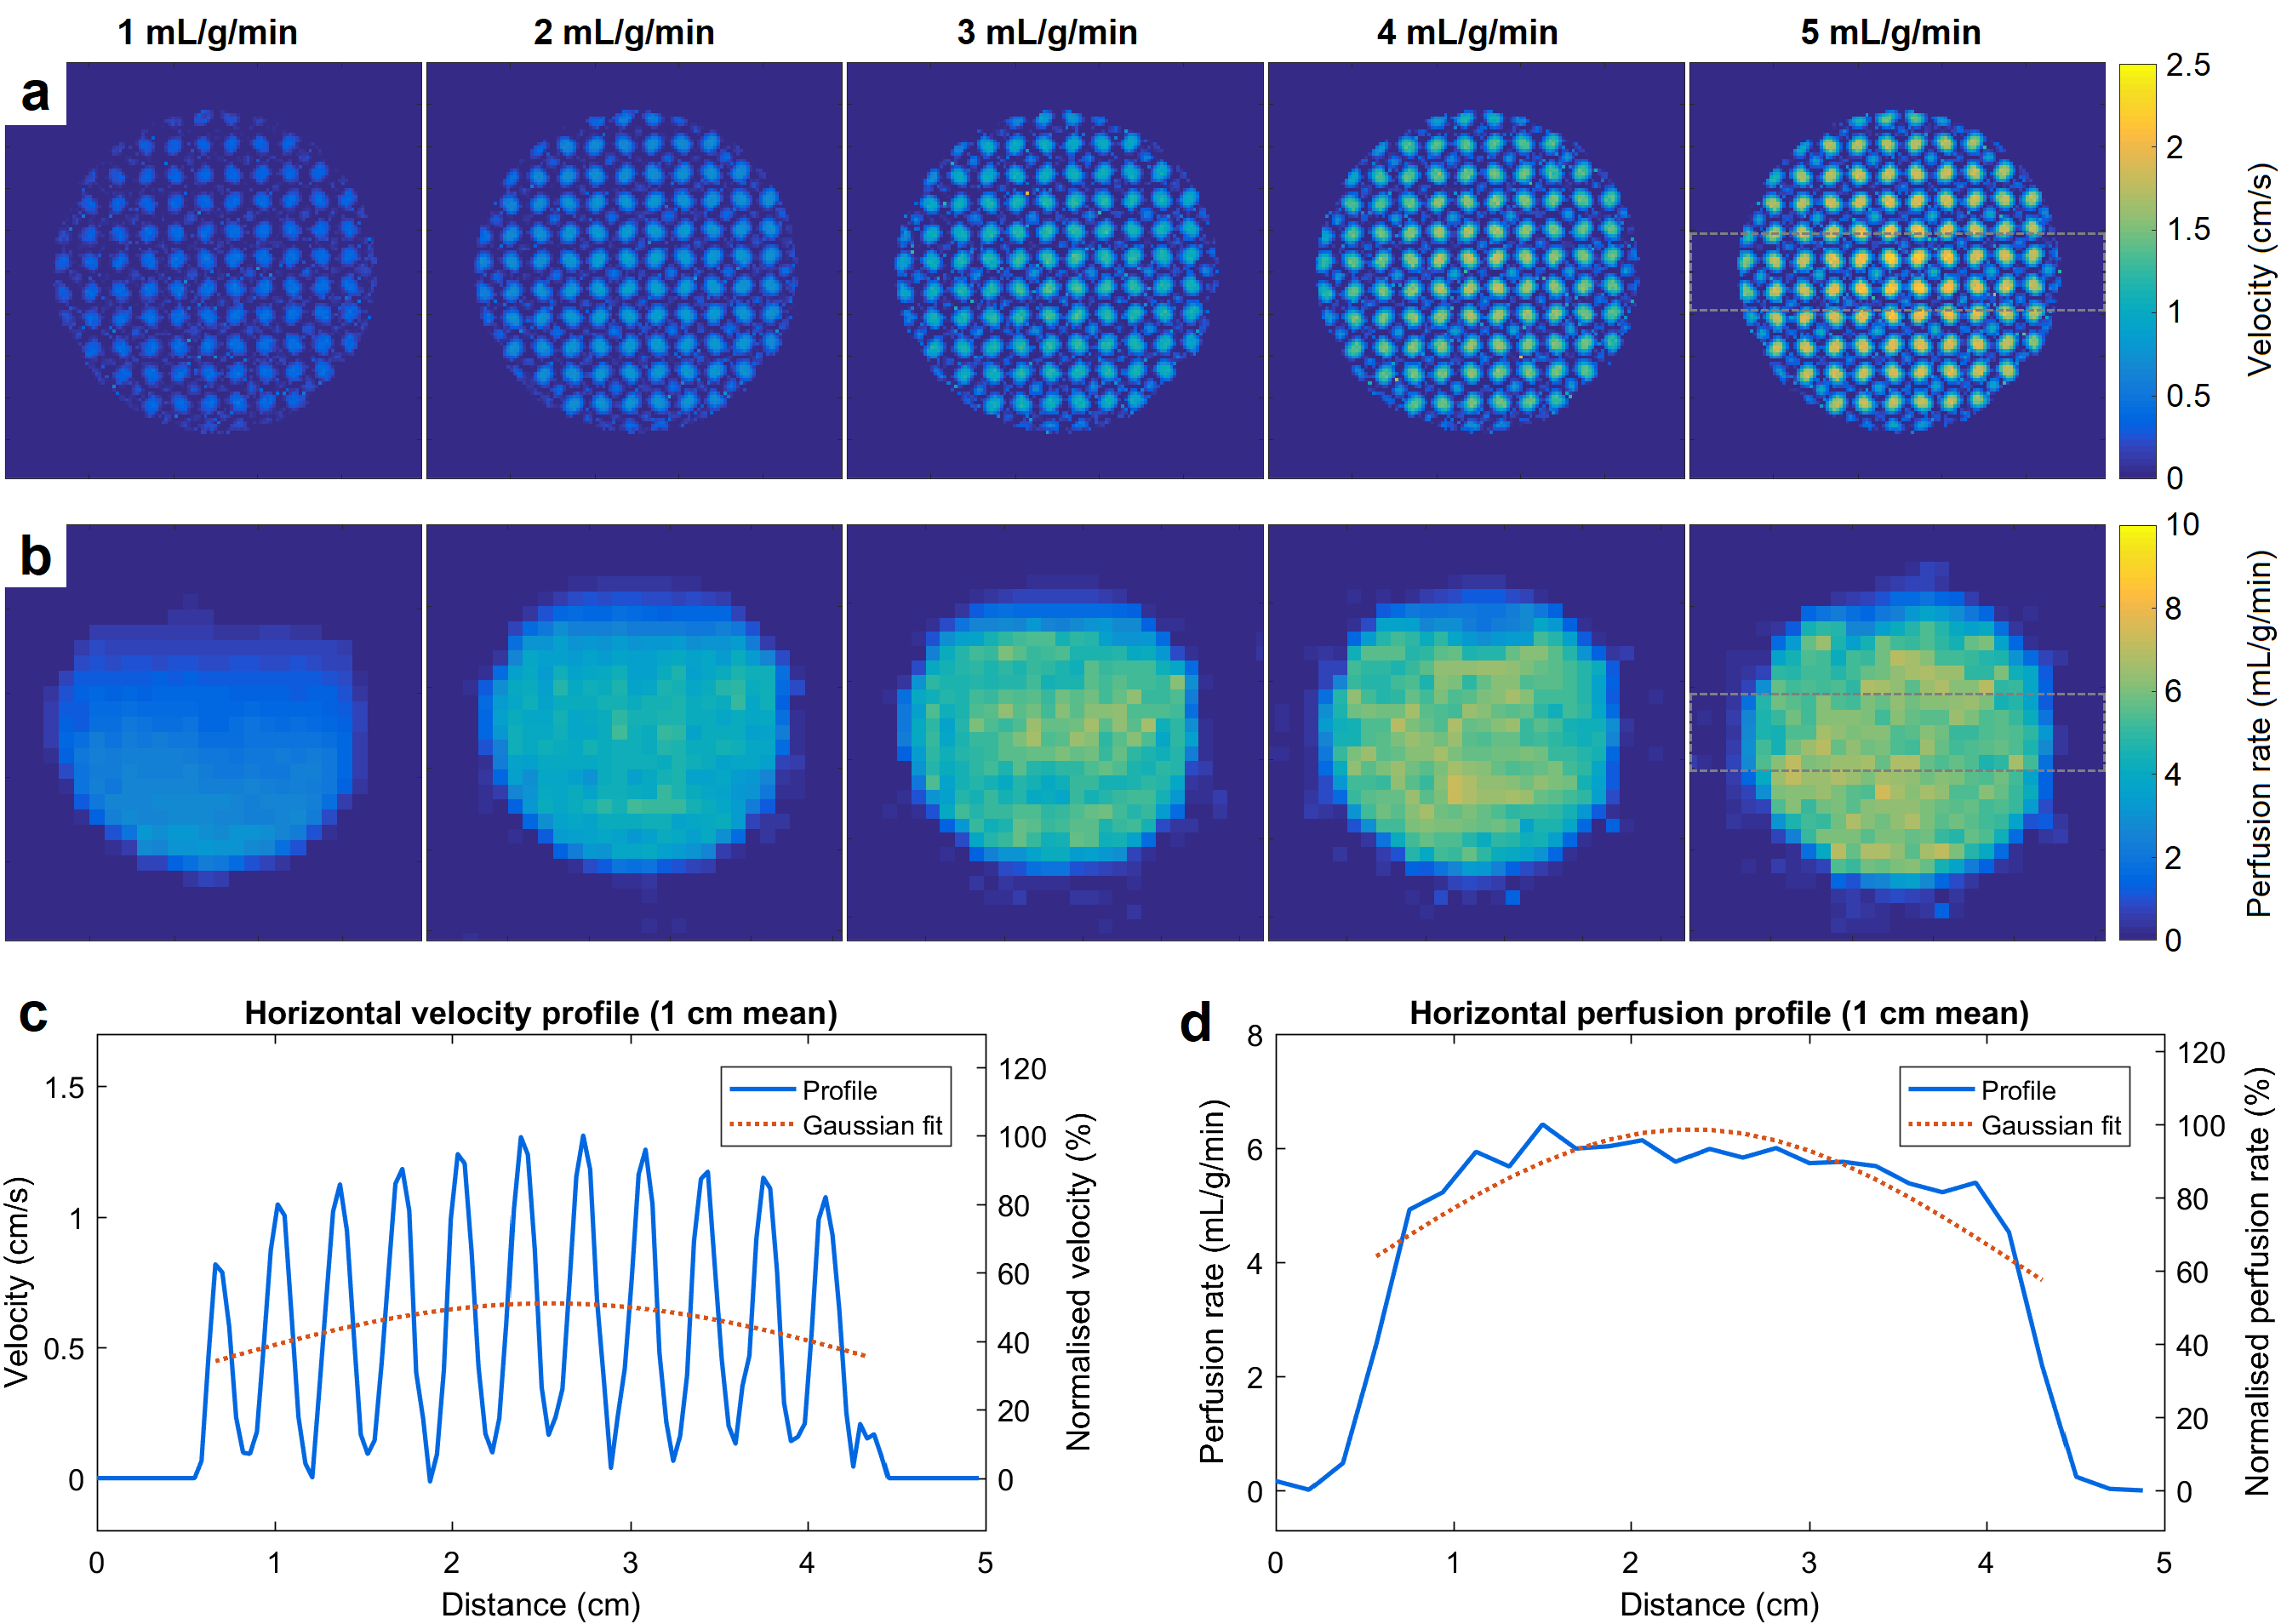
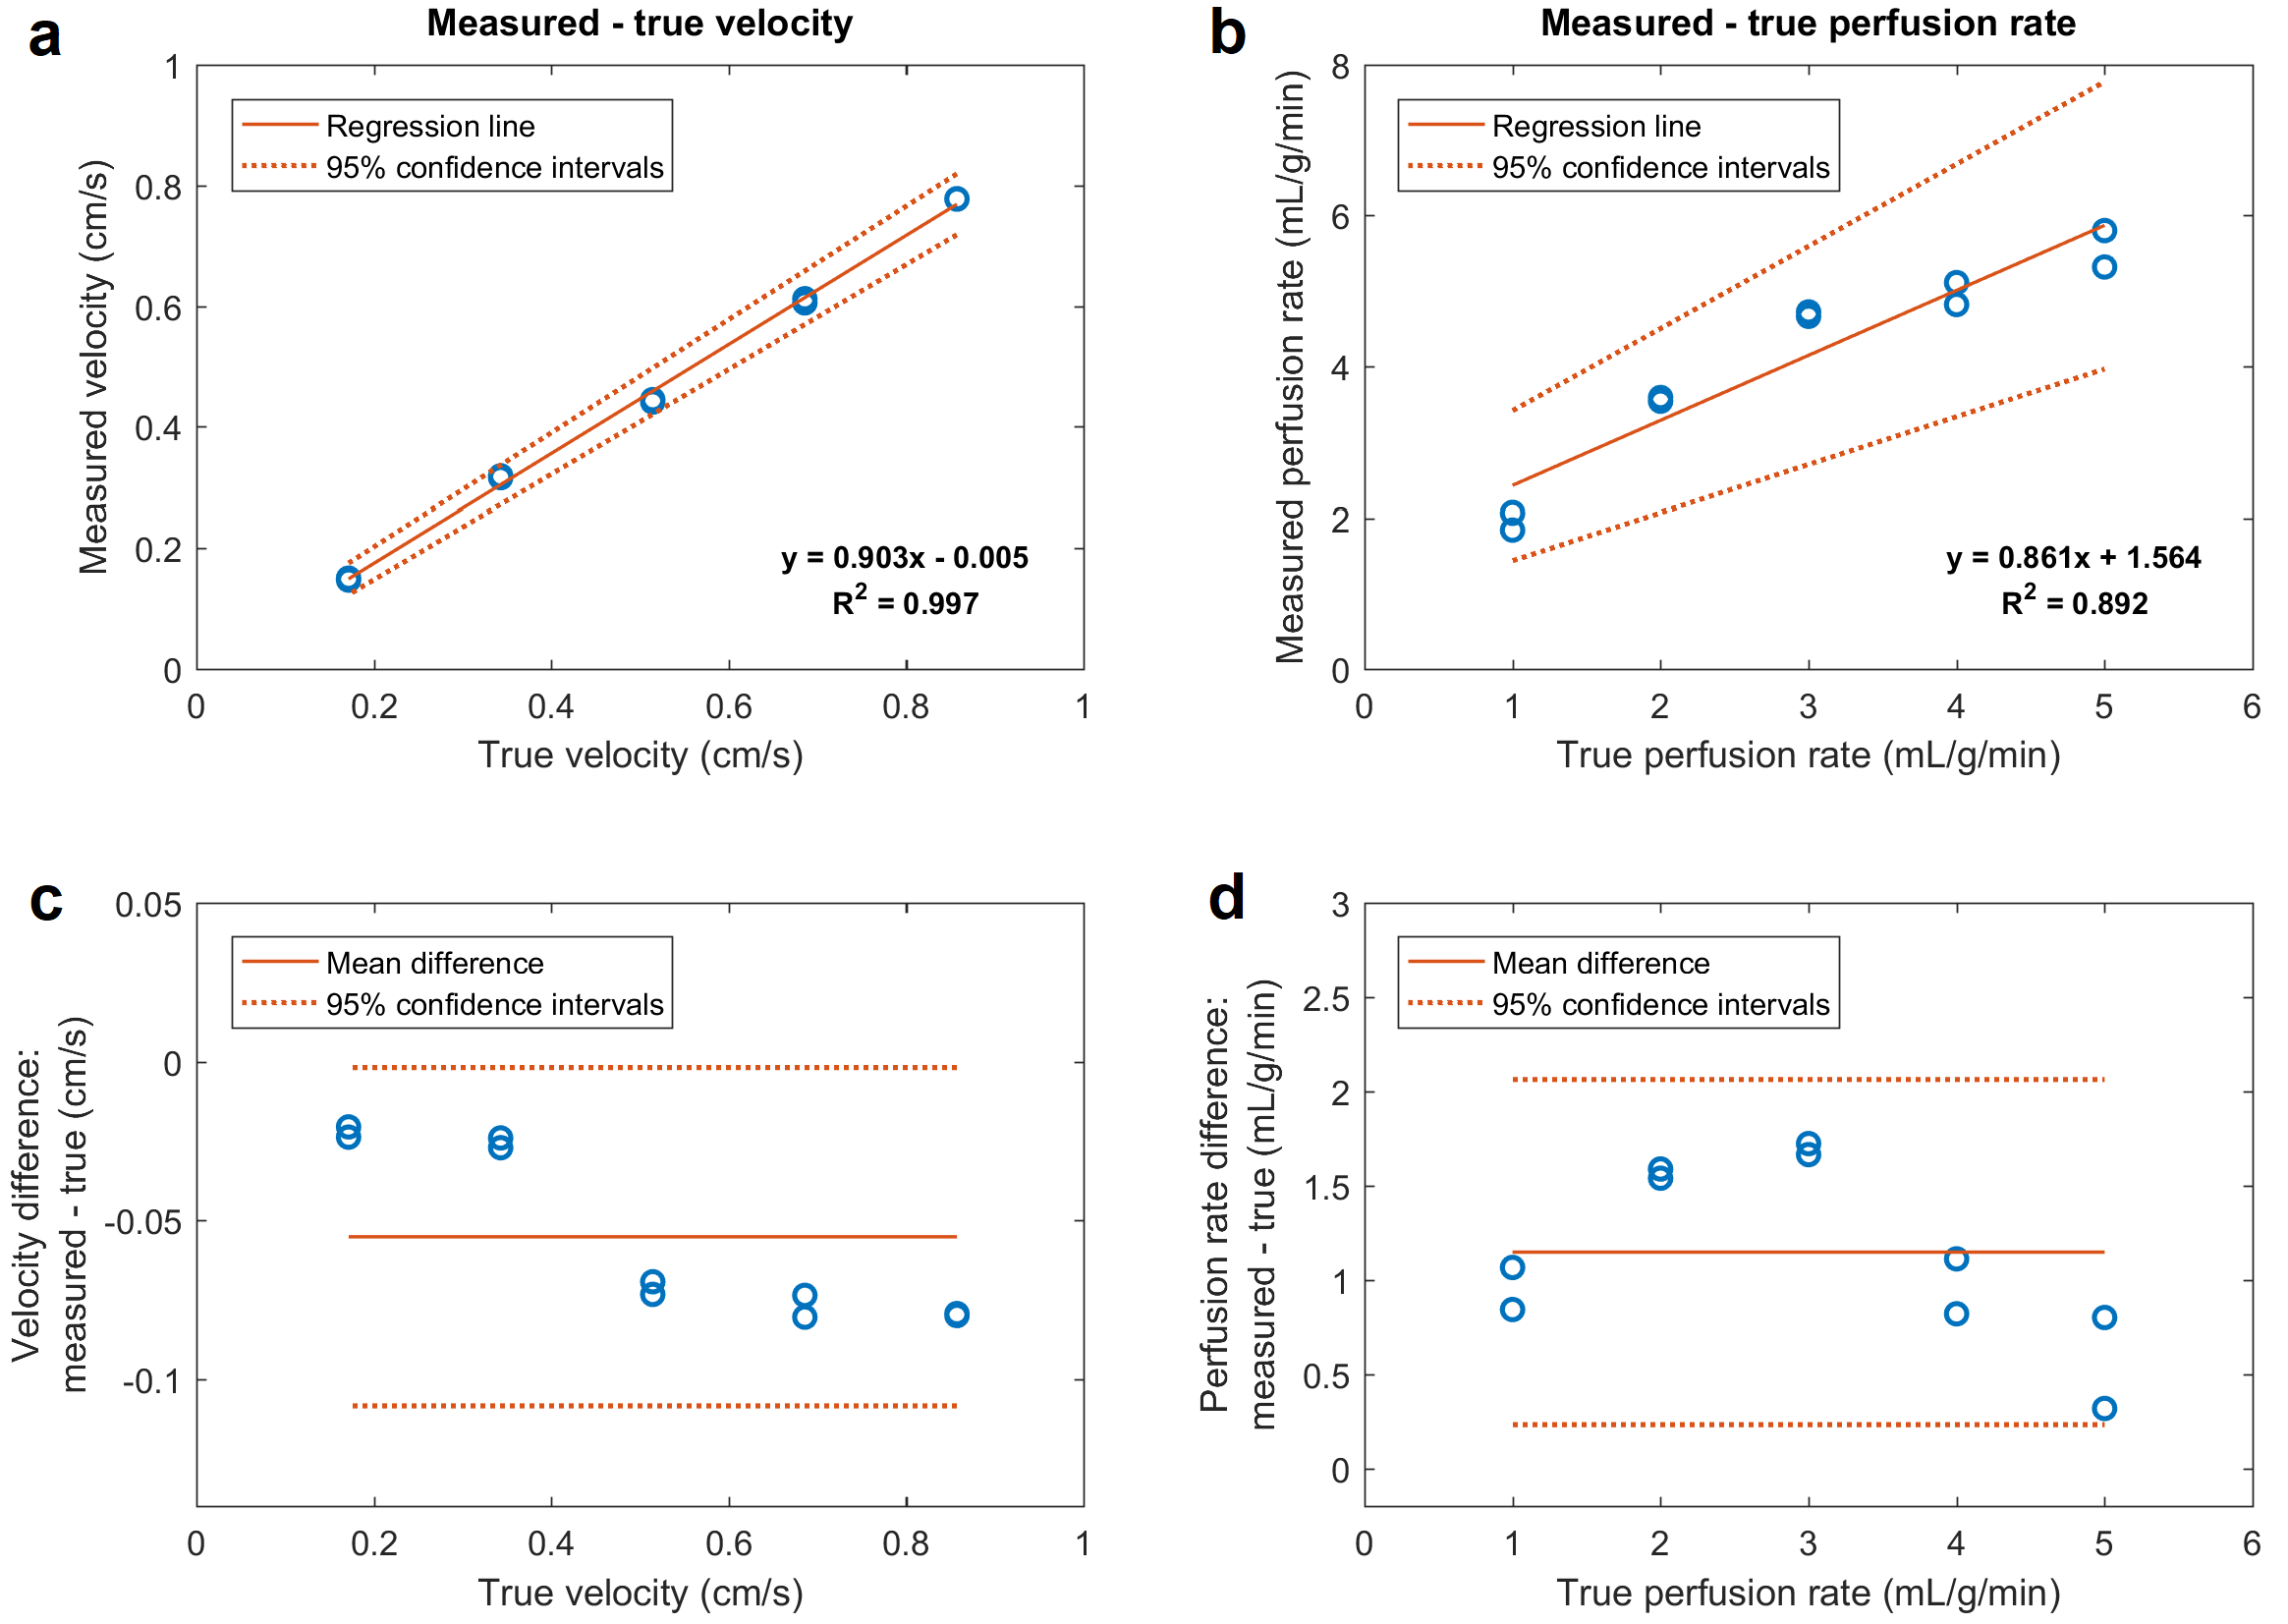
Figure 2 shows example velocity and perfusion rate maps for all tested flow rates, as well as horizontal profiles across the myocardium. The capillary length difference leads to a higher flow in the center of the myocardium compared to the periphery, as seen in velocity maps. This causes a faster perfusion of the contrast agent through the center and generates a transmural gradient in perfusion rate (20-35% variation). Figure 3 compares the estimated mean velocity and perfusion rates with corresponding true values. A strong linear correlation for velocity (R2 = 0.997) and perfusion rate (R2 = 0.892) was found, despite a trend towards underestimation of values and an apparent deviation from linearity in perfusion rate. In repeated scans, the velocity difference was very small while the perfusion rate difference varied more arbitrarily. A potential source of error in perfusion quantification is the low in-plane resolution of the scans and the associated partial volume effects. Using the phantom as the gold standard, both imaging techniques can be optimized to improve their accuracy and reproducibility.Conclusion
A novel 3D printed myocardial compartment that simulates transmural myocardial perfusion gradients over the full physiological perfusion range is presented. The myocardium can be used with a previously developed cardiac phantom efficiently, for evaluating and validating perfusion pulse sequences and quantification algorithms before their introduction into routine clinical use. It is also compatible with all other medical imaging modalities4,5, therefore future experiments will focus on multi-modality assessment of cardiac perfusion imaging.Acknowledgements
This study has received funding from the European Metrology Research Programme (EMPIR) of the European Association of National Metrology Institutes (EURAMET), under project number 15HLT05. The study was further supported by the National Institute for Health Research (NIHR) Biomedical Research Centre award to Guy's and St Thomas' NHS Foundation Trust in partnership with King's College London, and by the NIHR Healthcare Technology Co-operative for Cardiovascular Disease at Guy’s and St Thomas’ NHS Foundation Trust. The views expressed are those of the authors and not necessarily those of the NHS, the NIHR or the Department of Health.References
1. Chiribiri A, Schuster A, Ishida M, et al. Perfusion phantom: An efficient and reproducible method to simulate myocardial first-pass perfusion measurements with cardiovascular magnetic resonance. Magn Reson Med. 2013;69(3):698-707.
2. Jerosch-Herold M, Wilke N, Stillman AE. Magnetic resonance quantification of the myocardial perfusion reserve with a Fermi function model for constrained deconvolution. Med Phys. 1998;25(1):73-84.
3. Zarinabad N, Hautvast GL, Sammut E, et al. Effects of tracer arrival time on the accuracy of high-resolution (voxel-wise) myocardial perfusion maps from contrast-enhanced first-pass perfusion magnetic resonance. IEEE Trans Biomed Eng. 2014;61(9):2499-506.
4. Otton J, Morton G, Schuster A, et al. A direct comparison of the sensitivity of CT and MR cardiac perfusion using a myocardial perfusion phantom. J Cardiovasc Comput Tomogr. 2013;7(2):117-24.
5. O’Doherty J, Sammut E, Schleyer P, et al. Feasibility
of simultaneous PET-MR perfusion using a novel cardiac perfusion phantom.
European Journal of Hybrid Imaging. 2017;1(1):4.
Figures