3323
Accelerated Cardiac Perfusion MRI with Radial k-space Sampling, Compressed Sensing, and KWIC filtering to Enable Qualitative and Quantitative Analyses of Perfusion.1Radiology, Northwestern University, Chicago, IL, United States, 2Biomedical Engineering, Northwestern University, Chicago, IL, United States, 3Cardiology, Northwestern University, Chicago, IL, United States
Synopsis
First-pass cardiac perfusion MRI is widely used as an important diagnostic tool for cardiovascular disease and extensive efforts are focused on improving spatial coverage, minimizing dark rim artifacts and quantifying absolute myocardial blood flow. In this study, we used a combination of radial k-space sampling, compressed sensing, and KWIC filtering to address these issues. Compared to the conventional perfusion technique, the accelerated method improved spatial coverage, minimized dark rim artifact and enabled quantification of myocardial blood flow.
Introduction:
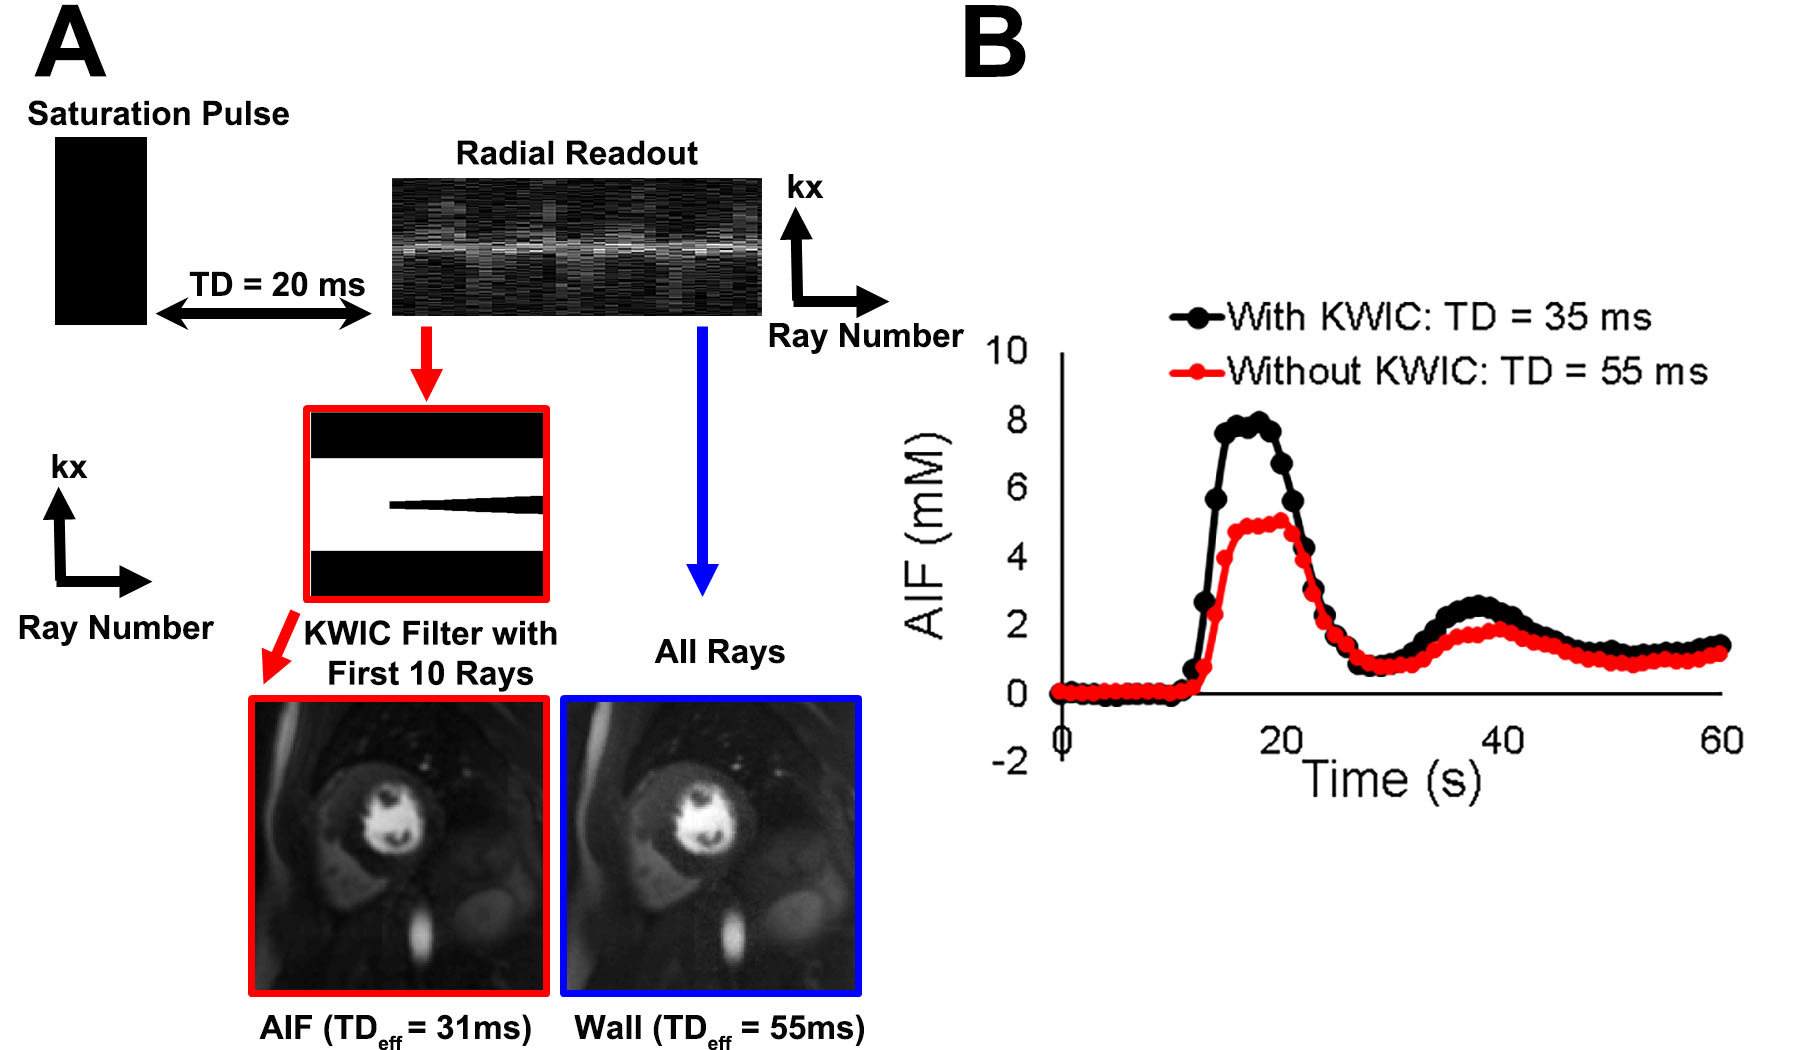
First-pass cardiac perfusion MRI has been shown to be as accurate as cardiac SPECT in diagnosing coronary artery disease(CAD)1-4. Extensive research efforts are on-going for improving the spatial coverage5-9, minimizing the dark rim artifacts(DRA)10-12, and enabling quantification of myocardial blood flow(MBF)13, 14, all of which are not intersecting goals. A combination of radial k-space sampling and compressed sensing(CS)15 can be used to increase spatial coverage and minimize DRA9, 16. The k-space weighted image contrast(KWIC) filtering17, 18 can be used to retrospectively choose an arbitrary saturation recovery time and perform simultaneous reconstruction of one image set with short recovery time for accurate arterial input function(AIF) assessment and another image set with long recovery time for maximal tissue enhancement image (i.e.,dual-imaging19-21). In this study, we sought to accomplish all three goals using a combination of radial k-space sampling, CS, and KWIC filtering.Methods:
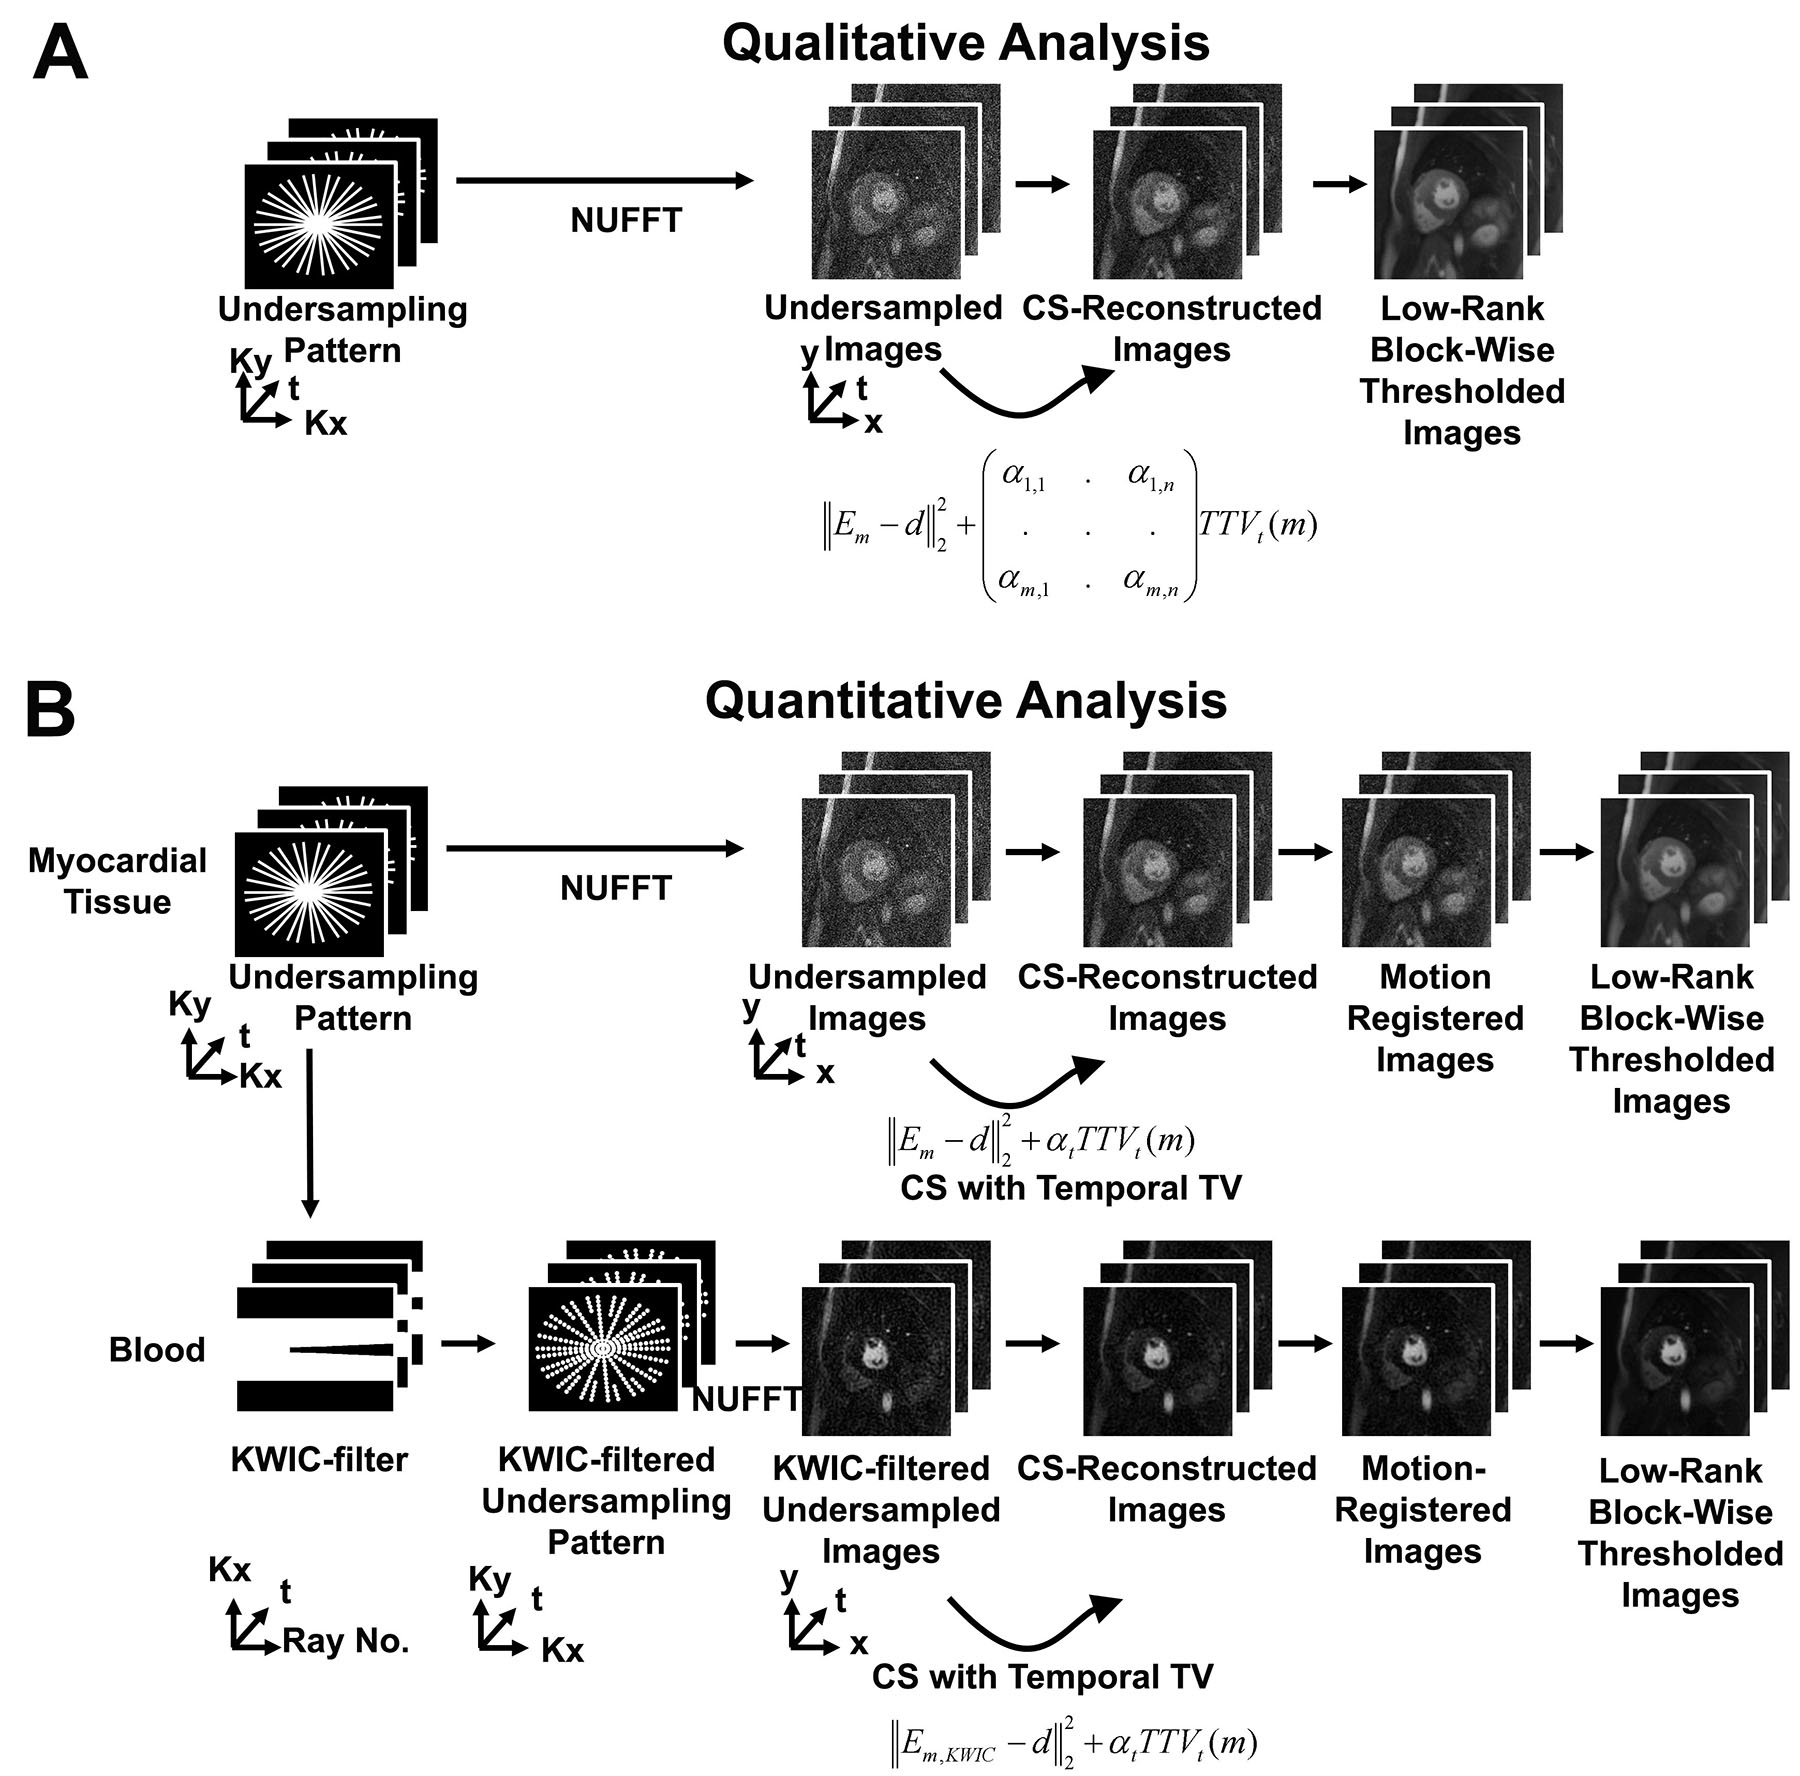
(Patients): We enrolled 12 patients (7/5 males/females, mean age =55±17 years) who were scheduled to undergo a clinical cardiac MRI with gadolinium-based contrast agent (GBCA)(Gadavist) at 1.5T (Aera/Avanto, Siemens). (Pulse Sequence): We modified a TurboFLASH pulse sequence to employ radial k-space sampling with tiny golden angle ratio=23°22. Standard clinical cardiac perfusion MRI pulse sequence was also performed as a reference. Standard and highly-accelerated cardiac perfusion MRI scans were performed back-to-back in randomized order with administration of 0.1mmol/kg per scan at 5ml/s. Imaging parameters for standard perfusion MRI included: acquisition matrix = 192x144, spatial resolution = 3x3x8mm3 (interpolated to 1.5x1.5x8mm3 as per clinical protocol), readout duration = 187.2ms, saturation recovery time to the center of k-space (TI) = 136ms, receiver bandwidth = 750 Hz/pixel, 3-4 short-axis planes per heartbeat, 65 repetitions, and flip angle = 15°. Similar parameters were used for the accelerated perfusion scans, except: acquisition matrix = 192x192, spatial resolution = 1.6x1.6x8mm3 (uninterpolated), readout duration = 78ms (30 rays), TI = 35ms for AIF and 115ms for wall enhancement, and 3-4 short-axis slices and three long-axis slices (4-3-2-chamber views) per heartbeat. For both the standard and accelerated perfusion scans, we additionally acquired proton density images without applying the saturation pulse for the first two heart beats, in order to convert signal intensity to GBCA concentration, as previously described23. (KWIC Filtering): To quantify AIF without signal clipping, image sets with a short saturation time were reconstructed using a KWIC filter where the k-space center was retained for the first ten rays and omitted for the remaining rays (Figure 1, red). As such, image sets for qualitative and quantitative assessments were reconstructed using two different pipelines (Figure 2). Reconstruction for qualitative evaluation, temporal total variance (TTV) was used with empirically derived regularization weights for the foreground and background, and the resulting images were further denoised with three iterations of low-rank block-wise thresholding. Reconstruction for quantitative evaluation, CS and denoising steps were similar as the qualitative reconstruction, except for an additional motion correction step24 between TTV and low-rank block wise, as shown in Figure 2. Bloch-equation signal modeling was used to convert signal intensities to GBCA concentrations23 and Fermi function modeling was used to quantify MBF. (Data Analysis): Twenty four perfusion datasets (2 perfusion scans for each of 12 patients) were randomized and evaluated by 2 readers in a blinded and independent manner using a 5-point Likert scale (1: worst; 3: clinically acceptable; 5: best) for the following three categories: conspicuity of wall enhancement, noise, and artifact. In addition, the readers were asked to grade using a binary score for the presence of DRA. Wilcoxon signed rank test was used to compare the scores (p<0.05 was considered statistically significant).Results:
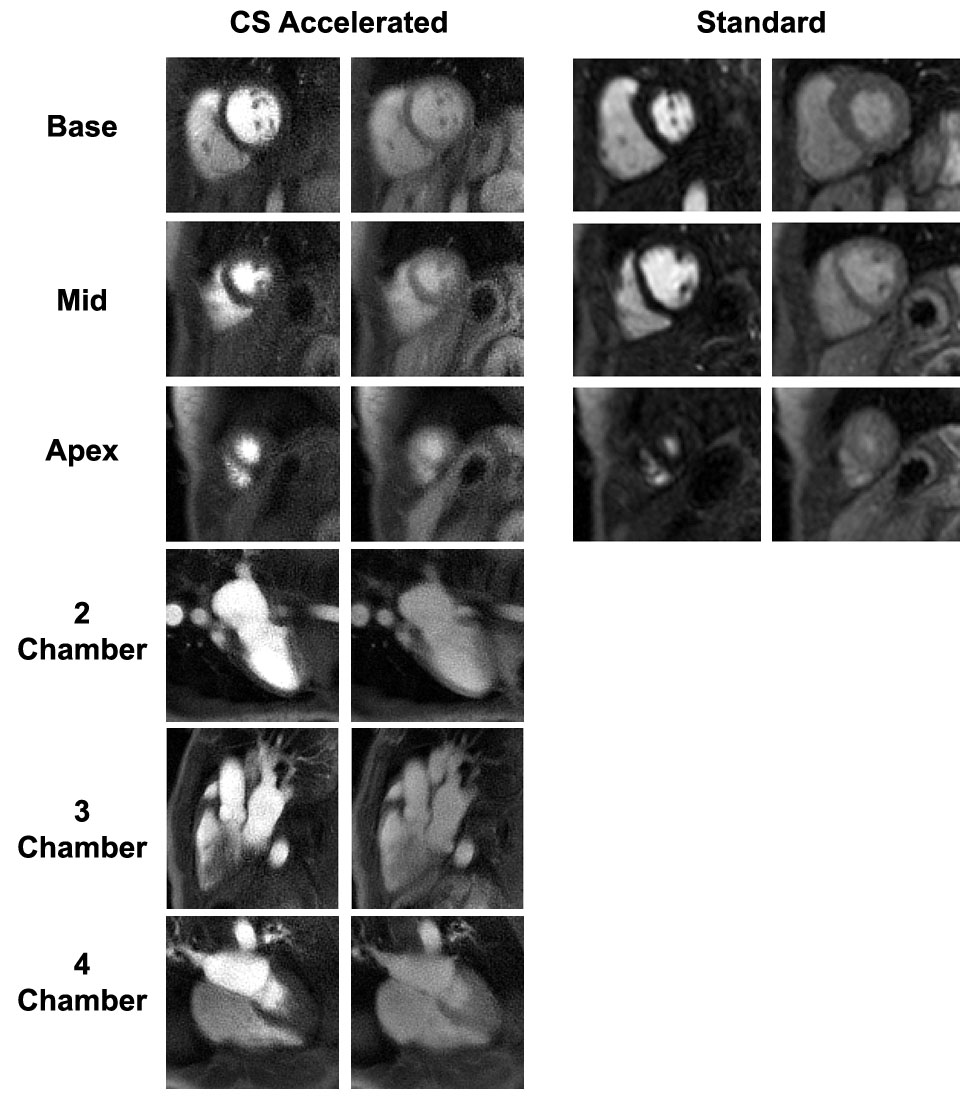
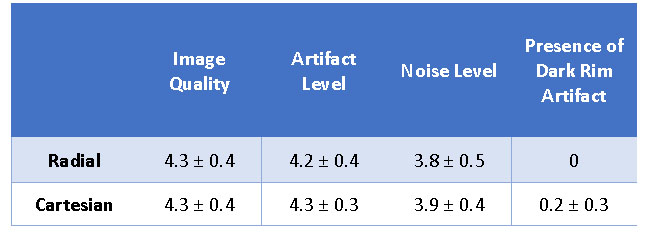
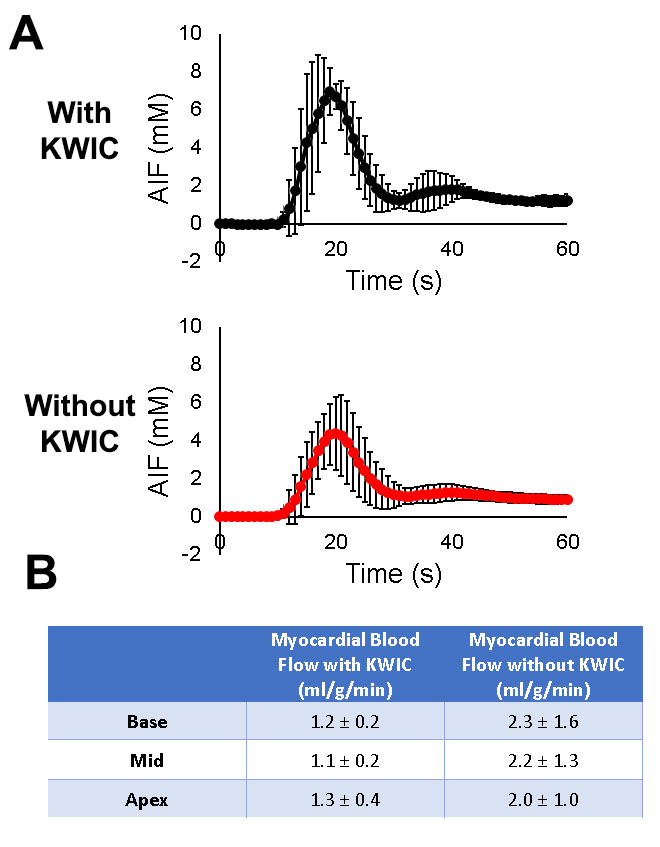
Figure 3 shows representative perfusion images acquired with standard and CS pulse sequences. CS enabled extensive spatial coverage with higher spatial and temporal resolution than conventional perfusion MRI. As summarized in Table 1, the mean reader scores for all categories were not significantly different (p> 0.05). DRA was observed in three cases for clinical standard but none for CS. As shown in Figure 4, compared with KWIC filtering, standard reconstruction underestimated mean AIF (5.2±1.6 mM vs. 8.4±1.3 mM with KWIC) and overestimated MBF (2.0-2.3ml/g/min vs. 1.1-1.3 ml/g/min with KWIC). Note, the MBF values with KWIC filtering agree better with normal MBF values (1.0-1.1ml/g/min) reported in literature25.Conclusion:
This study describes a novel approach that combines radial k-space sampling, CS, and KWIC filtering to improve the spatial coverage, minimize DRA, and quantify MBF. A future study is warranted to evaluate the diagnostic performance in a diverse set of patients suspected with coronary artery disease at peak vasodilation and at rest.Acknowledgements
Funding sources: NIH grant: R01HL116895, R01HL138578, R21EB024315, R21AG055954
I would like to acknowledge help and support from the following Siemens employees: Shivraman Giri, Kelvin Chow, Jianing Pang.
References
1. Greenwood JP, Maredia N, Radjenovic A, Brown JM, Nixon J, Farrin AJ, Dickinson C, Younger JF, Ridgway JP, Sculpher M, Ball SG and Plein S. Clinical evaluation of magnetic resonance imaging in coronary heart disease: the CE-MARC study. Trials. 2009;10:62.
2. Greenwood JP, Maredia N, Younger JF, Brown JM, Nixon J, Everett CC, Bijsterveld P, Ridgway JP, Radjenovic A, Dickinson CJ, Ball SG and Plein S. Cardiovascular magnetic resonance and single-photon emission computed tomography for diagnosis of coronary heart disease (CE-MARC): a prospective trial. Lancet. 2012;379:453-60.
3. Greenwood JP, Motwani M, Maredia N, Brown JM, Everett CC, Nixon J, Bijsterveld P, Dickinson CJ, Ball SG and Plein S. Comparison of cardiovascular magnetic resonance and single-photon emission computed tomography in women with suspected coronary artery disease from the Clinical Evaluation of Magnetic Resonance Imaging in Coronary Heart Disease (CE-MARC) Trial. Circulation. 2014;129:1129-38. 4. Ahmad IG, Abdulla RK, Klem I, Margulis R, Ivanov A, Mohamed A, Judd RM, Borges-Neto S, Kim RJ and Heitner JF. Comparison of stress cardiovascular magnetic resonance imaging (CMR) with stress nuclear perfusion for the diagnosis of coronary artery disease. J Nucl Cardiol. 2016;23:287-97.
5. Manka R, Vitanis V, Boesiger P, Flammer AJ, Plein S and Kozerke S. Clinical feasibility of accelerated, high spatial resolution myocardial perfusion imaging. JACC Cardiovasc Imaging. 2010;3:710-7. 6. Motwani M, Maredia N, Fairbairn TA, Kozerke S, Radjenovic A, Greenwood JP and Plein S. High-resolution versus standard-resolution cardiovascular MR myocardial perfusion imaging for the detection of coronary artery disease. Circulation Cardiovascular imaging. 2012;5:306-13.
7. Plein S, Schwitter J, Suerder D, Greenwood JP, Boesiger P and Kozerke S. k-Space and time sensitivity encoding-accelerated myocardial perfusion MR imaging at 3.0 T: comparison with 1.5 T. Radiology. 2008;249:493-500.
8. Otazo R, Kim D, Axel L and Sodickson D. Combination of compressed sensing and parallel imaging for highly accelerated first-pass cardiac perfusion MRI. Magnetic Resonance in Medicine. 2010;64:767-76. 9. Harrison A, Adluru G, Damal K, Shaaban AM, Wilson B, Kim D, McGann C, Marrouche NF and Dibella EV. Rapid ungated myocardial perfusion cardiovascular magnetic resonance: preliminary diagnostic accuracy. Journal of cardiovascular magnetic resonance : official journal of the Society for Cardiovascular Magnetic Resonance. 2013;15:26.
10. Maredia N, Radjenovic A, Kozerke S, Larghat A, Greenwood JP and Plein S. Effect of improving spatial or temporal resolution on image quality and quantitative perfusion assessment with k-t SENSE acceleration in first-pass CMR myocardial perfusion imaging. Magnetic Resonance in Medicine. 2010;64:1616-1624.
11. Motwani M, Jogiya R, Kozerke S, Greenwood JP and Plein S. Advanced Cardiovascular Magnetic Resonance Myocardial Perfusion Imaging: High-Spatial Resolution Versus 3-Dimensional Whole-Heart Coverage. Circulation: Cardiovascular Imaging. 2013;6:339-348.
12. Sharif B, Arsanjani R, Shalev A, Dharmakumar R, Bairey Merz CN, Berman DS and Li D. Dark-rim-free ungated first-pass perfusion CMR with 3-Slice end-systolic imaging: initial experience. Journal of Cardiovascular Magnetic Resonance. 2014;16:1-2.
13. Mordini FE, Haddad T, Hsu LY, Kellman P, Lowrey TB, Aletras AH, Bandettini WP and Arai AE. Diagnostic Accuracy of Stress Perfusion CMR in Comparison With Quantitative Coronary Angiography: Fully Quantitative, Semiquantitative, and Qualitative Assessment. JACC Cardiovasc Imaging. 2014;7:14-22.
14. Patel AR, Antkowiak PF, Nandalur KR, West AM, Salerno M, Arora V, Christopher J, Epstein FH and Kramer CM. Assessment of advanced coronary artery disease: advantages of quantitative cardiac magnetic resonance perfusion analysis. J Am Coll Cardiol. 2010;56:561-9.
15. Lustig M, Donoho D and Pauly JM. Sparse MRI: The application of compressed sensing for rapid MR imaging. Magnetic Resonance in Medicine. 2007;58:1182-95.
16. Sharif B, Dharmakumar R, LaBounty T, Shufelt C, Thomson LE, Merz NB, Berman DS and Li D. Eliminating dark-rim artifacts in first-pass myocardial perfusion imaging. Journal of cardiovascular magnetic resonance : official journal of the Society for Cardiovascular Magnetic Resonance. 2013;15:O3.
17. Song HK and Dougherty L. k-space weighted image contrast (KWIC) for contrast manipulation in projection reconstruction MRI. Magn Reson Med. 2000;44:825-32.
18. Winkelmann S, Schaeffter T, Koehler T, Eggers H and Doessel O. An optimal radial profile order based on the Golden Ratio for time-resolved MRI. IEEE transactions on medical imaging. 2007;26:68-76.
19. Kim D and Axel L. Multislice, dual-imaging sequence for increasing the dynamic range of the contrast-enhanced blood signal and CNR of myocardial enhancement at 3T. Journal of magnetic resonance imaging : JMRI. 2006;23:81-6.
20. Gatehouse PD, Elkington AG, Ablitt NA, Yang G-Z, Pennell DJ and Firmin DN. Accurate assessment of the arterial input function during high-dose myocardial perfusion cardiovascular magnetic resonance. Journal of Magnetic Resonance Imaging. 2004;20:39-45.
21. Hsu LY, Kellman P, Gatehouse P, Zuehlsdorff S, Glielmi CB, Groves DW, Aletras AH, Bandettini PW and Arai AE. Comparison of arterial input function measured from dual-bolus and dual-sequence dynamic contrast-enhanced cardiac magnetic resonance imaging. Journal of cardiovascular magnetic resonance : official journal of the Society for Cardiovascular Magnetic Resonance. 2011;13:O8.
22. Wundrak S, Paul J, Ulrici J, Hell E, Geibel MA, Bernhardt P, Rottbauer W, Rasche V. Golden ratio sparse MRI using tiny golden angles. Magn Reson Med 2016;75:2372–2378.
23. Cernicanu A and Axel L. Theory-based signal calibration with single-point T1 measurements for first-pass quantitative perfusion MRI studies. Academic radiology. 2006;13:686-93.
24. Avants B. B., Epstein C. L., Grossman M., Gee J. C., “Symmetric diffeomorphic image registration with cross-correlation: Evaluating automated labeling of elderly and neurodegenerative brain,” Med. Image Anal. 12(1), 26–41 (2008).10.1016/j.media.2007.06.004.
25. Lee DC, Johnson NP. Quantification of absolute myocardial blood flow by magnetic resonance perfusion imaging. J Am Coll Cardiol Img. 2009;2:761–770. doi: 10.1016/j.jcmg.2009.04.003.
Figures