3322
Impact of native T1 on pixel-wise myocardial blood flow quantification1Department of Radiology, Medical University of Graz, Graz, Austria, 2Institute of Medical Engineering, Graz University of Technology, Graz, Austria, 3Department of Internal Medicine, Medical University of Graz, Graz, Austria, 4Research and Development, Siemens Healthineers, Graz, Austria
Synopsis
Native myocardial T1 varies between subjects and between segments, yet its impact on pixel-wise quantification of myocardial blood flow (MBF) has not been studied. 15 patients with coronary heart disease underwent 3T cardiac magnetic resonance native myocardial T1 mapping and perfusion imaging at rest. Nonlinearity correction for MBF calculation was performed employing literature native T1 values and patient-specific global as well as local native T1, respectively. Since reference T1 revealed substantial individual MBF errors and application of patient-specific global T1 overestimated MBF in perfusion deficit regions compared to local T1, patient-specific local native T1 should be employed for MBF quantification.
Introduction
Quantification of myocardial blood flow (MBF) from dynamic contrast-enhanced magnetic resonance imaging (DCE-MRI) requires considering the nonlinear relationship between signal intensity (SI) and contrast agent concentration. While employing an SI model1,2 which incorporates native T1 of blood and myocardium is a popular approach for nonlinearity correction, the impact of native T1 on MBF quantification has not been studied. Since native T1 not only depends on acquisition technique but also varies between subjects and myocardial segments,3,4 the aim was to study its influence on pixel-wise MBF quantification by evaluating MBF estimates determined using native T1 normal values reported in literature and patient-specific global as well as local native T1, respectively.Methods
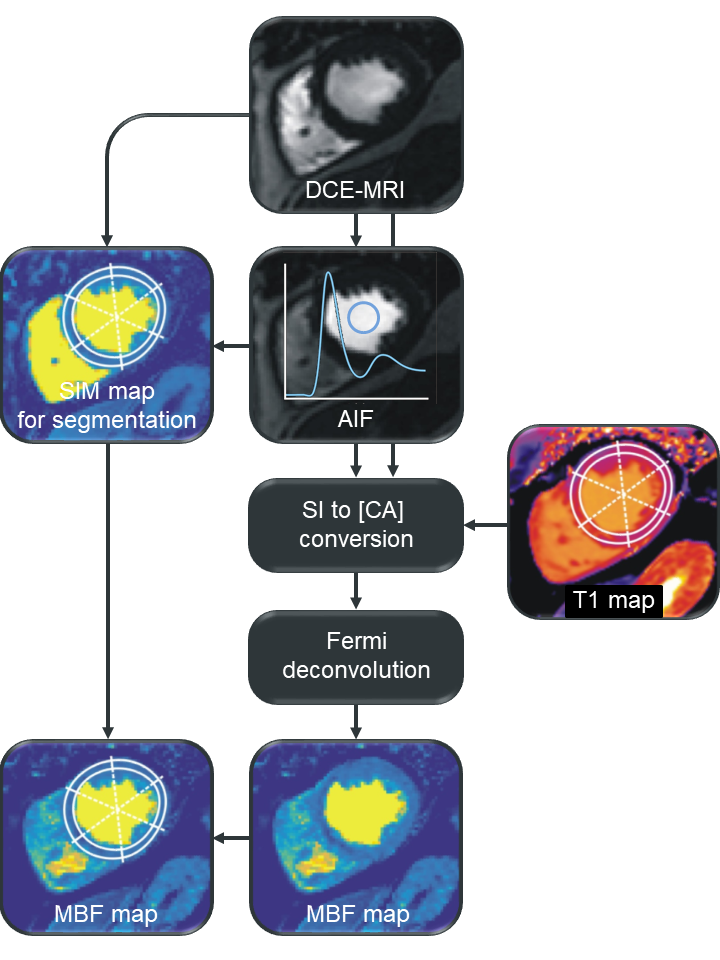
15 patients with coronary heart disease (age = 62±7 years; male/female = 13/2) underwent 3T native myocardial T1 mapping and DCE-MRI at rest. T1 mapping was performed using an electrocardiogram-(ECG)-gated modified Look-Locker inversion recovery (MOLLI) sequence with automated motion correction and T1 map generation.5,6 DCE-MRI was performed with gadolinium-based contrast agent at a dose of 0.05 mmol/kg employing an ECG-gated single-shot saturation recovery fast low angle shot (SR FLASH) sequence with automated coil sensitivity and motion correction.7 Myocardial segments exhibiting perfusion deficits were identified by visual analysis of DCE-MRI series. Figure 1 shows an overview of the image processing steps for pixel-wise MBF quantification. All image processing was done using in-house software implemented in Matlab (MathWorks Inc., Natick, MA), except native T1 map segmentation, which was performed using dedicated software (cvi42, Circle Cardiovascular Imaging Inc., Calgary, Canada). Mid-ventricular short axis slices were evaluated in several experiments: 1) MBF maps were calculated without T1 mapping, namely without nonlinearity correction and by using the ranges of native blood and myocardial T1 normal values at 3T reported in literature,8-10 respectively. 2) MBF maps were calculated using individual patients’ and the study population’s average blood and myocardial T1 values, respectively. 3) MBF was quantified using local myocardial T1 according to the six American Heart Association (AHA) segments for a mid-ventricular short axis slice. For assessment of local MBF, segmental MBF values were calculated as mean MBF of all pixels of each segment. Comparisons of MBF estimates calculated from different native T1 values were performed using paired t-test and Bland-Altman analysis; segmental native T1 values were compared using Welch’s t-test.Results
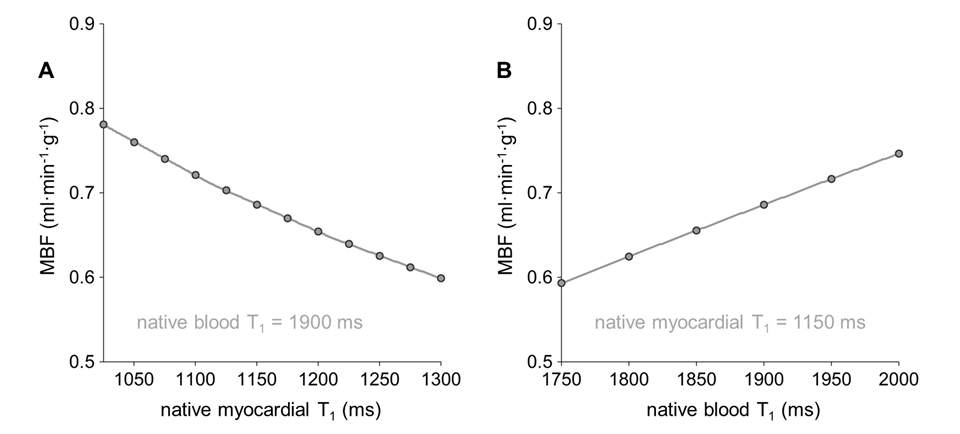
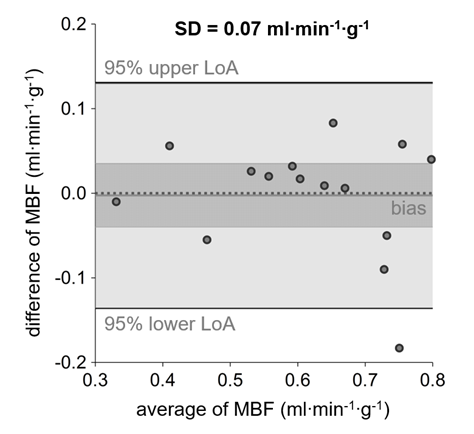
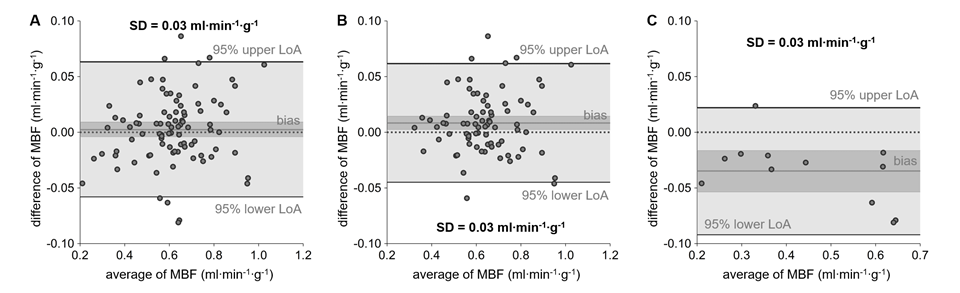
Global MBF determined without nonlinearity correction was significantly higher than global MBF determined using patient-specific global T1 values (MBF SI, 0.71±0.11 ml·min-1·g-1; MBF global T1, 0.61±0.13 ml·min-1·g-1; p=0.0002). Using the range of native T1 normal values reported in literature yielded decreasing global MBF for increasing myocardial T1 values and the opposite behavior for increasing blood T1 values (Figure 2). Comparing MBF determined from patient-specific global T1 with MBF determined from average T1 yielded no significant bias (MBF patient-specific T1, 0.61±0.13 ml·min-1·g-1; MBF average T1, 0.62±0.15 ml·min-1·g-1; p=0.8784) but a large standard deviation of differences of 0.07 ml·min-1·g-1 (Figure 3). Myocardial segments with perfusion deficits were identified in six patients. Mean T1 in myocardial segments with perfusion deficits was higher than mean T1 in segments without perfusion deficits (1425±170 ms vs. 1235±66 ms, p=0.0024). Segmental mean MBF values calculated from global and local native myocardial T1, respectively, were not significantly different (Figure 4A). However, considering segments with and without perfusion deficits individually revealed a decrease in MBF for segments with perfusion deficits if local instead of global native T1 was used; segments without perfusion deficits showed the opposite behavior (Figure 4B and 4C).Discussion
The range of average global MBF estimates determined employing different native blood and myocardial T1 normal values reported in literature was large, even exceeding average MBF estimates determined without nonlinearity correction. Figure 2 also shows that myocardial and blood T1 had an equally strong effect on MBF estimates within the literature T1 ranges. Employing specifically the study population’s average native T1 revealed that an individual error up to 30% can be expected if average instead of patient-specific T1 is used. If native myocardial T1 varies locally, contrary T1 effects on MBF estimates may cancel each other out in regional analysis, which was observed when considering segments with and without perfusion deficits individually. The fact that segments with perfusion deficits showed a significantly lower MBF if local instead of global native T1 was used matches the observation of higher native T1 in segments with perfusion deficits.Conclusion
Native myocardial and blood T1 have substantial impact on MBF estimates determined using SI model based nonlinearity correction. To avoid overestimation of MBF in myocardial regions with perfusion deficits, patient-specific local native T1 should be employed for MBF quantification.Acknowledgements
No acknowledgement found.References
1. Brix G, Schad LR, Deimling M, et al. Fast and precise T1 imaging using a TOMROP sequence. Magn Reson Imaging. 1990;8(4):351-6.
2. Jerosch-Herold M, Wilke N, Stillman AE, et al. Magnetic resonance quantification of the myocardial perfusion reserve with a Fermi function model for constrained deconvolution. Med Phys. 1998;25(1):73–84.
3. Kellman P, Hansen MS. T1-mapping in the heart: accuracy and precision. J Cardiovasc Magn Reson. 2014;16(1):2.
4. Reiter U, Reiter G, Dorr K, et al. Normal diastolic and systolic myocardial T1 values at 1.5-T MR imaging: correlations and blood normalization. Radiology. 2014;271(2):365–72.
5. Messroghli DR, Plein S, Higgins DM, et al. Human myocardium: single-breath-hold MR T1 mapping with high spatial resolution -- reproducibility study. Radiology. 2006;238(3):1004–12.
6. Xue H, Shah S, Greiser A, et al. Motion correction for myocardial T1 mapping using image registration with synthetic image estimation. Magn Reson Med. 2012;67(6):1644–55.
7. Xue H, Zuehlsdorff S, Kellman P, et al. Unsupervised inline analysis of cardiac perfusion MRI. In: International Conference on Medical Image Computing and Computer-Assisted Intervention 2009 (pp. 741-749). Springer, Berlin, Heidelberg.
8. Lee JJ, Liu S, Nacif MS, et al. Myocardial T1 and extracellular volume fraction mapping at 3 Tesla. J Cardiovasc Magn Reson. 2011;13(1):75.
9. Dabir D, Child N, Kalra A, et al. Reference values for healthy human myocardium using a T1 mapping methodology: results from the International T1 Multicenter cardiovascular magnetic resonance study. J Cardiovasc Magn Reson. 2014;16(1):69.
10. Hinojar R, Varma N, Child N, et al. T1 mapping in discrimination of hypertrophic phenotypes: hypertensive heart disease and hypertrophic cardiomyopathy. Circ Cardiovasc Imaging. 2015;8(12):e003285.
Figures