3314
Fluorine-19 Magnetic Resonance at 21.1 Tesla to Detect Brain Inflammation1Berlin Ultrahigh Field Facility (B.U.F.F.), Max Delbrueck Center for Molecular Medicine in the Helmholtz Association, Berlin, Germany, 2The National High Magnetic Field Laboratory, Florida State University, Tallahassee, FL, United States, 3MRI TOOLs GmbH, Berlin, Germany, 4Experimental and Clinical Research Center (ECRC), a joint cooperation between the Charité Medical Faculty and the Max Delbrueck Center, Berlin, Germany
Synopsis
Detection of brain inflammation by fluorine-19 (19F) MRI was studied for the first time at 21.1 T (NHMFL, Tallahassee, FL). Studies on phantoms showed an SNR gain of 2.1 at 21.1 T, when compared to 9.4 T. A dependency between 19F-MR relaxation and magnetic field strength (B0) was demonstrated. A T1 reduction and higher SNR per unit time counterbalanced the T2 shortening-induced loss in 19F MR signal when performing high spatially-resolved MRI of post mortem experimental autoimmune encephalomyelitis (EAE) mouse samples at 21.1 T. 19F-signals, not seen at 9.4 T, were revealed in both mouse brain and draining lymph nodes.
Introduction
Neuroinflammation can be monitored with 19F MRI using 19F-nanoparticles (NPs) that label immune cells in vivo. The migration of these cells into the brain can then be studied in EAE,1,2 a model of multiple sclerosis.3 Although the absence of background signal is an advantage, the low abundance of 19F nuclei in vivo poses a major challenge for MR detection in neuroinflammation. An increase in B0 from 9.4 to 21.1 T would result in a theoretical 5-fold increase in the received MR signal. This is the main driving force for using higher B0. However, the theoretical SNR gain is reduced with increasing frequencies due to increases in noise from sample and coil losses (e.g. SNR$$$\propto$$$B01.75 for solenoidal coils).4,5 Recognizing these opportunities and challenges, we investigated the influence of 21.1 T on 19F relaxation times and SNR gain, compared to 9.4 T.
Methods
Experiments were carried out on the 21.1 T vertical bore MR system (1H: f=900 MHz, 19F: f=844.9 MHz) of the National High Magnetic Field Laboratory (NHMFL) using a 19F/1H birdcage coil (linear, LP, 8 rungs, lengthcoil=54.5mm, Øinner=33mm, lengthshield=64mm, Øshield=53mm). On the 9.4 T small animal MR system (1H: f=400 MHz, 19F: f=376 MHz, Bruker BioSpin, Ettlingen, Germany) a similar coil was used (linear, HP, 12 rungs, lengthcoil=50mm, Øinner=35mm, lengthshield = 80mm, Øshield= 57mm). Electromagnetic field simulations at the same absorbed power were used to determine B1 fields for both coils.6 Relaxation time and SNR measurements: Four NMR tubes were filled with 19F-NPs prepared from perfluoro-15-crown-5-ether (60mM, 120mM, 600mM, 1200mM PFCE (Fluorochem))7 and submerged in a 50ml tube containing 4.5g/L NaCl. Parametric mapping was performed on axial slices (FOV=[30x30]mm², matrix=96x96, slice=10mm). RARE sequence for T1-mapping: 15xTRs=25-8000ms, TE=9.24ms, NEX=36 (9.4 T: TA=5h42m46s; 21.1 T: TA=4h7m19s). MSME protocol for T2-mapping: TR=4000ms, 150xTEs=7-1050ms (9.4 T: NEX=64, TA=6h49m36s; 21.1 T: NEX=36, TA=3h50m24s). SNR was calculated8 on axial 2D-RARE images (TR=4000ms, TE=9.1ms, ETL=4, FOV=[30x30]mm², matrix=128x126, slices=1-10mm, NEX=1, TA=17m4s). Animal experiments were carried out in accordance with local animal welfare protocols: EAE was induced in SJL/J mice,2 PFCE NPs were administered daily for five days2 after which mouse tissue was prepared for ex vivo MRI.2 3D-RARE brain 19F MRI: TR=800ms, TE=4.9ms, FOV=[30x20x20]mm³, NEX=256 (high-resolution: matrix=195x130x130, ETL=33, TA= 7h30m33s; medium-resolution: matrix=135x90x90, ETL=23, TA=5h14m1s; low-resolution: matrix=90x60x60, ETL=15, TA=3h24m46s). FLASH brain 1H MRI: TR=150ms, TE=7.5ms, FOV=[30x20x20]mm³, matrix=600x400x400, NEX=2, TA=3h20m.Results
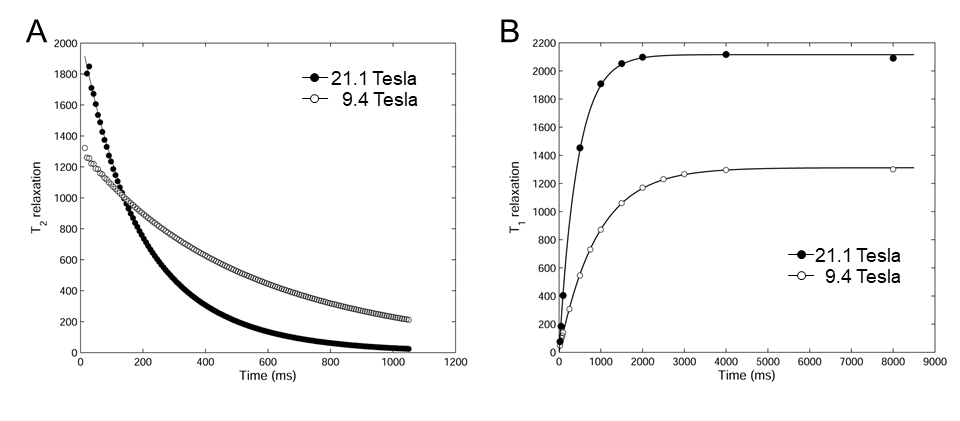
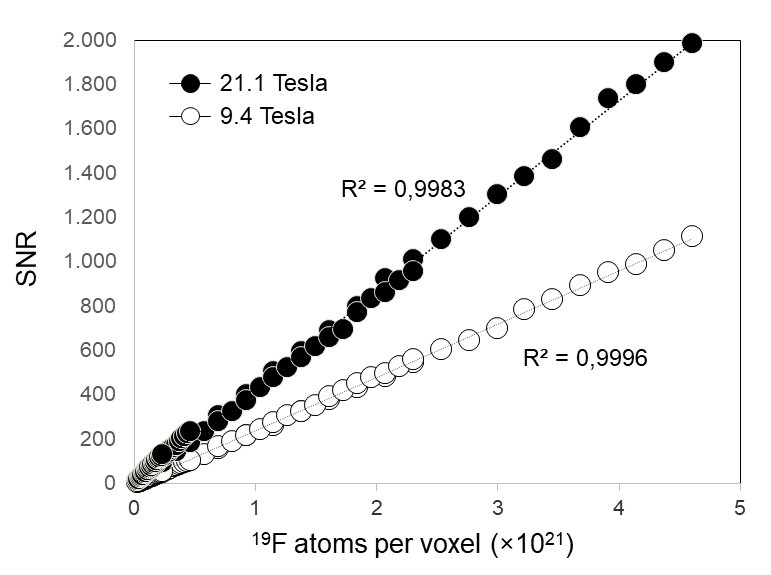
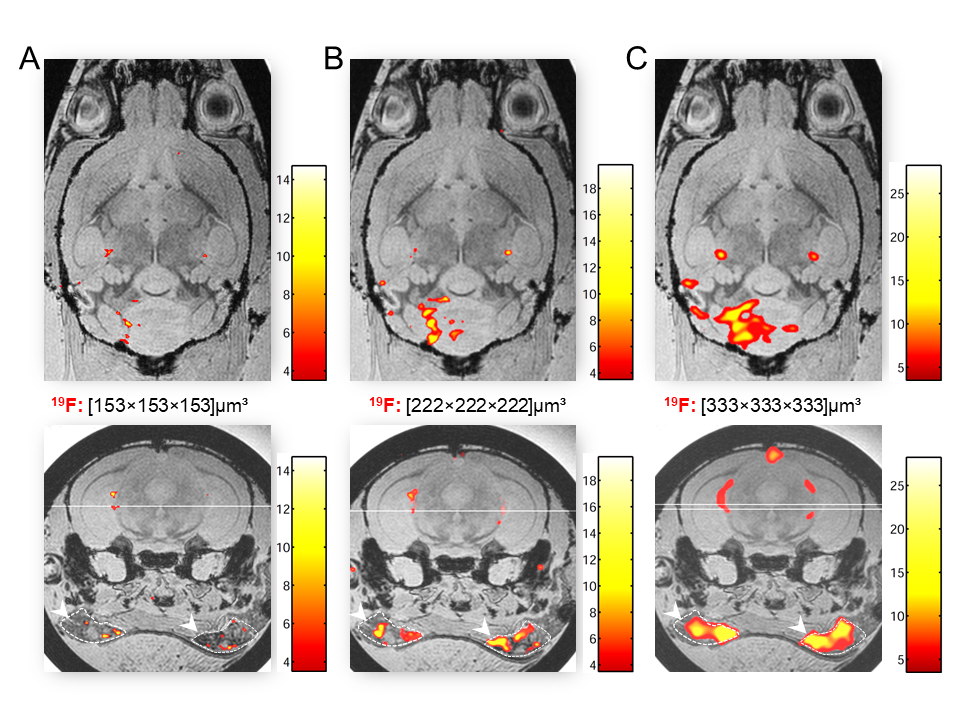
Both T1 and T2 values for PFCE NPs were influenced by B0. Similar to other nuclei, the transverse spin-spin relaxation was decreased at 21.1 T (Figure 1A). Contrary to 1H, where T1 values increase with B0,9 the T1 of the PFCE NPs decreased by nearly 50% at 21.1 T (Figure 1B). The PFCE concentration did not influence T1 and T2 values (Table 1). For SNR measurements, slice thickness was varied for all PFCE concentrations. SNR was obtained as a function of the number of 19F atoms per voxel (Figure 2). An SNR gain of 2.1 was calculated at 21.1 T versus 9.4 T. The EM simulations revealed a 1.8-fold decrease in the B1 field at 21.1 T, when compared to 9.4 T: the maximum SNR gain is expected to be 2.8 (5/1.8), assuming total sample noise dominance and a lossless receive chain. High resolved MRI of EAE mice at 21.1 T revealed a greater level of detail of the immune cell migration in the inflamed brain and draining lymph nodes (Figure 3).Discussion
We demonstrate the feasibility of 19F MRI at 21.1 T for detecting inflammation in the brain and adjacent lymphatic system with high spatial definition. The decline in T1 with increasing B0 is consistent with previous studies.10,11 This suggests that at higher B0, data acquisition can be better accelerated. The decline in T2 at higher B0 hampers the expected increase in 19F MR signal at 21.1 T. The difference in the experimental SNR gain (2.1) and the maximum expected SNR gain (2.8) could be explained by coil and receive chain losses as well as preamplifier noise variations between both setups.Conclusion
For a swift translation into application, high spatially-resolved 19F
MRI was performed on EAE post mortem
tissue to determine the feasibility of improved spatial definition of
inflammatory cell location. This will allow us to study
neuroinflammation with greater detail in future in vivo studies. Acknowledgements
Part of this work was performed at the US National High Magnetic Field Laboratory, which is supported by the State of Florida and the National Science Foundation Cooperative Agreement No. DMR-1157490. The authors wish to thank Dr. William Brey and his team at the National High Magnetic Field Laboratory for valuable input and discussions on coil selection and design. The NHMFL User Collaborations Grant Program also provided travel funding to SW and HW.
References
1. Waiczies H, Lepore S, Drechsler S, Qadri F, Purfurst B, Sydow K, Dathe M, Kuhne A, Lindel T, Hoffmann W, Pohlmann A, Niendorf T, Waiczies S. Visualizing brain inflammation with a shingled-leg radio-frequency head probe for 19F/1H MRI. Scientific reports 2013;3:1280.
2. Waiczies S, Millward JM, Starke L, Delgado PR, Huelnhagen T, Prinz C, Marek D, Wecker D, Wissmann R, Koch SP, Boehm-Sturm P, Waiczies H, Niendorf T, Pohlmann A. Enhanced Fluorine-19 MRI Sensitivity using a Cryogenic Radiofrequency Probe: Technical Developments and Ex Vivo Demonstration in a Mouse Model of Neuroinflammation. Scientific reports 2017;7(1):9808.
3. Stadelmann C. Multiple sclerosis as a neurodegenerative disease: pathology, mechanisms and therapeutic implications. CurrOpinNeurol 2011.
4. Hoult DI, Richards RE. The signal-to-noise ratio of the nuclear magnetic resonance experiment. JMagn Reson(1969) 1976;24(1):71-85.
5. Hoult DI, Lauterbur PC. Sensitivity of the Zeugmatographic Experiment Involving Human Samples. Journal of Magnetic Resonance 1979;34(2):425-433.
6. Computer Simulation Technology (CST) Studio Suite, 2017.
7. Waiczies H, Lepore S, Janitzek N, Hagen U, Seifert F, Ittermann B, Purfurst B, Pezzutto A, Paul F, Niendorf T, Waiczies S. Perfluorocarbon particle size influences magnetic resonance signal and immunological properties of dendritic cells. PloS one 2011;6(7):e21981.
8. MATLAB, 7.9.0.529, 2009.
9. Rooney WD, Johnson G, Li X, Cohen ER, Kim S-G, Ugurbil K, Springer CS. Magnetic field and tissue dependencies of human brain longitudinal 1H2O relaxation in vivo. Magnetic Resonance in Medicine 2007;57(2):308-318.
10. Kadayakkara DK, Damodaran K, Hitchens TK, Bulte JW, Ahrens ET. (19)F spin-lattice relaxation of perfluoropolyethers: Dependence on temperature and magnetic field strength (7.0-14.1T). J Magn Reson 2014;242:18-22.
11. Duong TQ, Iadecola C, Kim S-G. Effect of hyperoxia, hypercapnia, and hypoxia on cerebral interstitial oxygen tension and cerebral blood flow. Magnetic Resonance in Medicine 2001;45(1):61-70.
Figures