3313
Resting state, gluCEST and anatomical MRI approaches at 11.7T for brain aging studies in a non-human primate1Commissariat à l'Énergie Atomique et aux Énergies Alternatives (CEA), Fontenay-aux-Roses, France, Fontenay aux roses, France, 23U1077, INSERM, Caen, France, 3Laboratoire de psychopathologie et de neuropsychologie, University of Paris 8, Paris, France
Synopsis
The gray mouse lemur (Microcebus murinus) is a small non-human primate with rapid maturity. This study focuses on the development of non-invasive MRI tools applied to neurodegenerative processes. We performed three different types of analysis: anatomical volumetric measures, neuronal network assessment with resting-state fMRI and brain glutamate distribution with gluCEST imaging. We found anatomical atrophy and functional deficiency mostly in cortical regions. To our knowledge, this study is the first to characterize the functional and anatomical brain aging process in a non-human primate. Furthermore, the mouse lemur functional and gluCEST maps have never been described before.
Introduction:
The gray mouse lemur (Microcebus murinus), a small non-human primate (NHP), is attracting increased attention as a model for studying the effect of aging and age-related diseases in the brain [1]. Its rodent-like size (typical length 12cm, 60-120g weight), rapid maturity (puberty at 6-8 months) and decade-long lifespan brings rodent-like practicality to a primate model, and thus closer evolutionary proximity to humans. Although human functional network organization is now well characterized, the primate network remains poorly studied. A lack of animals due to breeding difficulties is one of the reasons. The small size of the mouse lemur allowed us larger animal numbers and the use of very high field studies (11.7T). We recorded three different types of images in order to characterize: 1) anatomical lesions by volumetric measures, 2) neuronal networks by resting-state fMRI and 3) brain glutamate distribution by gluCEST imaging. This promising combination of non-invasive biomarkers allowed us to characterize a large spectrum of the aging process, and has many potential applications for neurodegenerative disease studies.Methods:
Animals:
MRI data were acquired in 33 different animals (12 females) divided into two groups. The young group was 26.2 ± 2.3 months old and the old group 105.9 ± 3.26 months old. MRI sequences were acquired using an 11.7T Bruker Biospec system. All animals were anesthetized by isoflurane at 1.25-1.5%. Respiratory rate (43.45 ± 4.29 bmp) was monitored to ensure animal stability until the end of the experiment. Body temperature was maintained by an air heating system (32°C).
MRI sequences:
Anatomical MSME: TR5000, TE 17.5, FOV(mm): 32x32, 75 slices, 6 echoes, 5ms IET, Resolution: 200x200x200 µm3, 10min
Resting state GE-EPI: TR1000 ; TE 10.0, Flip angle: 90°, Repetitions: 450, FOV(mm): 30x20 mm, 23 slices, Resolution: 312.5x208.33x900 µm3, 7 m30s
Glutamate imaging: TR2000 ; TE 30.0, Repetition: 1, FOV(mm): 24x24 mm, 15 slices, Resolution: 0.250 x 0.250 µm3, 33min. Data were acquired with B1 = 5µT and saturation frequencies applied between –5 and 5ppm at 1ppm steps [6]
MRI data processing and analyses: For each scan, spatial normalization of the anatomical was done towards a generated template with AFNI [2]. Segmentation of each ROI was according to our MRI atlases based on histological atlas [3,4]. Sizes of 68 brain regions were subsequently measured thanks to the segmentation. Functional parcellation was carried out on resting state data using CanICA in Nilearn [5].
Results:
Volumetric quantification of the different anatomical ROIs throughout the brain revealed important atrophy in the following regions (Figure 1): putamen (p=0.00013), thalamus (p=0.008), primary somatosensory cortex (p=0.002), somatosensory association cortex (p=0.015), auditory cortex (p=0.025), cerebral retrosplenial cortex (p=0.049), subgenual cortex (p=0.04). The cortex seems to be particularly impacted by atrophy.
Functional parcellation was achieved in our resting state data using independent component analysis with 40 components (Figure 2, 3). To evaluate the spatial robustness of the ICA, we performed exploratory analyses varying the number of components (10, 15, 20, 30, 40, 45, 50, and 60). We determined the ideal number of components based on visual identification consistent with human ICA maps and a mouse lemur anatomical atlas [3,4]. Almost all bilateral components (except the posterior thalamus and the left secondary visual cortex (V2)) were found in both hemispheres.
We performed atlas-based segmentation of the functional images and produced correlation matrices (Figure 4). The comparison of the two groups was processed after z-transformation and the observed differences were subjected to a t-test thresholded at p<0.01. As expected given the anatomical lesions, the main alterations seemed to occur in the cortical region.
GluCEST performed in the whole colony exhibited a trend to decrease in all the brain of the aged group (Figure 5). The parcellation of the glutamate map, region by region, will give us more accuracy to characterize the aging process.
Discussion/Conclusion:
Atrophy in aged lemurs involves CSF accumulation in place of neuronal loss [7]. We already know that this atrophy is correlated to cognitive deficits in the mouse lemur [8]. Interestingly, some of these brain areas seems to be impacted by hypertrophy and connectivity deficits. Functional parcellation of the lemur brain revealed critical connectivity pathways in mouse lemur brains and is a first step towards the understanding of the interaction between cerebral atrophy, neuronal impairments assessed by gluCEST and functional connectivity deficits.To our knowledge, this study is the first to characterize both the functional and anatomical brain aging processes in an NHP. Furthermore, the functional map of the mouse lemur and gluCEST brain maps in a NHP have never been described before.Acknowledgements
France-Alzheimer Association, Fondation Plan Alzheimer, Banque Publique d’Investissement (ROMANE program)References
[1] Picq JL et al., Neurobiol Aging. 2012; 33(6):1096–109, PMID 20970891
[2] https://afni.nimh.nih.gov/
[3] Bons N et al., Brain Res Bull. 1998; 46(1, 2):1-173.
[4] Le Gros Clark WE. Proc Zool
[5] Abraham et al., Front Neuroinform. 2014; 8:14
6] Pépin et al., Neuroimage. 2016; 139:53-64
[7] Kraska et al., Neurobiol Aging. 2011; 32(5):894–906
[8] Languille et al., Ageing Res Rev. 2012; 11(1):150-62.
The template and atlas plus all code are available for download. https://www.nitrc.org/projects/mouselemuratlas and https://github.com/sammba-mri/sammba-mri/tree/dev/sammba
Figures
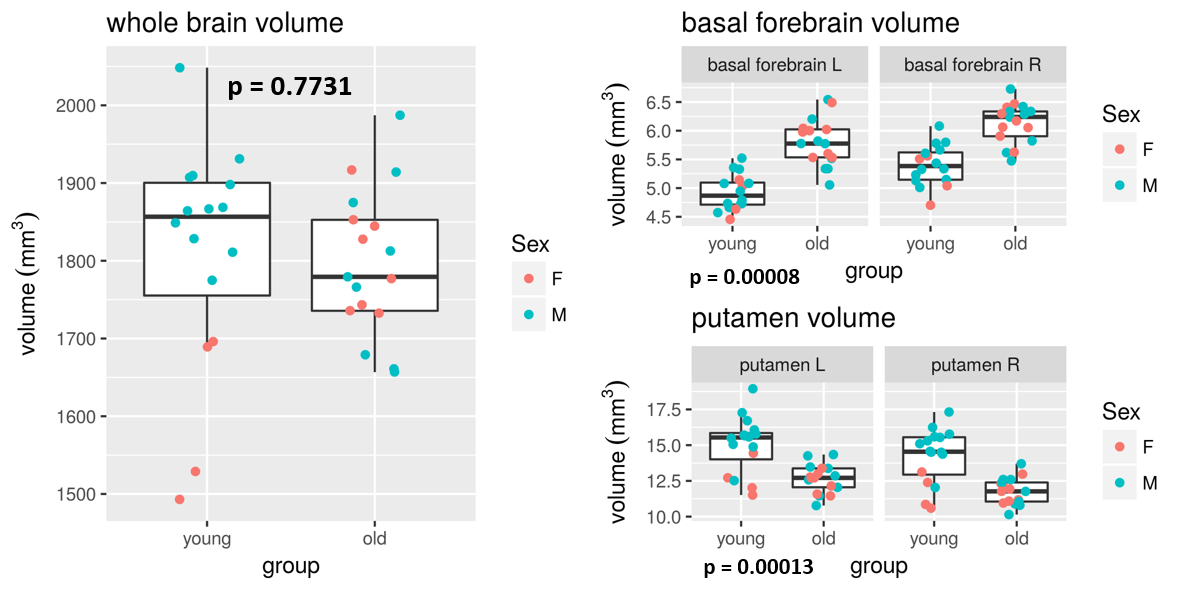
Figure1: Anatomical differences
The left graphs show how the sizes of the whole brain, basal forebrain and putamen differed between young and old animals. P-values are for Mann-Whitney tests of group difference. Typically, atrophy is expected with age. However, whole brain volume was not lower in the old animals, and although some regions such as the putamen shrank, others such as the basal forebrain expanded.
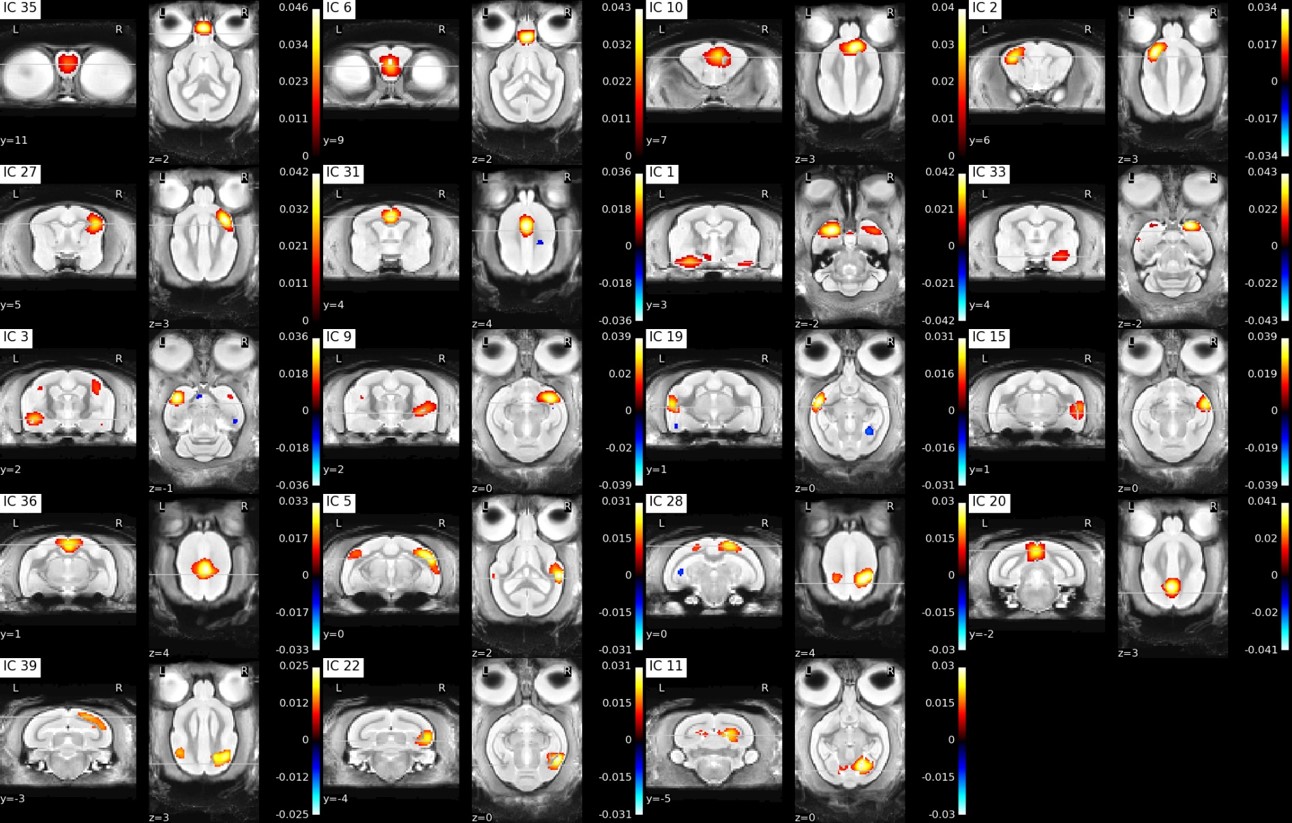
Figure2: Individual ICA cortical components
Approximate component locations: IC35: olfactory bulb anterior, IC6: cortex olfactory bulb posterior, IC10: premotor cortex, IC2: primary somatosensory cortex, IC27: primary somatosensory, IC31: anterior cingulate cortex, IC1: left ventral entorhinal cortex, IC33: right ventral entorhinal cortex, IC3: left insular cortex, IC9: right insular cortex, IC19: left middle temporal gyrus, IC15: right middle temporal gyrus, IC36: midcingulate cortex, IC5: superior temporal gyrus, IC28: somatosensory association cortex, IC20: posterior cingulate cortex, IC39: visuo-motor coordination, IC22: right secondary visual cortex (V2), IC11: primary visual cortex (V1)
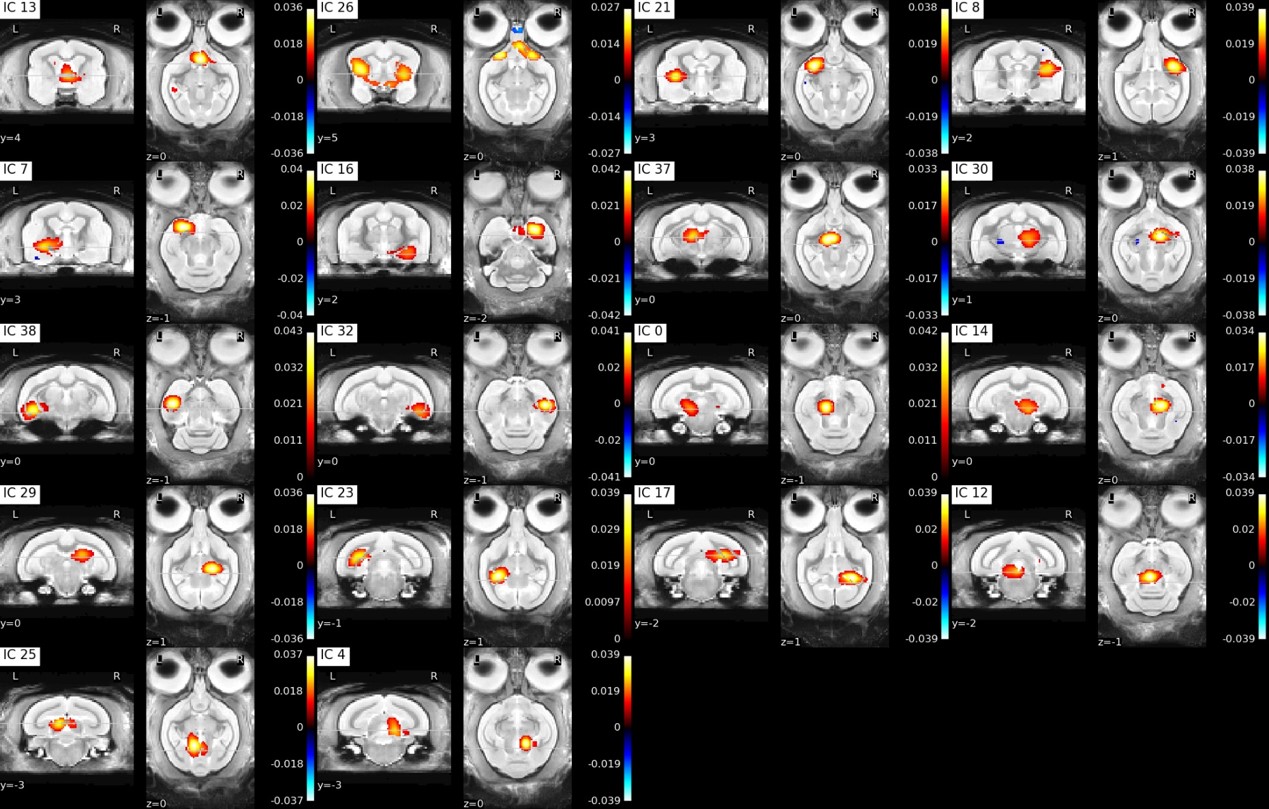
Figure3: Individual ICA subcortical components
Approximate component locations: IC13: septum, IC26: putamen and hypothalamus, IC21: left putamen, IC8: right putamen, IC7: left amygdala, IC16: right amygdala, IC37: left anterior thalamus, IC30: right anterior thalamus, IC38: left anterior hippocampus, IC32: right anterior hippocampus, IC0: left anterior midbrain, IC14: right anterior midbrain, IC29: right posterior thalamus, IC23: left posterior hippocampus, IC17: right posterior hippocampus, IC12: posterior midbrain, IC25: left colliculus superior, IC4: right colliculus superior
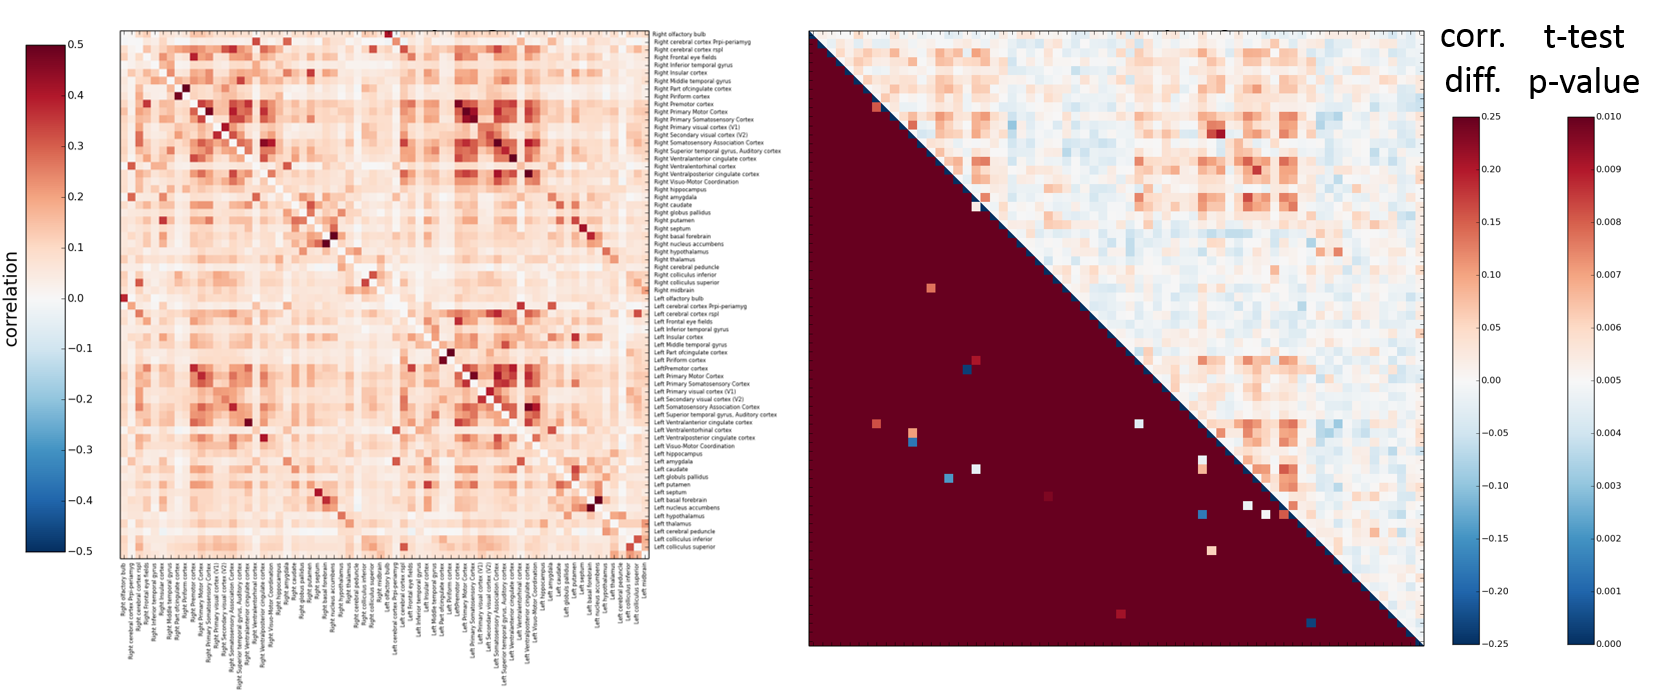
Figure 4: Resting state differences between young and old mouse lemur
Left: correlation mean of young lemur (top triangle) and old lemur (bottom) Right: Presented here are matrices of group differences (upper triangle, correlation difference, lower triangle, t-test (p>0,01). The main diffences seems to occure in the cortical region.
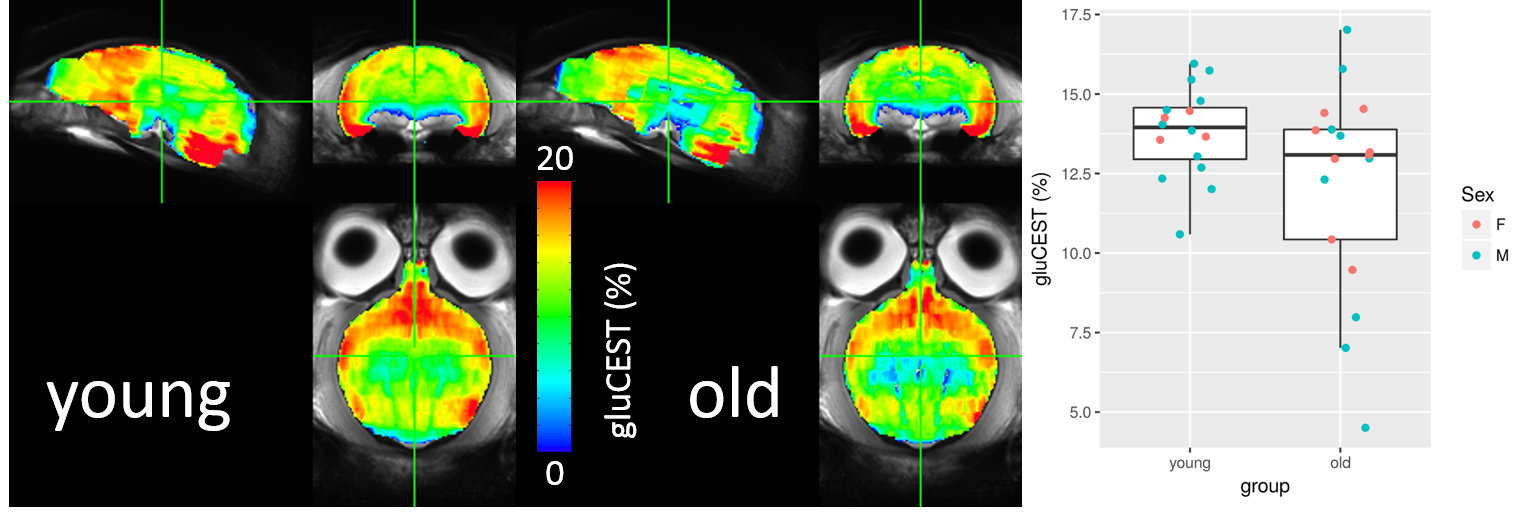
Figure5: Group gluCEST results
Glutamate concentration tended to be lower in older animals though this was not significant (Mann-Whitney test p = 0.1567). Ventral areas exhibited substantial B0 inhomogeneity. Correction for this using the spectral information (not yet done), as well as the use of more refined ROIs, could reveal an effect of age on glutamate as measured by gluCEST.