3312
Comparison of high resolution ex vivo multi gradient echo sequences at 7T and 11.7T for amyloid load quantification in an Alzheimer's disease mouse model1CEA Saclay, Gis sur Yvette, France
Synopsis
The gold standard to quantify amyloid load in animal models of Alzheimer’s disease is histology. Despite being really reliable, this technique is destructive and still mainly 2D. Here we optimized a full 3D ex vivo protocol to image whole brain of Alzheimer’s disease mouse model. A high resolution Multi Gradient Echo sequence evidences the shortening of T2* caused by the iron content of amyloid plaques. Plaque detection capabilities were compared between 7T and 11.7T acquisitions for similar scan duration. Unlike the 7T protocol, the 11.7T setup clearly allows amyloid plaque detection and quantification.
In the search of a therapy for Alzheimer's disease, a lot of preclinical work is currently done on mouse models of the disease, mainly following the amyloid cascade hypothesis. In those studies, the efficacy of the therapy is measured through the reduction of the amyloid load in terms of number of plaques, size of the plaques or proportion of the volume occupied by the plaques1. The gold standard for those measurements is histology: brains are cut in thin slices and amyloid plaques are stained2. This technique suffers several limits. Firstly this is intrinsically a 2D technique, the slice thickness is arbitrary and can impact the calculation of the amyloid load in a volume. Secondly and more importantly, brains are almost never fully imaged. This technique being very time consuming, people usually select a dozen of slices to estimate amyloid load of a whole brain, which is typically made of a total of 500 slices. The arbitrarily chosen ROI might bias the result. In this study, we evaluate 3D high resolution post mortem gradient echo imaging at 7T and 11.7T to estimate amyloid load in the whole brain. This detection relies on the iron content inside the amyloid plaques which inducesgives a hyposignal on T2* images.
We worked on APP/PS1dE9 mice which exhibit a lot of amyloid plaques at one year. 8 male mice, one year old, 6 transgenic mice and 2 wild type littermates, were exsanguino-perfused to remove the blood from the vessels. The head was placed in a falcon tube filled with FC-40 and inserted inside the magnet (11.7T, Bruker Biospec) equipped with a radiofrequency cryoprobe (two channels, 1cm²) and a 3D Multi Gradient Echoes image was acquired (TE/TR = 4/90ms, resolution 40*40*40µm3, matrix size 400*270*180, 8 echoes, echo spacing 4.75ms, 12 averages). A comparative study was carried out on another scanner (7T, Bruker Biospec) equipped with a surface receive array coil (four channels, 1cm²). Total acquisition time was kept constant on both scanners (approximatively 12h, for an overnight scan). To keep sufficient Signal to Noise Ratio (SNR), the resolution was decreased to 60µm isotropic. TE was shortened to 3.5ms as well as the echo spacing. The field of view was kept constant. To quantify amyloid load, we developed a homemade Matlab routine to automatically detect the amyloid plaques in the cortex based on a local thresholding of imagen the intensity.
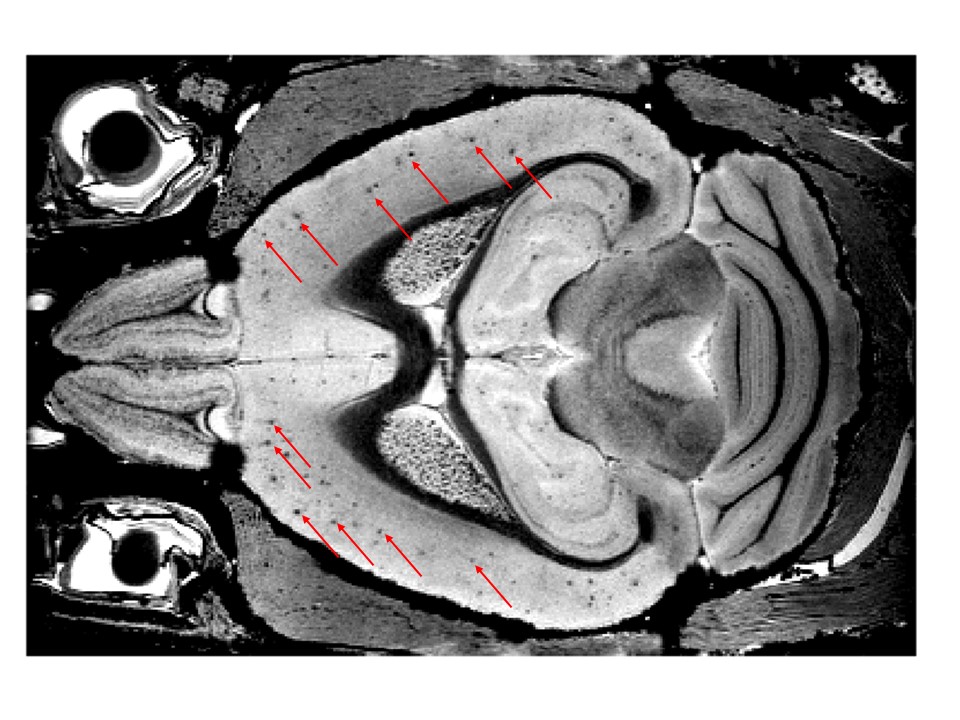
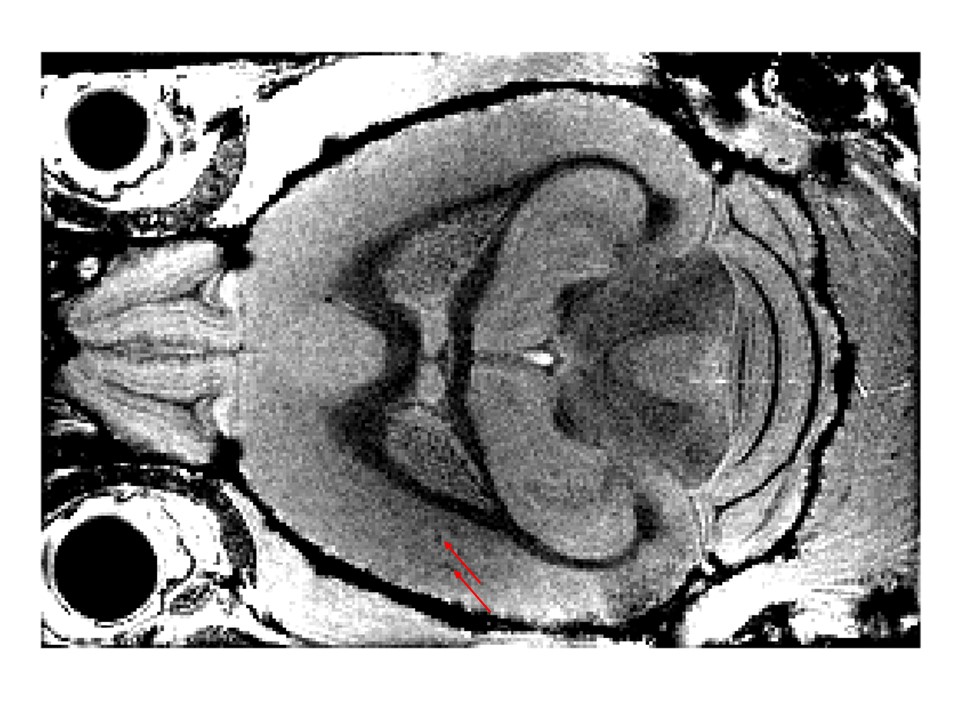
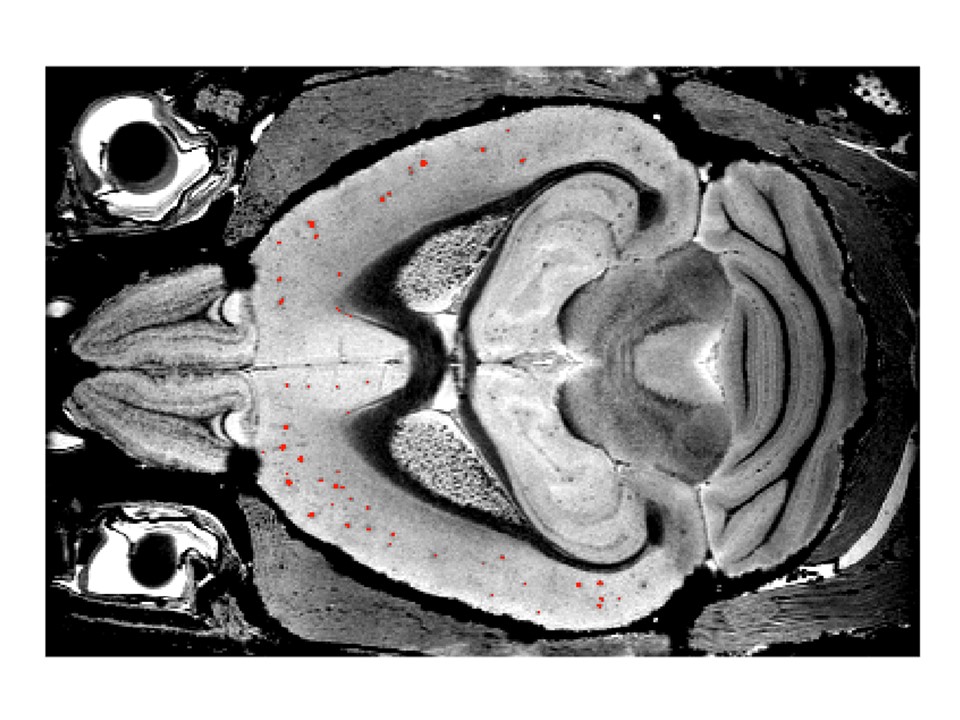
The first echoes of the MGE images exhibit a high SNR but a low CNR, whereas the last echoes have a low SNR and a high CNR. The different echoes allow to derive a T2* map and estimate the mean T2* values of gray matter and amyloid plaques. Thus, we calculate an optimal TE (25ms at 11.7T) to maximize the contrast between the plaques and the gray matter. A weighted sum of the echoes is then computed by giving more weight to the central echoes around 25 ms (Figure 1). The black dots, particularly present in the cortex, are the amyloid plaques. The SNR is 62.8 and the CNR between plaques and gray matter is 11.1. Whereas at 7T (Figure 2) the typical SNR is around 13 and the CNR between what seems to be amyloid plaques and grey matter is 2.5. One example result of the automatic plaques detection in the cortex is shown on Figure 3. At 11.7T the volume of cortex occupied by amyloid plaques is found around 2%.
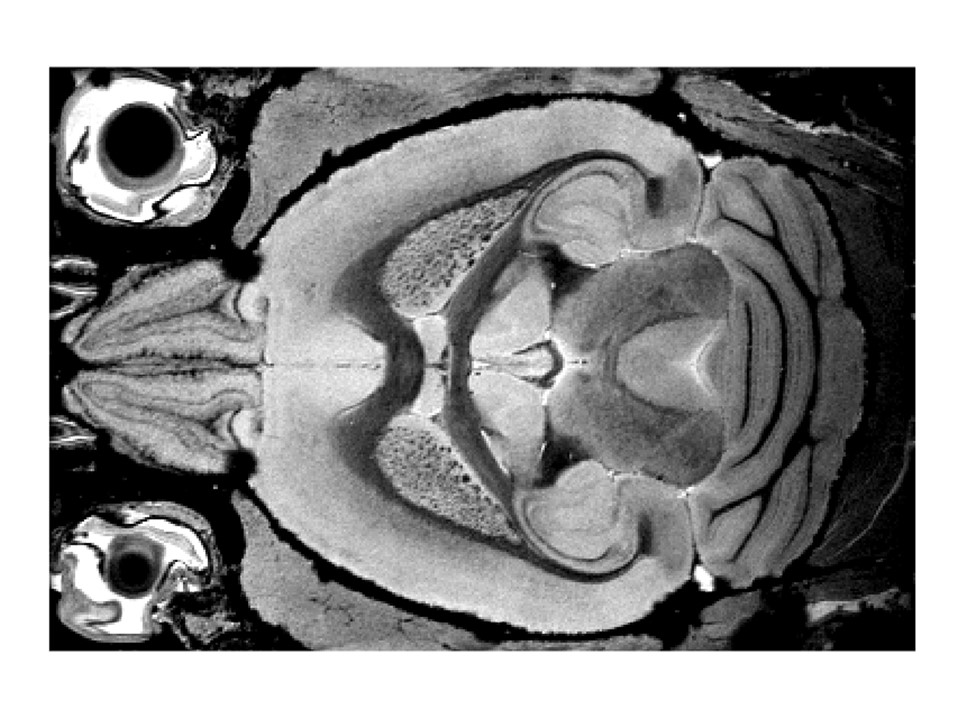
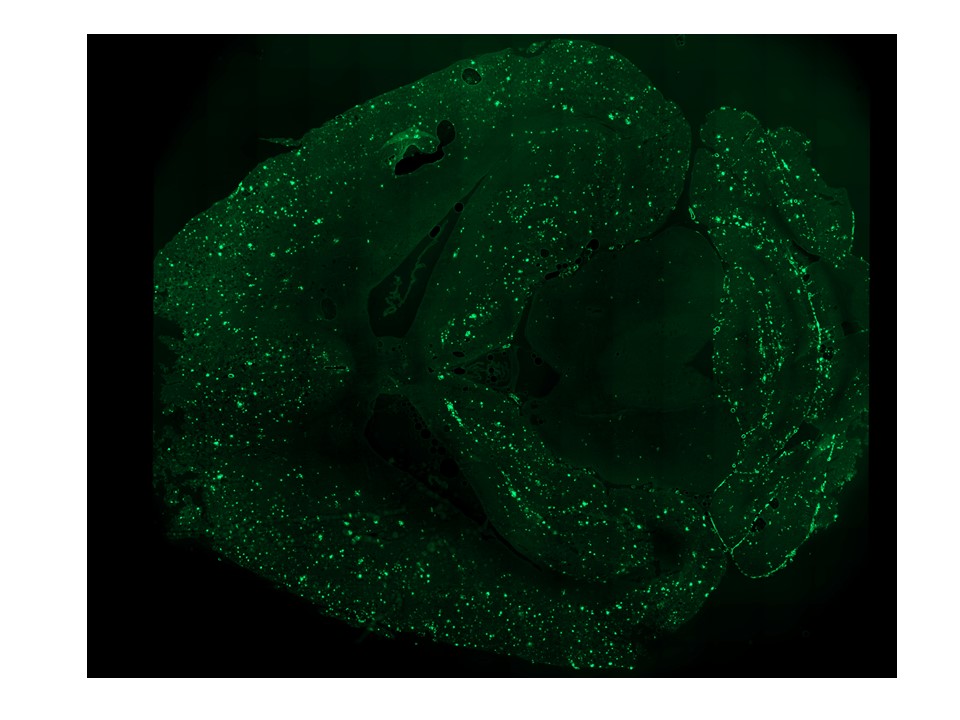
This work exhibits the increase of sensitivity obtained at 11.7T equipped with cryogenic surface coils compared to 7T equipped with regular surface coil. Amyloid plaques are clearly detected ex vivo, as evidenced when comparing the same sequence on APP/PS1dE9 mice and on their wild type littermates (Figure 4). Indeed no dark spots are visible in the cortex of the wild type mice. Correlation of this technique with histology of the plaques is ongoing work (Figure 5). The poor contrast of the images acquired at 7T (Figure 2) does not allow to well distinguish well the amyloid plaques from the cortex, only the biggest ones are visible. The main limitation of this technique is the issue of specificity to amyloid plaques. Firstly, T2* images are also very sensitive to the remaining blood in the brain: insufficiently perfused blood vessels will also give hyposignals, which requires additional image post-processing steps to distinguish blood vessels from amyloid plaques. Secondly, only the iron core of amyloid plaque is detected, which is smaller than the plaque itself. Amyloid load is therefore mis-estimated and histology will be key to calibrate this estimation.
Acknowledgements
No acknowledgement found.References
1. Leinenga G, Götz J. Scanning ultrasound removes amyloid-β and restores memory in an Alzheimer ’ s disease mouse model. Sci Transl Med. 2015;7(278).
2. Jendresen CB, Cui H, Zhang X, Vlodavsky I, Nilsson LNG, Li JP. Overexpression of heparanase lowers the amyloid burden in amyloid-β precursor Protein Transgenic mice. J Biol Chem. 2015;290(8):5053-5064.
Figures