3311
High-resolution neurite orientation dispersion and density imaging of mouse brain using compressed sensing at 9.4T1Center for In Vivo Microscopy, Department of Radiology, Duke University, Durham, NC, United States, 2Department of Biomedical Engineering, School of Medicine, Tsinghua University, Beijing, China
Synopsis
To evaluate the potentials of compressed sensing (CS) in quantification of neurite orientation dispersion and density imaging (NODDI) index of ex vivo mouse brain at high resolution (45 µm3 isotropic). We were able to achieve compression factors of 4X through judicious choice of k-space sampling pattern. The strong heterogeneous microstructure of corpus callosum (CC) regions were illustrated using different diffusion metrics and NODDI index.
Introduction
Diffusion tensor histology holds great promise for quantitative characterization of microstructure properties in human and mouse brains1,2. While higher angular and spatial resolution sampling schemes may provide more accurate results for various diffusion models, they also result in relatively long acquisitions. Therefore, any method to accelerate acquisitions is highly desirable. CS has emerged as a new framework that enables reconstruction of undersampled k-space data by exploiting image sparsity3. In this study, CS was applied for quantification of neurite orientation dispersion and density imaging (NODDI) of ex vivo mouse brain at high resolution (45 µm3 isotropic). The strong heterogeneous microstructure of corpus callosum (CC) regions was also illustrated using different diffusion metrics. To increase computational efficiency, we have adapted the CS reconstruction into a high-performance computing (HPC) environment.Methods
Animal experiments were carried out in compliance with the Duke University Institutional Animal Care and Use Committee. Wild-type adult male C57BL/6 mice specimens were chosen for MR imaging. All specimens were scanned at 9.4T (Oxford 8.9-cm vertical bore; Agilent VnmrJ 4.0 imaging console) using a modified 3D diffusion-weighed spin-echo pulse sequence with CS acceleration factor (AF) of 4. The repetition time (TR) was 100 ms, echo time (TE)=15.15 ms. DTI scans with eight b-values (1000, 2000, 3000, 4000, 5000, 6000, 7000, 8000 s/mm2) were acquired with 45 µm3 isotropic spatial resolution. The diffusion sampling protocol for each b value included 48 unique diffusion directions and 4 non-diffusion-weighted (b0) measurements. With AF=4, the total acquisition time was 24 hours for one b-value (one shell). The k-space sampling pattern (SPk) generated by a probability density function (PDF) for acquiring diffusion-weighted data was determined by parameters pa and pb using the equation: SPk=exp(-(pb*k/n)pa)4. CS reconstruction was applied to the undersampled k-space data slice by slice3. After the CS reconstruction, the diffusion tensor was calculated at each voxel and used to generate fractional anisotropy (FA) and mean diffusion coefficient (MD) maps. The multiple fiber orientation mapping was calculated using DSI Studio software5. The NODDI model for ex vivo data was fit using the NODDI toolbox (http://mig.cs.ucl.ac.uk)1. The estimated neurite density index (NDI) and orientation dispersion index (ODI) were generated and analyzed.Results
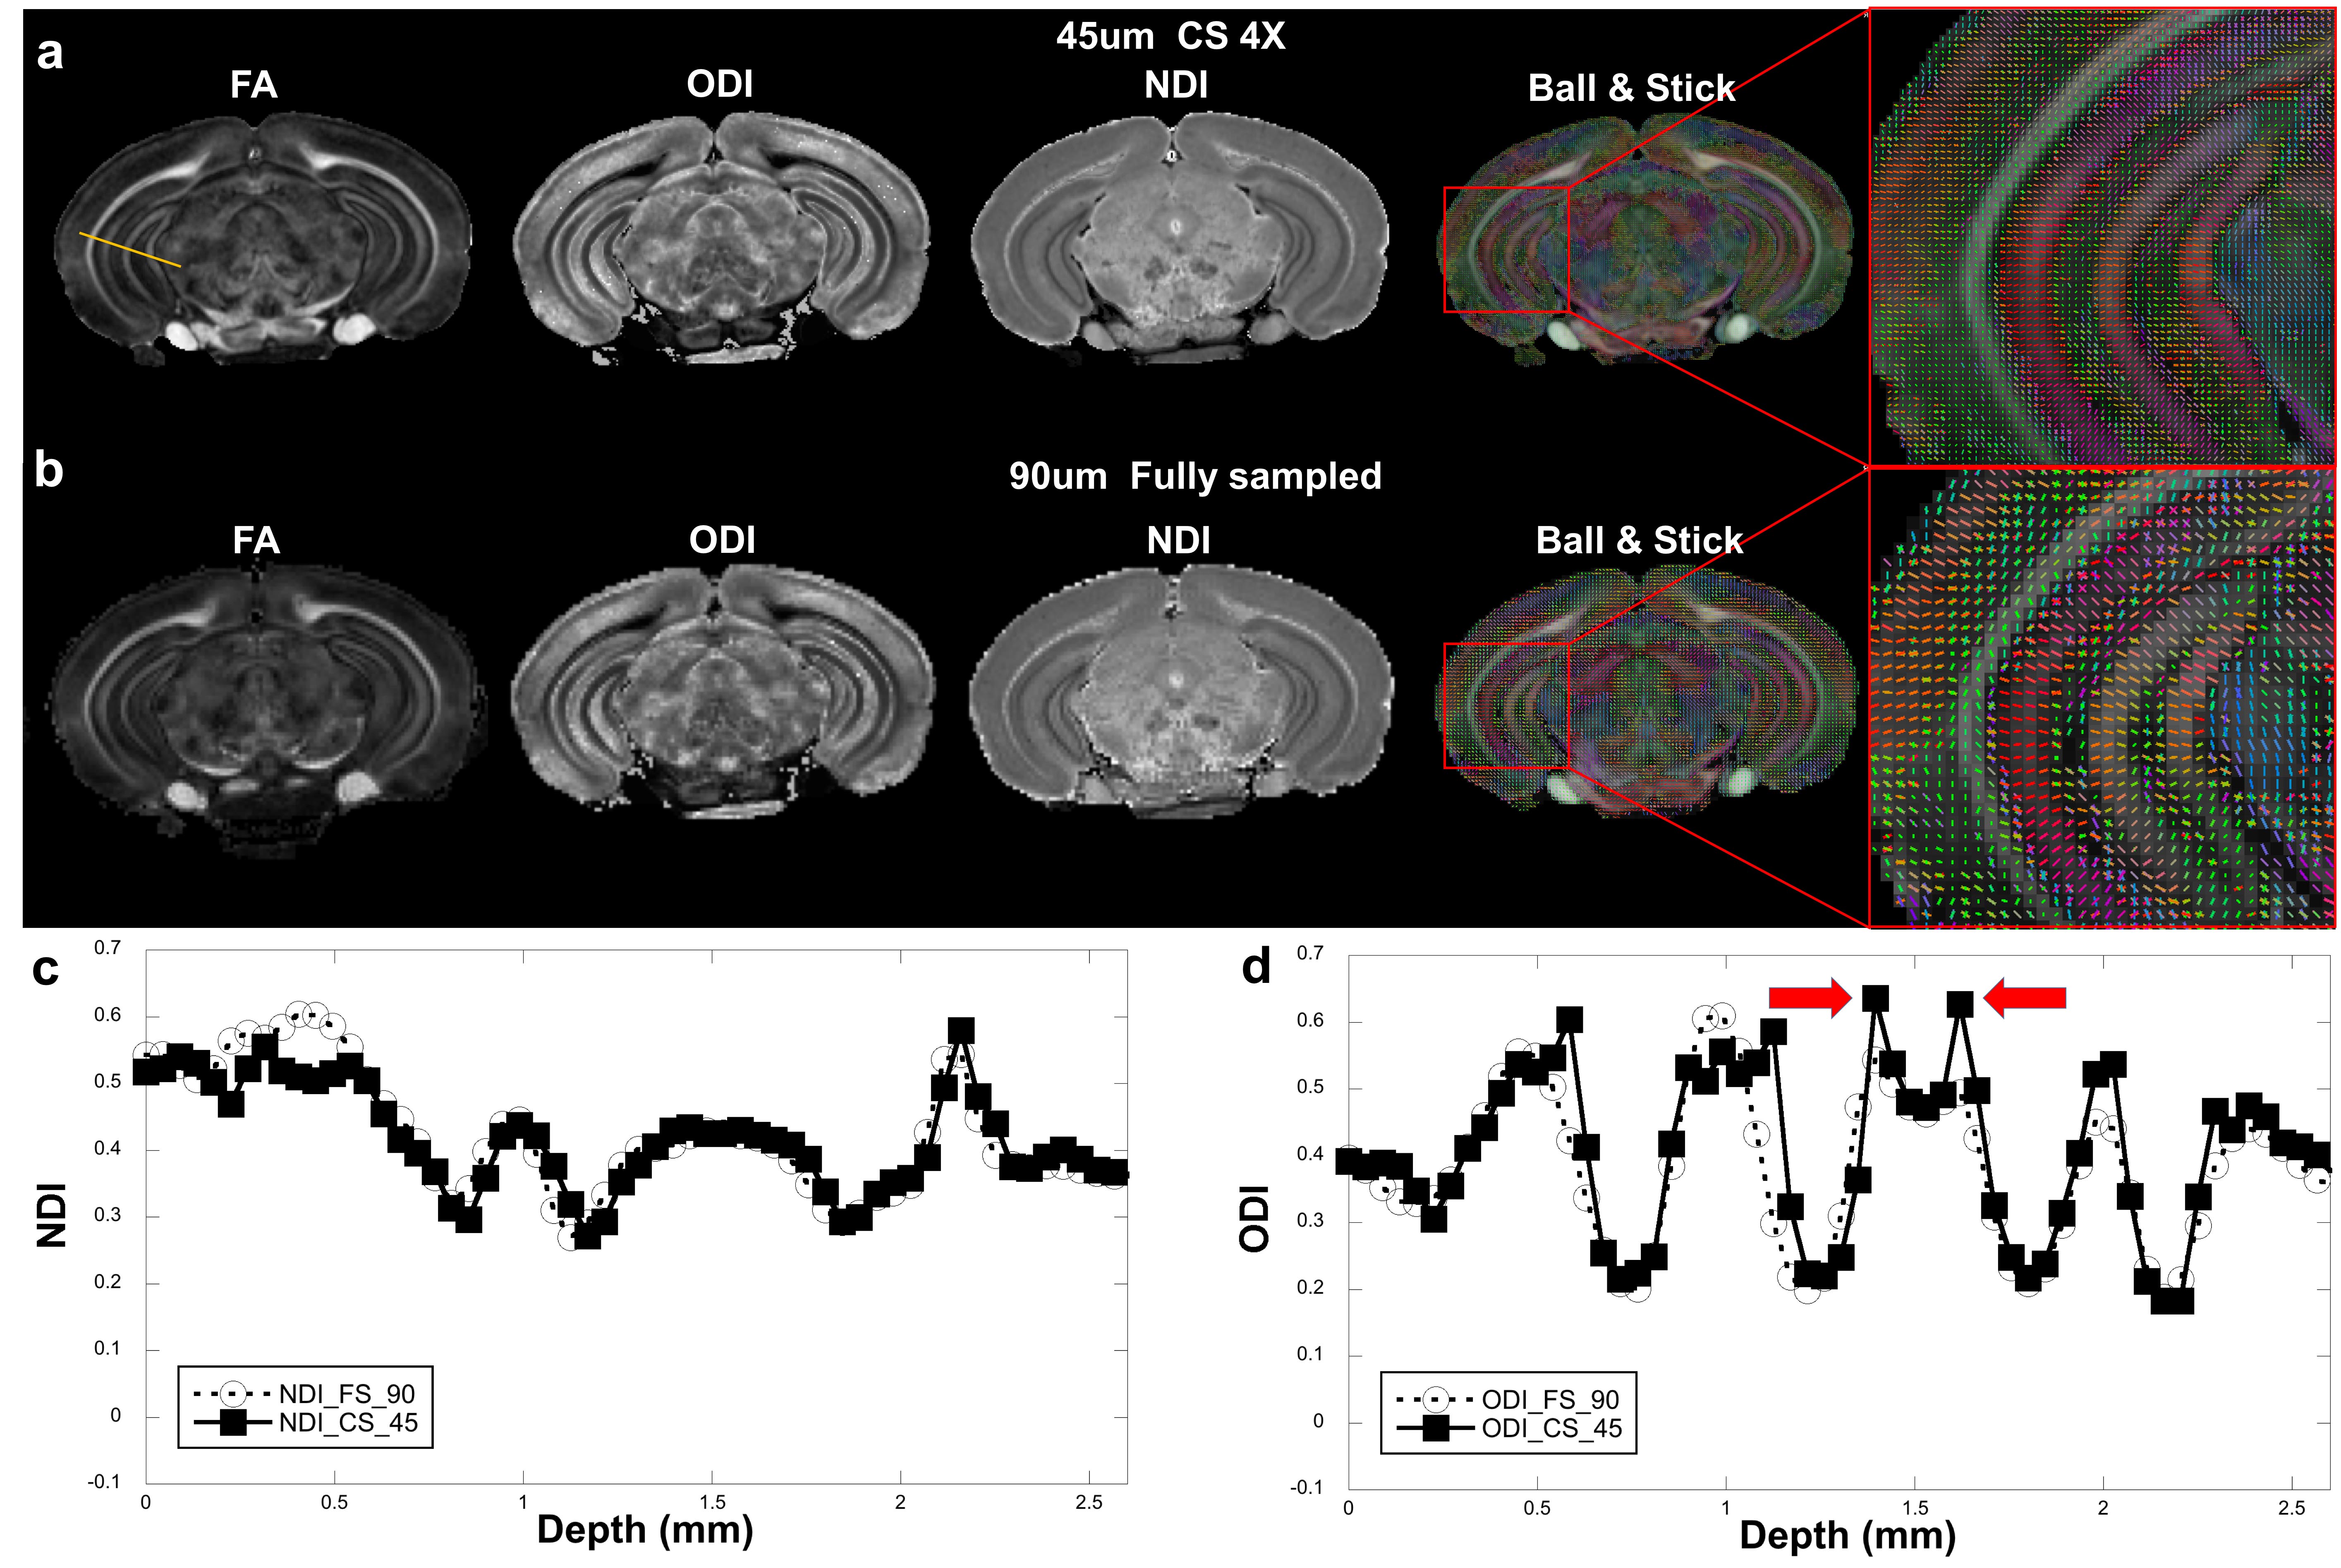
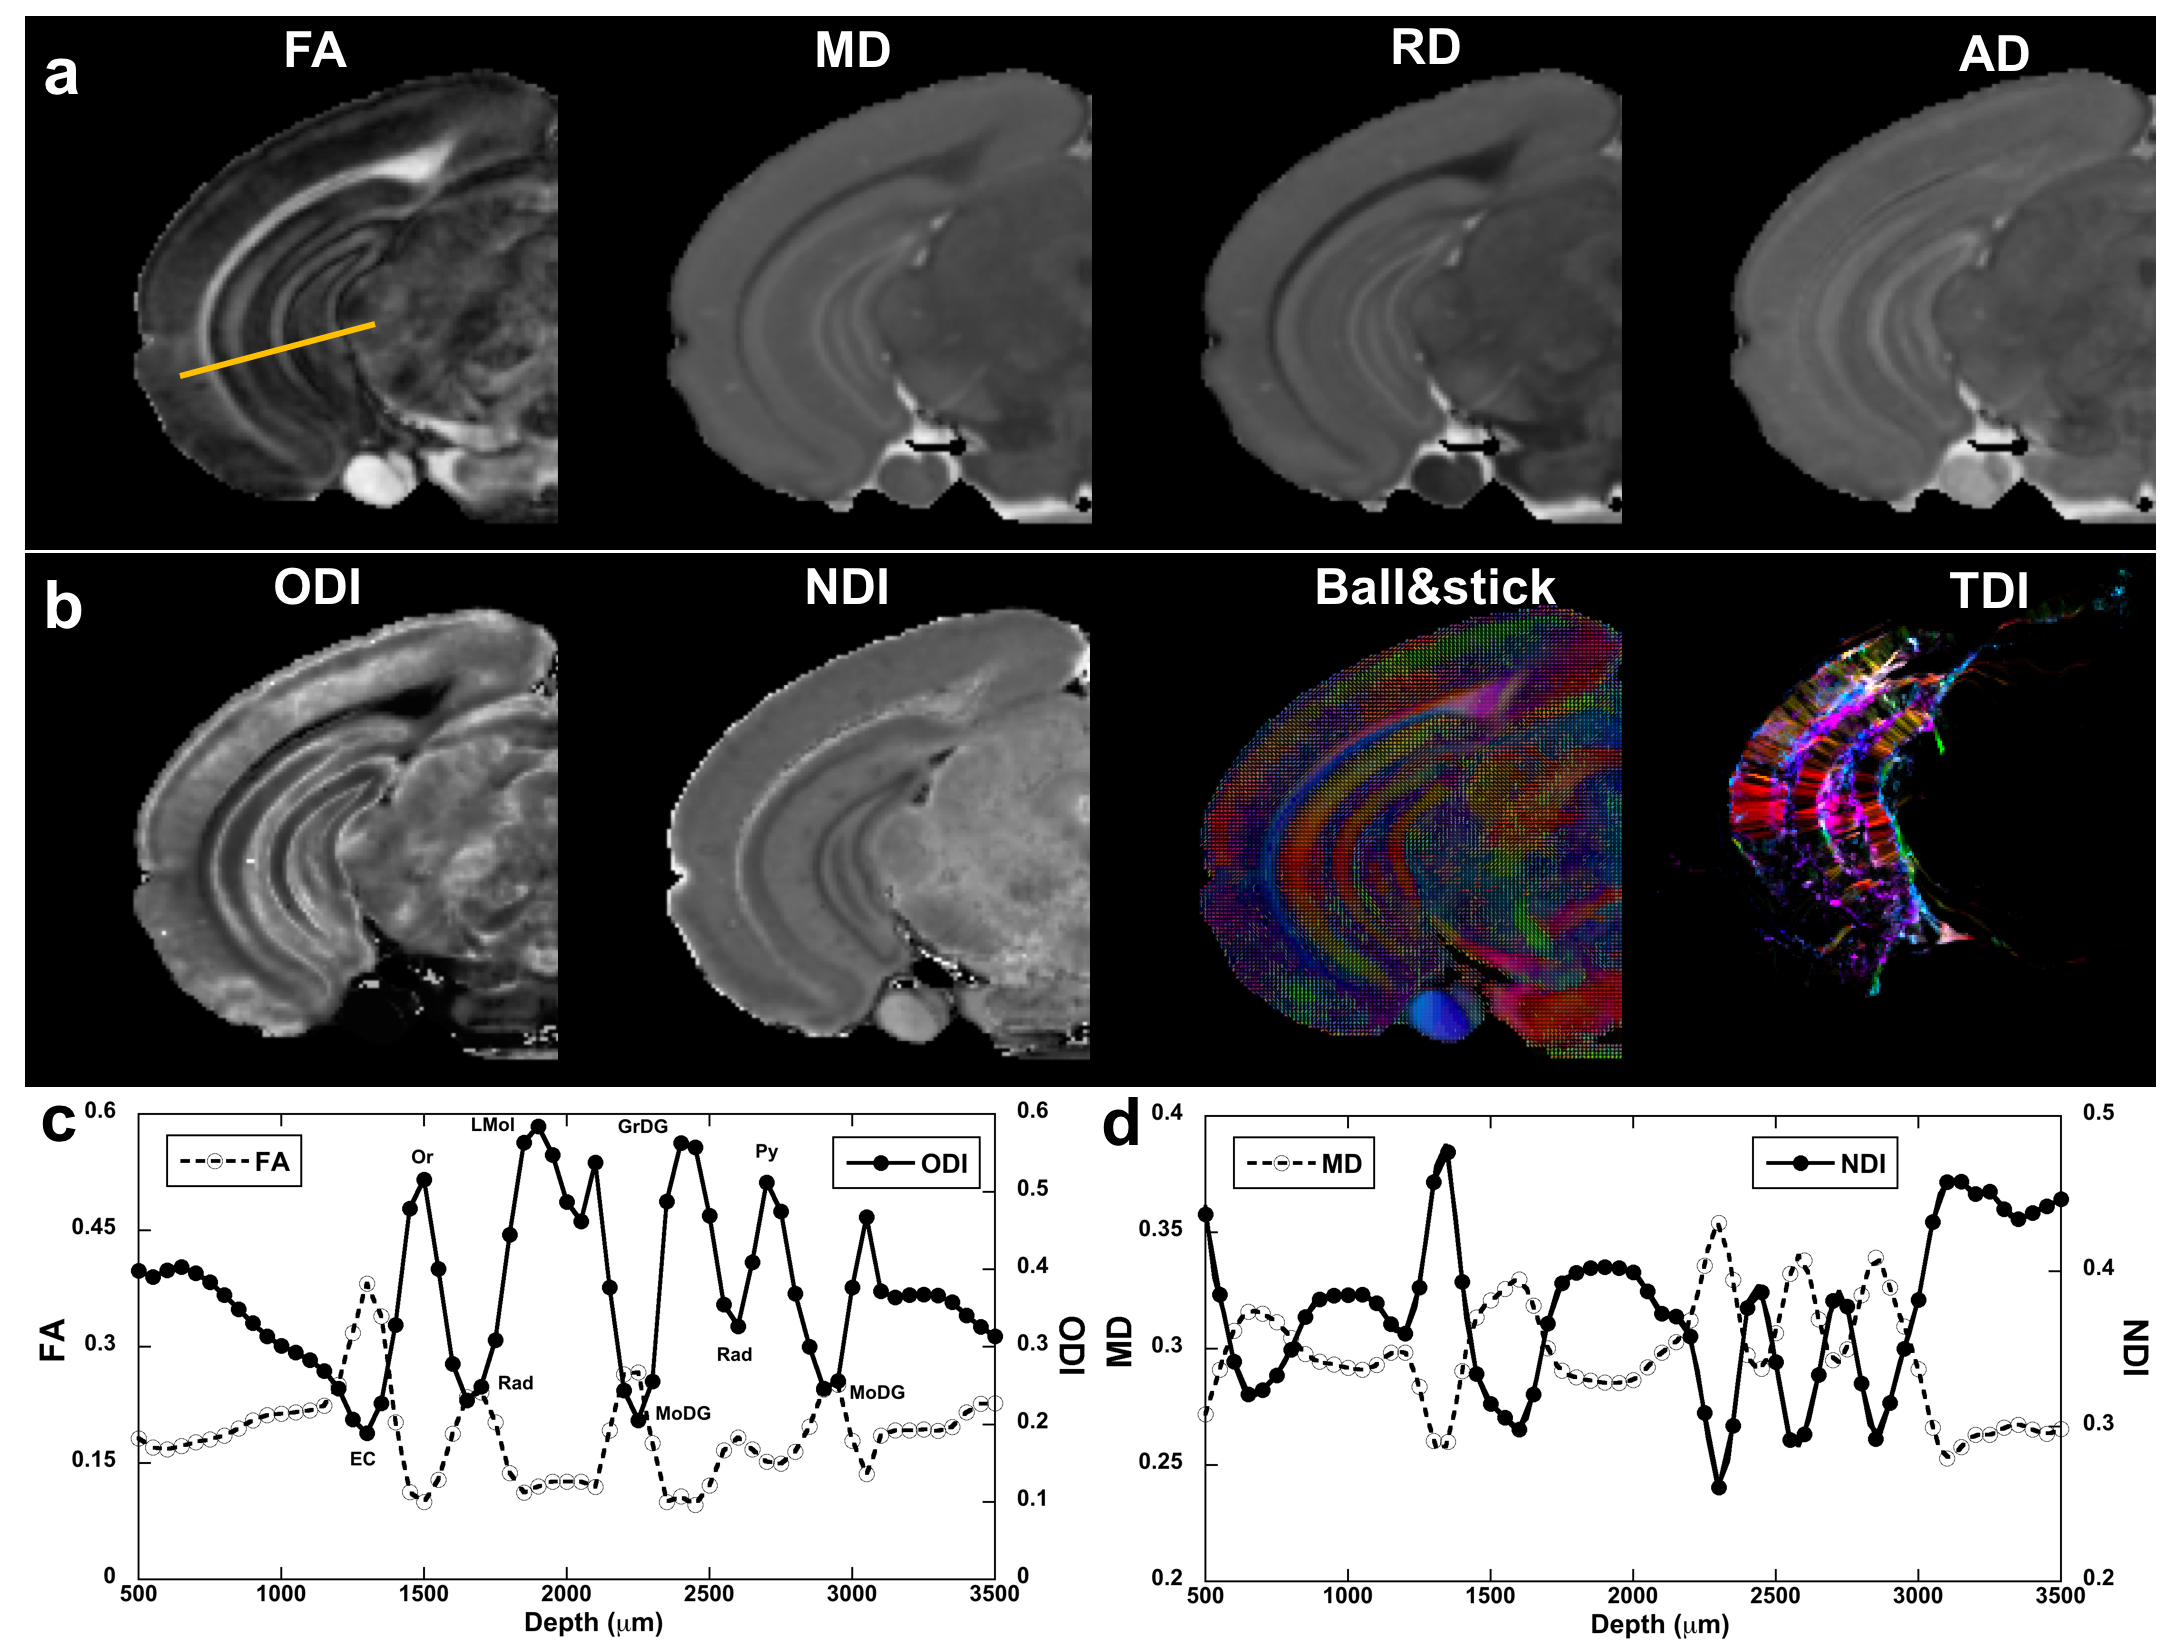
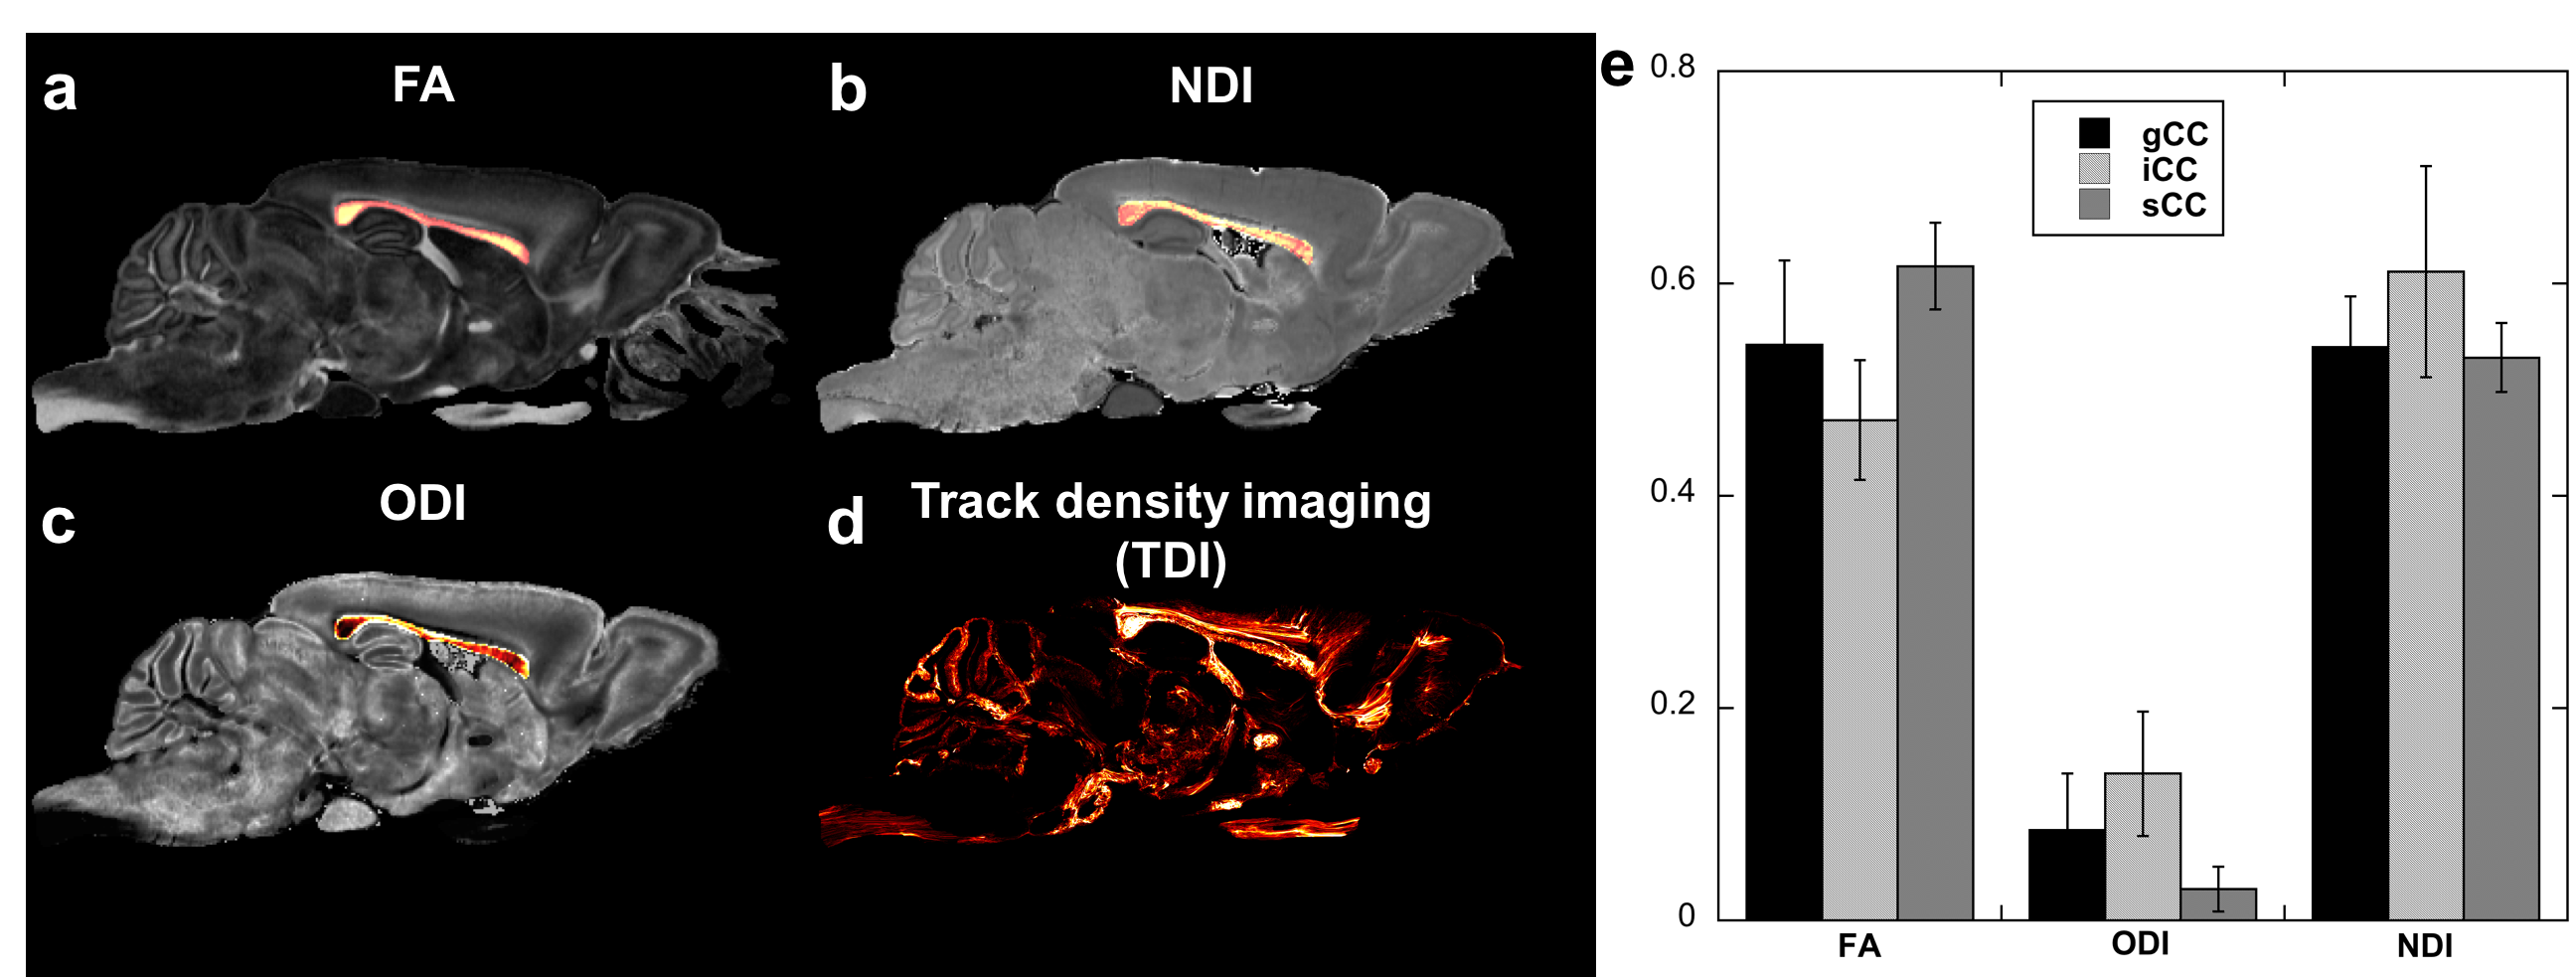
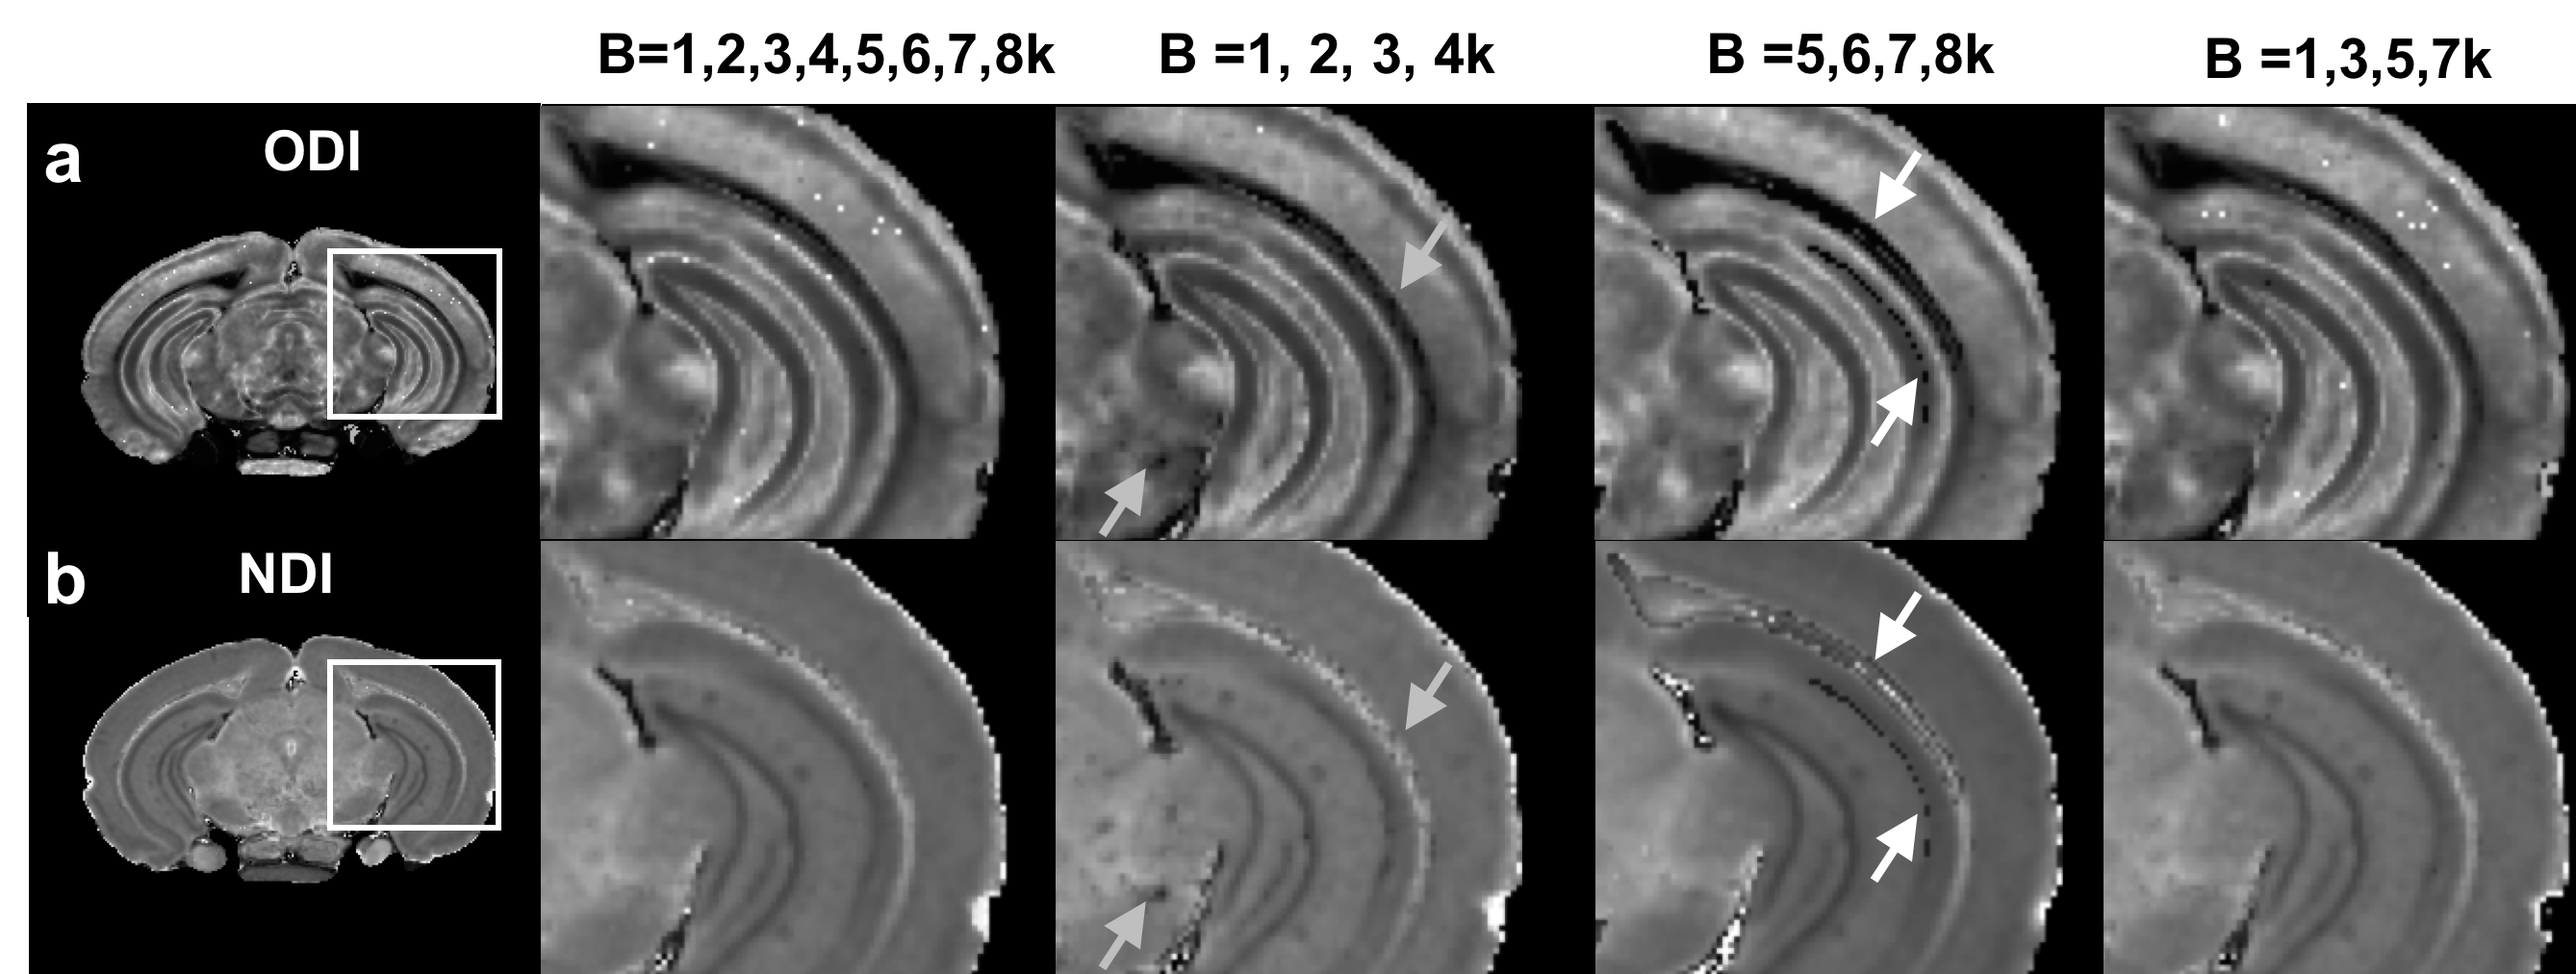
Figure 1 illustrated the FA, ODI, NDI, and multiple fiber orientation mappings of undersampled data at 45 µm3, compared with fully sampled results at 90 µm3. Both ODI and NDI derived from CS reconstruction showed no apparent artifacts with major information qualitatively preserved. The profiles in Fig 1c, 1d between CS results and fully sampled results confirmed the robust nature of the CS reconstruction, while subtle laminar structures could be observed with higher resolution with CS results (red arrows). Figure 2 compared FA, MD, ODI and NDI mappings and profiles. In general, FA and ODI maps always showed opposite contrast, MD and NDI also showed opposite contrast. Laminar layers in the hippocampus region could be resolved using both DTI metrics and NODDI index (Fig 2c, 2d). The strong heterogeneity of corpus callosum region was revealed by FA, NDI, ODI maps, and confirmed by the track density maps, as shown in Figure 3. Both ODI and NDI had higher values in body/isthmus (iCC) region, while FA showed lower value in the same region. Figure 4 showed maps of ODI and NDI from different protocols for visual comparison, the full-shell protocol (8 shells) was used as the pseudo ground-truth. The estimated ODI and NDI showed visually inconsistent results in some specific areas (white arrows) while only using 4 shells with lower b-values (1000, 2000, 3000, 4000 s/mm2) or 4 shells with higher b-values (5000, 6000, 7000, 8000 s/mm2). The results were more consistent with the pseudo ground-truth when using 4 shells, which covered the b-values from lower to higher (1000, 3000, 5000, 7000 s/mm2).Discussion and Conclusion
With a variable density undersampling pattern for k space acquisition and nonlinear CS reconstruction, both DTI metrics (FA and MD) and NODDI index (ODI and NDI) showed good agreement with the fully sampled data. The robust NODDI index estimation is strongly affected by the diffusion strategy used (b-value selection scheme). The strong heterogeneous microstructure properties of corpus callosum (CC) regions were illustrated using different diffusion metrics. In conclusion, CS holds the potential for quantification whole brain microstructure properties for both high spatial and angular resolutions.Acknowledgements
This work was supported by NIH/NIBIB P41 EB015897, 1S10ODO10683-01,NIH/NINDS 1R01NS096720-01A1.References
1. Zhang H, Schneider T, Wheeler-Kingshott CA, Alexander DC. NODDI: practical in vivo neurite orientation dispersion and density imaging of the human brain. Neuroimage 2012;61(4):1000-1016.
2. Hutchinson EB, Avram AV, Irfanoglu MO, Koay CG, Barnett AS, Komlosh ME, Ozarslan E, Schwerin SC, Juliano SL, Pierpaoli C. Analysis of the effects of noise, DWI sampling, and value of assumed parameters in diffusion MRI models. Magn Reson Med 2017;78(5):1767-1780.
3. Lustig M, Donoho D, Pauly JM. Sparse MRI: The application of compressed sensing for rapid MR imaging. Magn Reson Med 2007;58(6):1182-1195.
4. Wang N, Badar F, Xia Y. Compressed sensing in quantitative determination of GAG concentration in cartilage by microscopic MRI. Magn Reson Med 2017.
5. Yeh FC, Wedeen VJ, Tseng WY. Generalized q-sampling imaging. IEEE Trans Med Imaging 2010;29(9):1626-1635.
Figures