3309
MR spectroscopy of mouse spinal cord injury at 9.4 Tesla1Centre for Advanced Imaging, University of Queensland, Brisbane, Australia, 2Najran University, Najran, Saudi Arabia, 3School of Biomedical sciences, The University of Queensland, Brisbane, Australia
Synopsis
This study aims to measure metabolic changes in the acute and chronic stages of a mouse model of spinal cord injury (SCI) using MR spectroscopy. Animal groups consisted of sham, SCI, and SCI with an intravenous immunoglobulin (IVIG) treatment. This study showed that the NAA/Cho ratio can be used as a sensitive marker for chronic injury and testing the efficacy of IVIG to promote recovery.
Introduction and purpose
The first MR spectroscopy (MRS) study of intact mouse cervical spinal cord was reported in 2013 at 11.75 T (1). Very few studies have, however, employed MR spectroscopy following rodent SCI. The main obstacles for implementing this include the relatively small size of the spinal cord, magnetic susceptibility from both the surrounding bony structures and haemorrhaging at the injury site, and also physical movement of the spinal cord during the cardiac and respiratory cycles. All of these factors interfere with the ability of acquiring high quality MR spectra with sufficient signal-to-noise ratio. Previous studies in larger animals have shown that the phosphocreatine (PCr) level are reduced within four hours after rabbit SCI (2), and within six hours in pigs (3). In a rat model, significant reductions of N-acetylaspartate (NAA) and creatine (Cr) levels have also been reported rostral and caudal to the lesion epicentre (4). This study aimed to assess if MRS could be employed to study metabolic changes in a mouse model of SCI.Methods
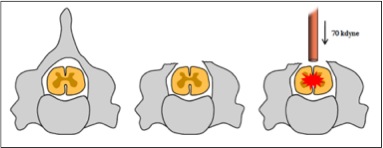
Animals and Surgical Procedures: A total of 8 female C57BL6/J mice at 12-16 weeks of age were randomly allocated to either sham surgery (laminectomy only) or SCI (n=4 per group). Mice were anesthetised using xylazine (10 mg/kg i.p.) and zolazepam (50 mg/kg i.p.), after which a dorsal laminectomy was performed and a severe contusive SCI inflicted (Figure 1). Muscle and skin were sutured, and post-operative care for each animal included one dose of buprenorphine (0.05 mg/kg) diluted in 1 ml of Hartmann's solution as well as a daily dose of gentamicin (1 mg/kg) for the first five days post-SCI. Bladder were expressed twice daily for the duration of the experiment, and hind limb locomotor abilities assessed at regular intervals post-injury using the Basso Mouse Scale (BMS) for locomotion (5).
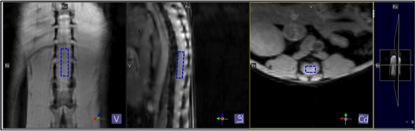
MR Acquisition: Mice were scanned using a Bruker Biospec 9.4T MRI with a 2x2 phase array receive coil in combination with an 86mm transmit only quadrature coil. In brief, mice were anesthetised using a mixture of isoflurane and oxygen, and positioned supine tail first lying on the receiver coil. Coronal, sagittal and axial structural images were acquired using FLASH (fast low angle shot) sequence to place the MRS voxel of interest (VOI) below the injury site at the lumber region (Figure 2). MRS data were acquired pre- and 3 and 30 days post-injury. Point-resolved spectroscopy (PRESS) sequence was acquired with variable power and optimized relaxation delays (Vapor) water suppression. Sequence parameters include TE 13.16 ms, TR 2000 ms, Averages 512, Bandwidth 4401.41 Hz, Voxel size 1.2×0.8×4.0 mm and scan time ≈17 mins.
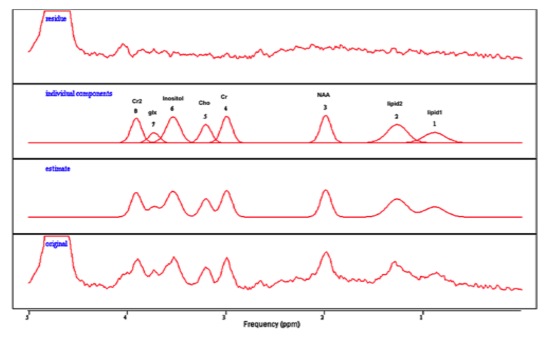
Data processing: MRS datasets were imported into jMRUI 5.0 software (6) for processing and quantification of metabolites (Figure 3). Numerical data were exported to Prism software and a 2way ANOVA with Tukey’s test for multiple comparisons were used for the statistical analysis. All data is presented as mean +/-SD.
Results and Discussion
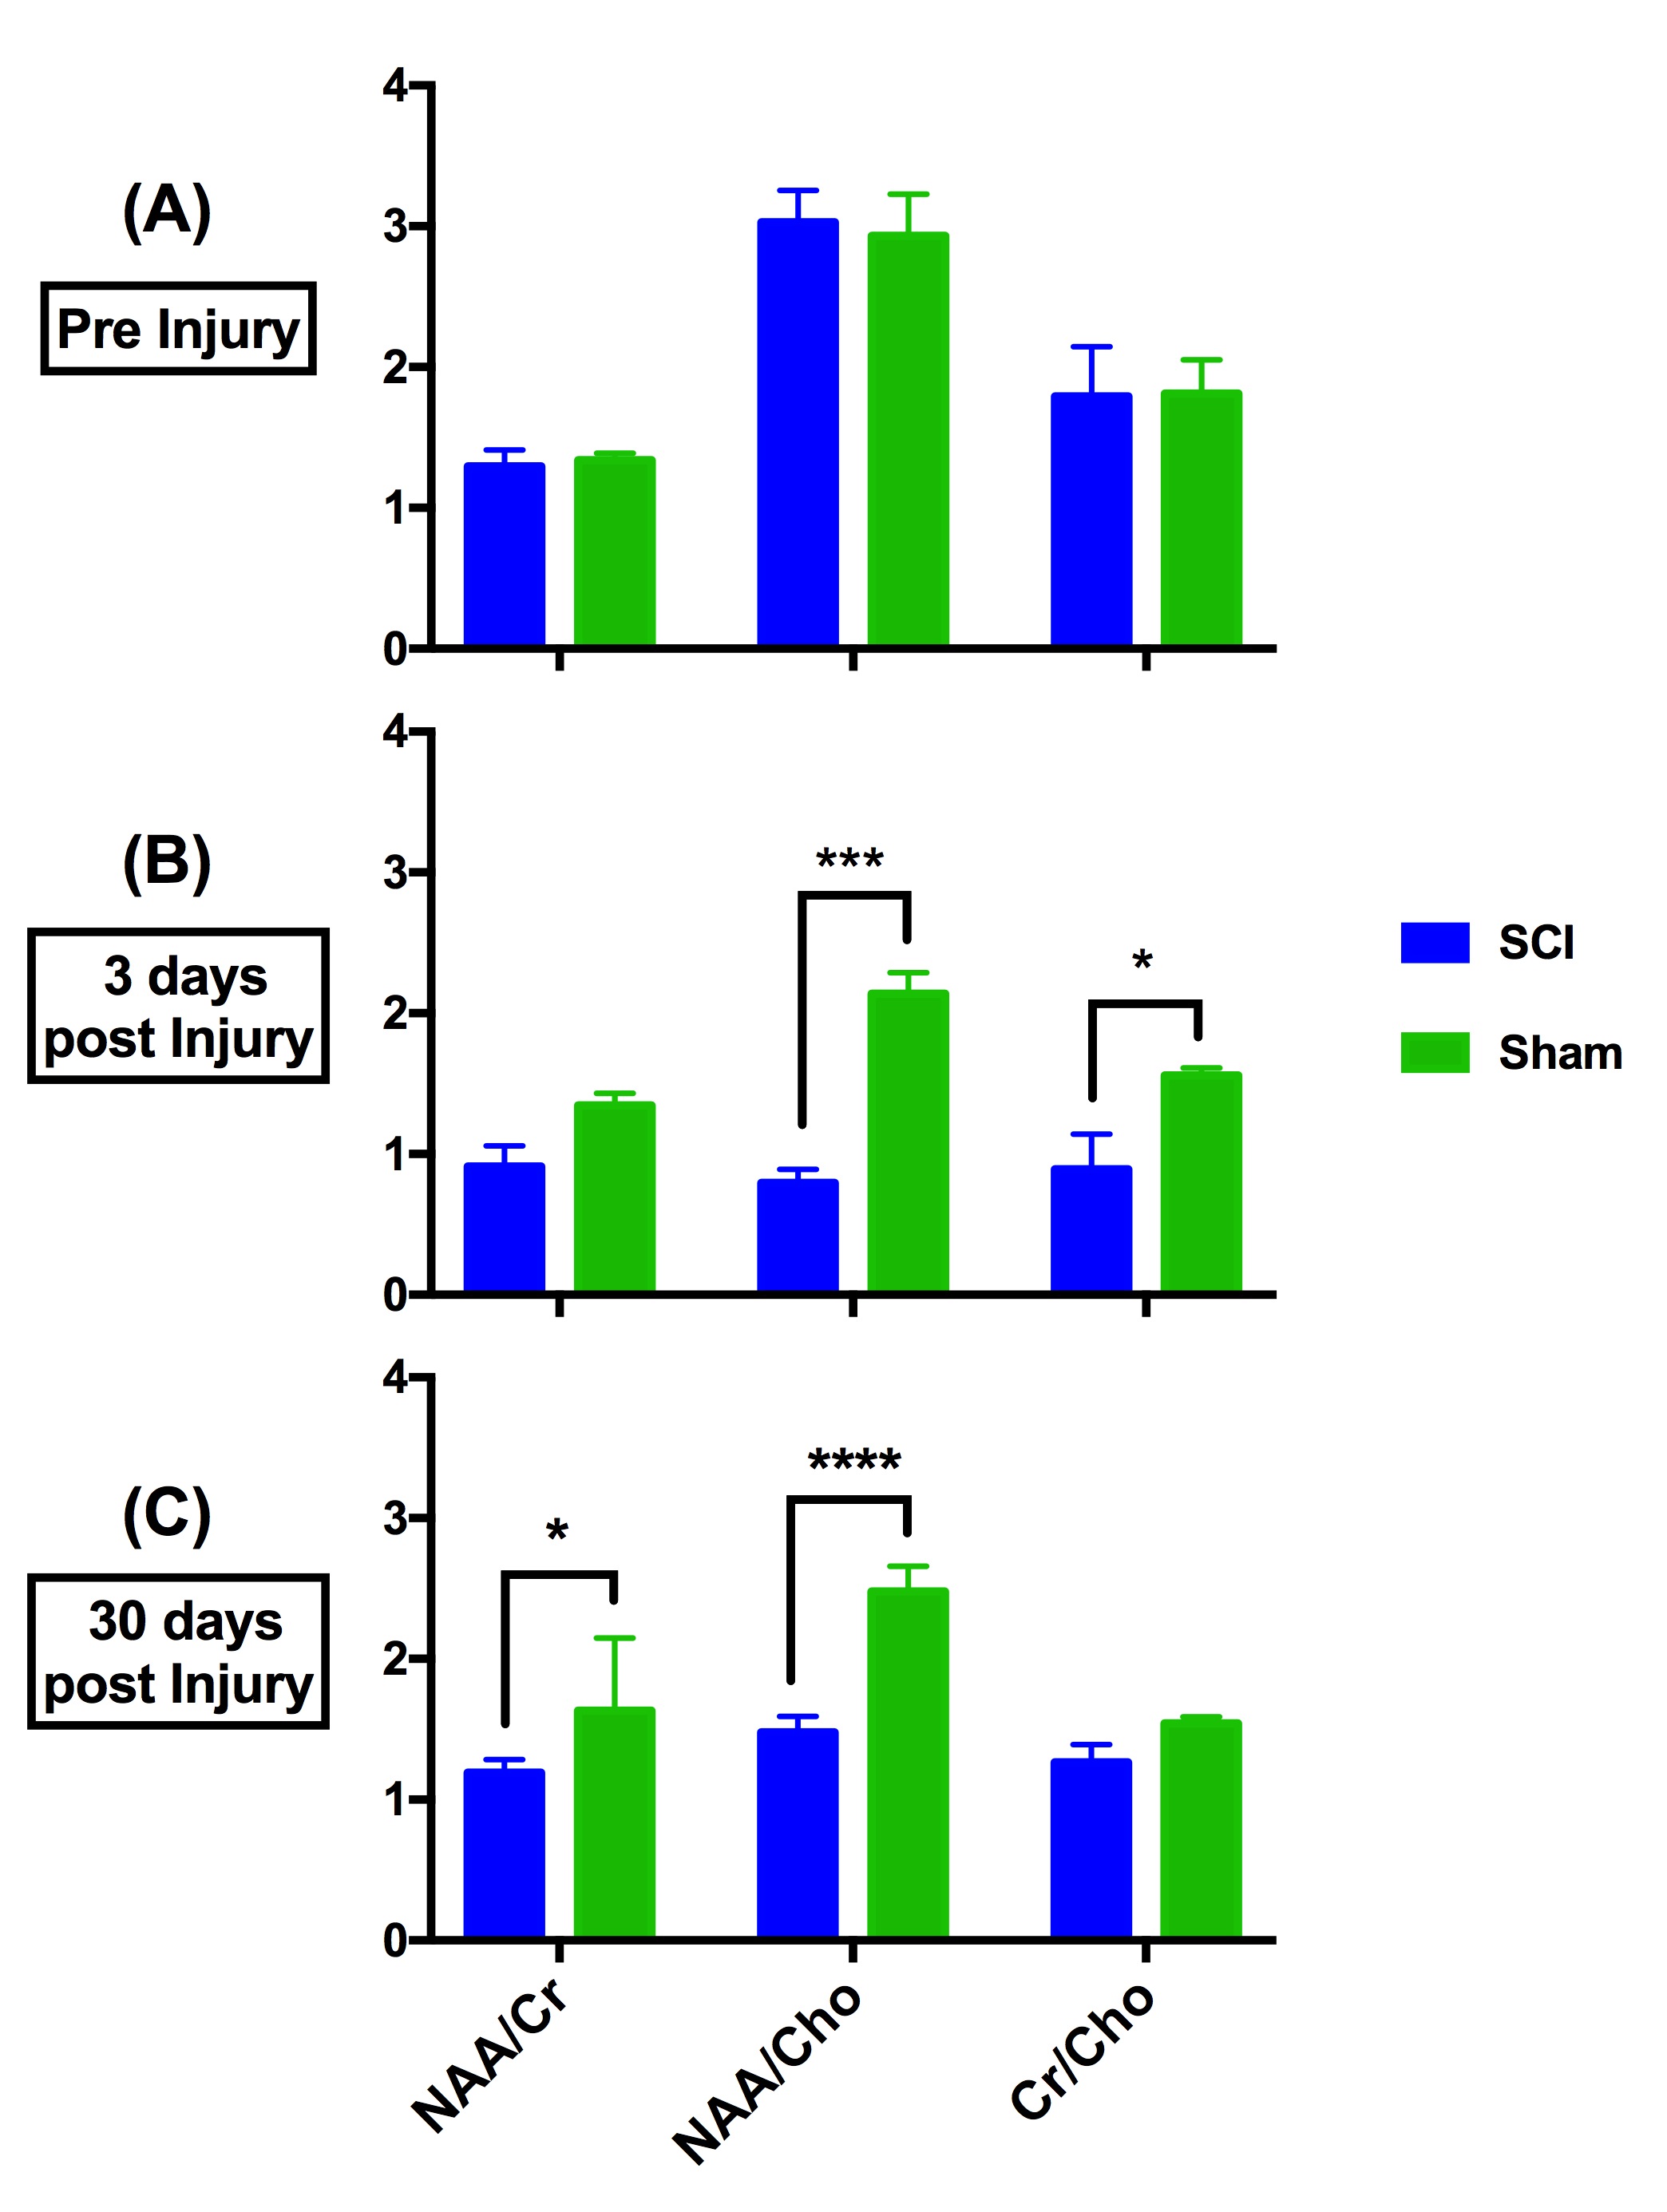
The pre-injury metabolite concentrations of NAA/Cr, NAA/Cho and Cr/Cho were not significantly different between the two groups (Figure 4A). At 3 days post injury (Figure 4B), there was a significant reduction in the NAA/Cho ratio for the SCI group (0.794±0.097) compared to sham mice (2.139±0.150, p=0.0001). Cr/Cho ratio also showed a significant different between SCI (0.891±0.251) and sham group (1.560 ± 0.052, p=0.0152). At the chronic stage (30 days post injury) (Figure 4C), NAA/Cho ratio was significantly reduced in SCI (1.477±0.116) compared to sham (2.478±0.181, p <0.0001). NAA/Cr ratios were found reduced in SCI (1.192±0.092) in comparison to the sham group (1.633±0.516) (p= 0.0412).
NAA is considered as a marker for neuronal integrity in many CNS diseases (7), and this decrease in NAA with SCI therefore likely reflects ongoing degeneration is ongoing (8) and neuronal dysfunction (9). Cr is a marker of gliosis (10) and Cho is an indicator of cellular membrane turnover and inflammation (4). Our MR spectroscopy study revealed a decrease in NAA and potentially an increase in Cho after SCI.
Conclusion
The NAA/Cho ratio may have prognostic value as a marker for determining the extent of SCI damage. This study showed that the NAA/Cho ratio was reduced at the acute and chronic phase of SCI.Acknowledgements
We thank Mrs. Chantelle Reid for her assistant in the animal spinal cord injury surgeries. Research reported in this study is supported by SpinalCure Australia and the National Health and Medical Research Council of Australia (Project Grant 1060538).References
1. Tachrount M, Duhamel G, Laurin J, Marqueste T, de Paula AM, Decherchi P, et al. In vivo short TE localized 1H MR spectroscopy of mouse cervical spinal cord at very high magnetic field (11.75 T). Magnetic Resonance in Medicine. 2013;69(5):1226-32.
2.Vink R, Noble LJ, Knoblach SM, Bendall MR, Faden AI. Metabolic changes in rabbit spinal cord after trauma: magnetic resonance spectroscopy studies. Annals of neurology. 1989;25(1):26-31.
3.Akino M, O'DONNELL JM, Robitaille P-ML, Stokes BT. Phosphorus-31 magnetic resonance spectroscopy studies of pig spinal cord injury: myelin changes, intracellular pH, and bioenergetics. Investigative radiology. 1997;32(7):382-8.
4.Qian J, Herrera JJ, Narayana PA. Neuronal and axonal degeneration in experimental spinal cord injury: in vivo proton magnetic resonance spectroscopy and histology. Journal of neurotrauma. 2010;27(3):599-610.
5.Basso DM, Fisher LC, Anderson AJ, Jakeman LB, Mctigue DM, Popovich PG. Basso Mouse Scale for locomotion detects differences in recovery after spinal cord injury in five common mouse strains. Journal of neurotrauma. 2006;23(5):635-59.
6.Stefan D, Di Cesare F, Andrasescu A, Popa E, Lazariev A, Vescovo E, et al. Quantitation of magnetic resonance spectroscopy signals: the jMRUI software package. Measurement Science and Technology. 2009;20(10):104035.
7.Moffett JR, Ross B, Arun P, Madhavarao CN, Namboodiri AM. N-Acetylaspartate in the CNS: from neurodiagnostics to neurobiology. Progress in neurobiology. 2007;81(2):89-131.
8.Erschbamer M, Öberg J, Westman E, Sitnikov R, Olson L, Spenger C. 1H‐MRS in spinal cord injury: acute and chronic metabolite alterations in rat brain and lumbar spinal cord. European Journal of Neuroscience. 2011;33(4):678-88.
9.Pattany PM, Yezierski RP, Widerström-Noga EG, Bowen BC, Martinez-Arizala A, Garcia BR, et al. Proton magnetic resonance spectroscopy of the thalamus in patients with chronic neuropathic pain after spinal cord injury. American Journal of Neuroradiology. 2002;23(6):901-5.
10.Sajja BR, Wolinsky JS, Narayana PA. Proton magnetic resonance spectroscopy in multiple sclerosis. Neuroimaging clinics of North America. 2009;19(1):45-58.
Figures