3307
In vivo characterization of cerebellar microglia activation in multiple sclerosis by combined 11C-PBR28 MR-PET and 7 Tesla MRI.1Radiology, Massachusetts General Hospital, Athinoula A. Martinos Center for Biomedical Imaging, Boston, MA, United States, 2Harvard Medical School, Boston, MA, United States, 3Neurology, Massachusetts General Hospital, Boston, MA, United States, 4Neurology, Beth Israel Deaconess Medical Center, Boston, MA, United States
Synopsis
We assessed microglia activation in the cerebellum and its relationship to clinical parameters in 27 subjects with multiple sclerosis (MS) and 18 healthy controls by using integrated 3 Tesla magnetic resonance-positron emission tomography imaging with 11C-PBR28.
The MS cohort showed increased cerebellar microglia activation in both lesioned and normal appearing cerebellum. The highest microglia activation was found in lesions, mainly concentrated in the cerebellar white matter in relapsing remitting patients, and extensively involving the cortical grey matter in progressive patients. In MS, the tracer uptake in the cerebellar white matter correlated with neurological disability and impaired cognitive performance.
Introduction
Cerebellar involvement occurs early in multiple sclerosis (MS), and is associated with neurological impairment and disability progression1. Neuropathological cerebellar examinations in MS reported heterogeneous processes including demyelination, neurodegeneration and microglia activation2. The role of microglia in the pathogenesis of cerebellar pathology is unknown. Activated microglia upregulate expression of the 18kDa translocator protein (TSPO)3, which can be imaged in vivo using the 11C-PBR28 radioligand.Objectives
We investigated, using integrated 3 Tesla (3T) magnetic resonance-positron emission tomography (MR-PET) imaging with 11C-PBR28, TSPO expression in lesioned and non-lesioned white and grey matter (WM, GM) in the cerebellum of a heterogeneous MS cohort, and its association with cerebellar lesions, atrophy and clinical parameters. Cerebellar lesions were characterized using ultra high resolution 7 Tesla (7T) MRI.Methods
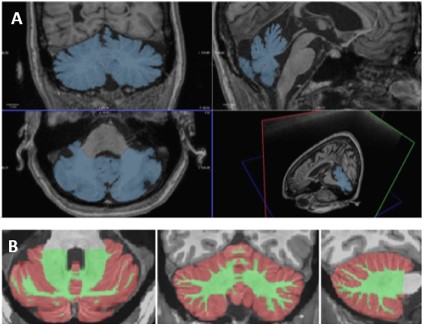
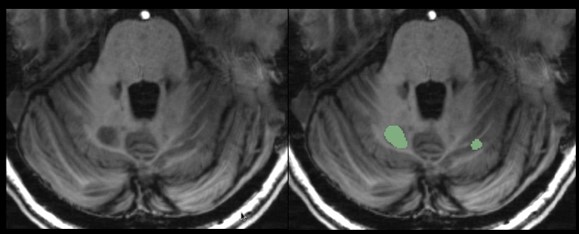
Twenty-seven patients with MS (13 relapsing-remitting, RRMS, 14 secondary progressive, SPMS) and 18 healthy controls (HC) matched for age and PBR28 affinity, were included in the study. All subjects underwent 90-min 11C-PBR28 MR-PET. Anatomical 3T images of the cerebellum were acquired and manual segmentation was performed to extract whole cerebellum (WHC) masks on Freesurfer (Figure 1A). In patients, normal appearing WHC (NAWHC) was obtained by subtracting the lesion masks to the WHC mask using FSL. Cerebellar WM and GM were segmented using Volbrain (Figure 1B), and volumes were normalized by total intracranial volume in Freesurfer. In patients, cerebellar lesions were segmented on 7 T T1-weighted images (0.6x0.6x1.5 mm3) obtained on a separate session by using Slicer v 4.2 (Figure 2). Quantification of 11C-PBR28 uptake in the WHC, NAWHC, GM, WM and cerebellar lesions (CL) was performed using 60-90 minutes standardized uptake values normalized by a pseudoreference region in the normal appearing basal ganglia4. Tracer uptake was extracted in cerebellar lesions that have been grouped according to localization: cortical (CCL), leukocortical (LCL), deep grey matter (DGML), and purely WM lesions (WML). All patients underwent neurological and cognitive assessment by Expanded Disability Status Scale (EDSS)5 and Symbol Digit Modalities Test (SDMT)6. Linear regression models were used to compare cerebellar 11C-PBR28 uptake in MS patients versus controls, and to assess their relationship with EDSS. Age and binding affinity were included as covariates of no interest. Spearman correlation coefficient was used to assess the association between clinical parameters (EDSS, SDMT) and uptake values. Matched-pair T-test was performed to search for differences in lesion uptake between different regions of interest.Results
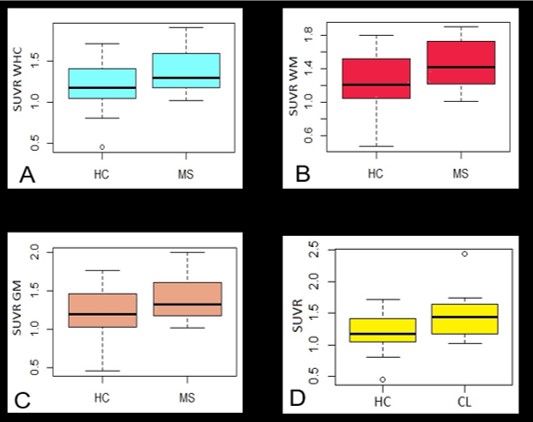
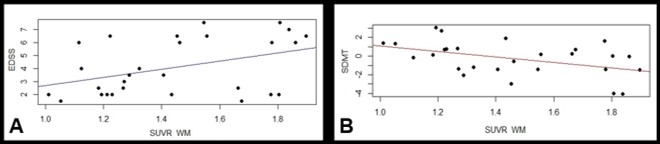
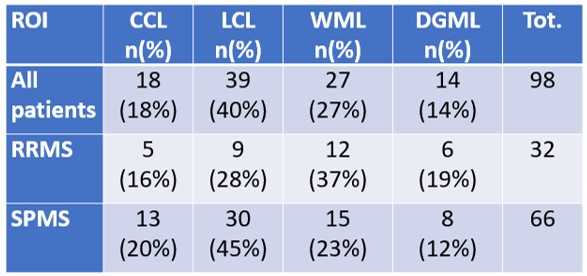
Mean age for patients was 48±10 years, EDSS ranged from 1.5 to 7.5 (median 3.5, mean 4.0). Mean age for HC was 49±12 years. Cerebellar lesions were found in 13 out of 14 SPMS and in 10 out of 13 RRMS. The spatial distribution of cerebellar lesions is showed in Table 1. In RRMS, most of the lesions are localized in the WM; in progressive patients, a majority of leucocortical and cortical lesions has been detected. No significant differences in the uptake were found in lesions affecting different regions in the cerebellum, when considering all patients as one group, and after separating SPMS and RRMS patients. Compared to controls, MS subjects showed significantly higher PBR28 uptake in all examined regions: WHC (p=0.04), NAWHC (p=0.05), GM (p=0.04), WM (p=0.03) (Figure 3A, B, C). Within patients, the mean uptake was higher in lesions than in the rest of the parenchyma (1.45 versus 1.39) though not meeting statistica significance. There was a significant difference between global lesion uptake and the uptake in the WHC of the HC group (p=0.02, Figure 3D). No differences in uptake were found in SPMS versus RRMS. Tracer uptake in the WM correlated positively with EDSS (p=0.03, r= 0.40), and negatively with SDMT z-scores (p<0.01, r= -0.49) (Figure 4A-B). When corrected for age and tracer binding affinity, this significance became a trend for EDSS (p=0.07) but was maintained for SDMT (p=0.04). There was no correlation between cerebellar volume or cerebellar lesion load and tracer uptake in any of the regions examined.Discussion
Our data provide in vivo evidence for the presence of diffuse microglia activation in the cerebellum in MS. Interestingly, the highest increase in microglia activation was detected in lesions that were mainly concentrated in WM in RRMS, while they extensively involved the cortical cerebellar GM in SPMS. Abnormal microglia activation in the WM was related to increased neurological disability and worse cognitive performance in the whole MS group.Conclusions
MR-PET is a valid tool to estimate cerebellar neuroinflammation in patients with MS. Future studies will assess its longitudinal evolution in relation to structural pathology and clinical outcome.Acknowledgements
This study was supported by the Claffin Award, the National Multiple Sclerosis Society (NMSS; RG 4729A2/1), the US Army, Department of Defense (DoD; W81XWH-13-1-0112), an NMSS fellowship (FG-1507-05459; E.H.).References
1. Weier K, Penner IK, Magon S, Amann M, Naegelin Y, Andelova M, Derfuss T, Stippich C, Radue EW, Kappos L, Sprenger T – Cerebellar abnormalities contribute to disability including cognitive impairment in multiple sclerosis. PloS ONE 2014, 9, e86916.
2. Kutzelnigg A, Faber-Rod JC, Bauer J, Lucchinetti CF, Sorensen PS, Laursen PS, Stadelmann C, Bruck W, Rauschka H, Schmidbauer M, Lassmann H – Widespread demyelination in the cerebellar cortex in multiple sclerosis. Brain Pathol 2007, 17:3844.
3. Vowinckel E, Reutens D, Becher B, Verge G, Evans A, Owens T, Antel JP – PK11195 binding to peripheral benzodiazepine receptor as a marker of microglia activation in multiple sclerosis and experimental autoimmune encephalomyelitis. J Neurosci Res 1997, 50:345-353.
4. Herranz E, Giannì C, Louapre C, Treaba CA, Govindarajan S, Ouellette R, Loggia M, Sloane JA, Madigan N, Izquierdo-Garcia D, Ward N, Mangeat G, Granberg T, Klawiter EC, Catana C, Hooker JM, Taylor N, Ionete C, Kinkel RP, Mainero C – Neuroinflammatory component of gray matter pathology in multiple sclerosis. Ann Neurol 2016;80:776-790.
5. Kurtzke JF – Rating neurologic impairment in multiple sclerosis: an expanded disability status scale (EDSS). Neurology 1983, Nov;33(11): 1444-52.
6. Smith A – Symbol Digit Modalities Test. Los Angeles, CA: Western Psychological Services; 1982.
Figures