3300
Cortical T2* and QSM maps at 7T: test-retest reproducibility, similarity and differences.1Human Brain Research Center, Kyoto University, Kyoto, Japan, 2Siemens Healthcare K.K., Tokyo, Japan, 3Advanced Clinical Imaging Technology, Siemens Healthcare AG, Lausanne, Swaziland, 4Department of Radiology, University Hospital (CHUV), Lausanne, Swaziland, 5LTS5, École Polytechnique Fédérale de Lausanne (EPFL), Lausanne, Switzerland
Synopsis
R2* and QSM measurement of the cortex is important to investigate human brain pathology. The 7T-MRI has a large potential to provide high-resolution information; however, measurement reliability has not been much investigated. This study investigated test-retest measurement reliability of cortical R2* and QSM values in 16 healthy subjects. High-resolution 3D multi-echo GRE imaging values were mapped onto the cortical surface extracted using 3D MP2RAGE images. Average maps show similar results for both R2* and QSM with larger variance at the frontotemporal base. Except these areas, measurement of cortical R2* and QSM values were found to be reliable at 7T.
INTRODUCTION
Recent advances in MR imaging focus on the human cerebral cortex to investigate its regional differences using R1, R2*, QSM, neurite density, its orientation dispersion, etc. These quantitative values need reproducible and investigated in R1 values1, R2* & QSM2 at 7T. Reproducibility on the cortical measurements was investigated in the former, but whole brain was examined in the latter. Cortical layer-wise difference has also been observed on the 3 quantitative values3, but measurement reproducibility was not investigated. This study was conducted to clarify regional differences in test-retest reproducibility. Differences between R2* and QSM values were also investigated.METHODS
Sixteen subjects (mean 22.4, range 20-25 years old) were enrolled under approval of institutional review board, and scanned twice using a 7T scanner (Siemens Healthcare) for 3D MP2RAGE (prototype sequence) imaging (TR/TE 6000/2.9ms, FA1/FA2 4/5, TI1/TI2 800/2700ms, iPAT 3, isotropic 0.7mm, scan time 9:20)4,5 and 3D multi-echo gradient echo imaging (TR/TE1-TE4 4340/4.15-20.59ms, FA 8, iPAT 3, isotropic 0.5mm, scan time 10:26) with FID navigators for phase correction implemented based on MP2RAGE6. T1-weighted images and T1 maps were used to compute cortical boundary using HCP pipeline7. T2* map was calculated using linear fitting after log transformation of the signal intensity. QSM was created using STIsuite8. It should be noted that susceptibility is presented using negative values. Both T2* and QSM maps were co-registered to T1WI and mid-cortical values were obtained. Test and retest data sets were independently processed and compared. Average cortical maps of 16 subjects were generated, including coefficient of variation (CoV) maps for T2* and standard deviation (SD) maps for QSM. Region-wise PALS ROI9 values were calculated and analyzed.RESULTS
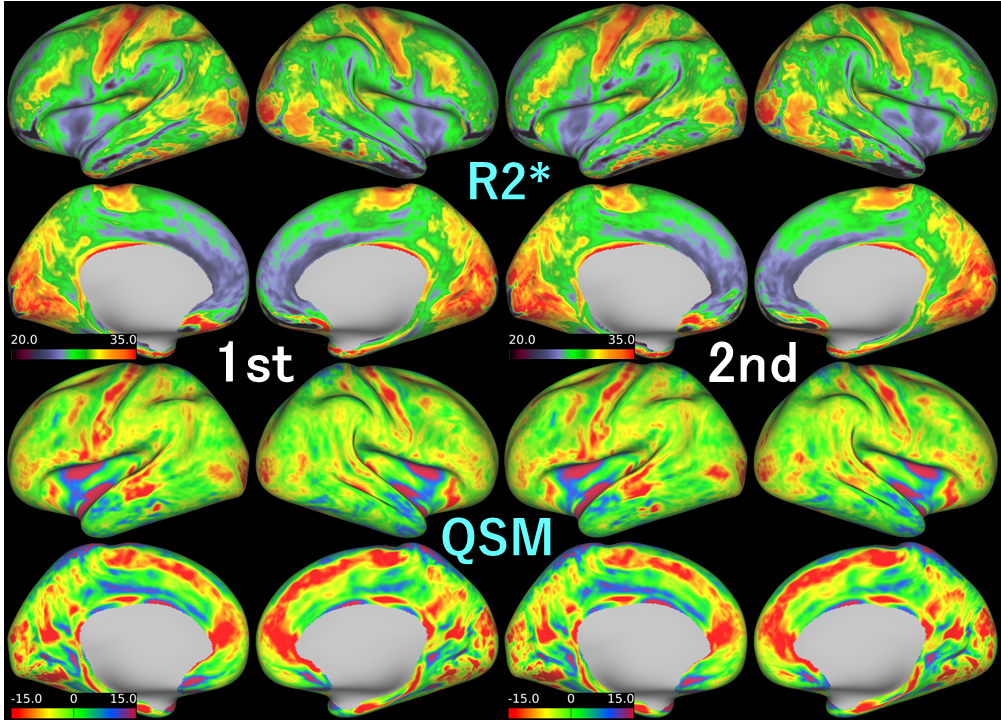
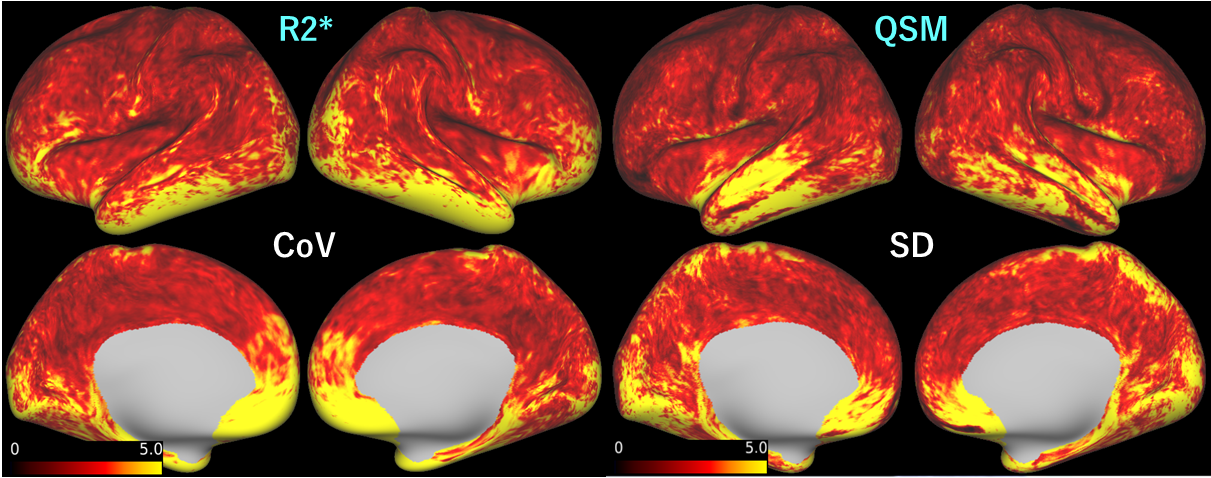
Both R2* and QSM maps show similar results between 1st and 2nd scans (Figure 1). Average R2* map shows elevated values at sensory-motor, visual including presumed V5 and auditory areas. Similar pattern was observed in the QSM maps with less saliency. In average maps of both R2*-CoV and QSM-SD, high values were observed mainly at temporal and frontal base (Figure 2). In QSM, however, higher values are also found at superior temporal gyrus and superior edge of the medial front-parietal areas. In ROI analysis, mean R2* and CoV values were 28.7 (range: 22.8 - 33.2) ms and 2.5 (0.9 - 7.0) %. Mean QSM and SD values were -16.8 (-133.3 - 84.8) bpm and 0.94 (0.32 - 2.43) bpm. In R2*, areas with CoV > 5% were found at bilateral entorhinal, rostral anterior cingulate, frontal pole and right temporal pole areas. In QSM, highest 10% SD areas were found at the same area with additional left transverse temporal area; however, bilateral frontal pole areas were not included.DISCUSSION
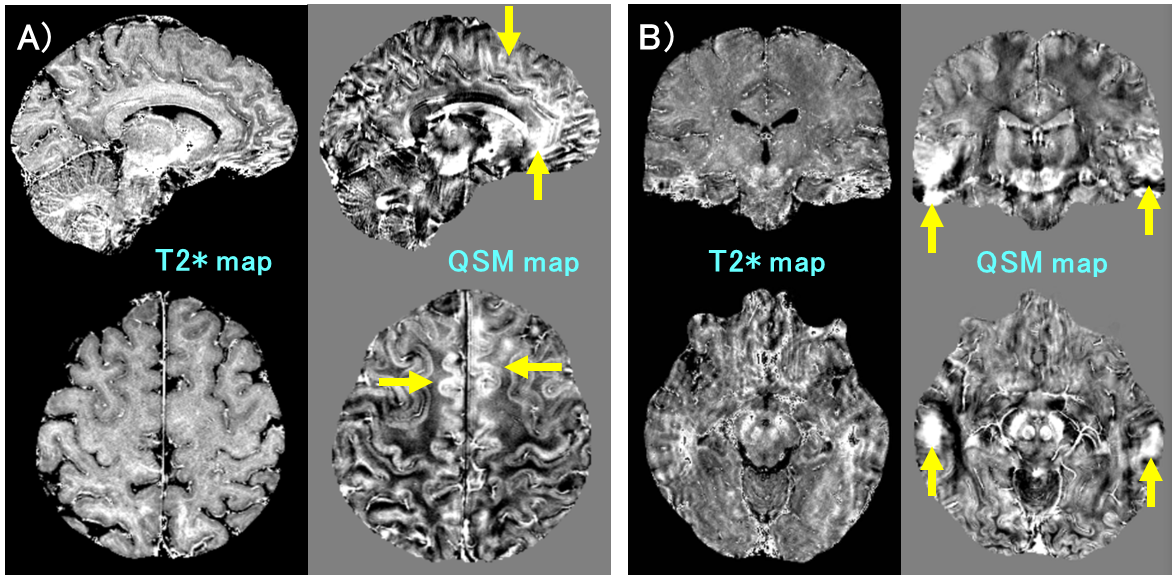
Similarity of average R2* and QSM maps shows high measurement stability except at the skull base. The results are comparable to a former ones3. Difference in contrast is considered attributable to the contrast mechanism. Both myelin and iron contribute to increase in R2* values, whereas they cancel out in QSM3,10, resulting in diminished values. Areas with CoV > 5% in R2* were located at inferior to middle frontotemporal areas. The rest of areas show relatively low values, and measurements are considered reliable. In QSM, CoV analysis cannot be applied, because average values were near zero and SD was analyzed instead of CoV. High SD areas were nearly the same as high CoV areas in R2*, but some differences exist in such areas as medial frontoparietal and left superior temporal areas. The differences were not observed in a QSM map generated using COSMOS3 and considered as artifact, because original QSM volume images showed wide and relatively homogeneous areas with increased QSM values (see Figure 3). Improvement in QSM analysis will contribute to more reliable results and prevailed usage of QSM.CONCLUSION
Cortical maps of R2* and QSM show repeatable results. Variances between test-retest scans are large at the frontotemporal base areas bilaterally; however, measurement of R2* and QSM values were found to be reliable in the wide cortical areas at 7T. This result is expected to promote future clinical investigations on human cortical pathology.Acknowledgements
No acknowledgement found.References
1. Fujimoto K, Polimeni JR, van der Kouwe AJ, et al. Quantitative comparison of cortical surface reconstructions from MP2RAGE and multi-echo MPRAGE data at 3 and 7 T, Neuroimage. 2014; 90: 60-73.
2. Metere R, Kober T, Möller HE, et al. Simultaneous Quantitative MRI Mapping of T1, T2* and Magnetic Susceptibility with Multi-Echo MP2RAGE, PLoS One. 2017; 12(1): e0169265.
3. Marques JP, Khabipova D, Gruetter R. Studying cyto and myeloarchitecture of the human cortex at ultra-high field with quantitative imaging: R1, R2* and magnetic susceptibility, Neuroimage. 2017; 147: 152-163.
4. Marques JP, Kober T, Krueger G, et al. MP2RAGE, a self bias-field corrected sequence for improved segmentation and T1-mapping at high field. Neuroimage. 2010 Jan 15;49(2):1271-81.
5. O'Brien KR, Kober T, Hagmann P, et al. Robust T1-weighted structural brain imaging and morphometry at 7T using MP2RAGE. PLoS One. 2014; 9(6):e99676.
6. Metere R, Kober T, Möller HE, Schäfer A. Simultaneous Quantitative MRI Mapping of T1, T2* and Magnetic Susceptibility with Multi-Echo MP2RAGE. PLoS One. 2017 Jan 12;12(1):e0169265.
7. Glasser MF, Sotiropoulos SN, Wilson JA, et al. The minimal preprocessing pipelines for the Human Connectome Project, Neuroimage. 2013; 80: 105-24.
8. Li W, Wu B, Liu C. Quantitative susceptibility mapping of human brain reflects spatial variation in tissue composition, NeuroImage. 2011; 55:1645.
9. Van Essen DC. A Population-Average, Landmark- and Surface-based (PALS) atlas of human cerebral cortex. Neuroimage. 2005 Nov 15;28(3):635-62.
10. Lee J, Nam Y, Choi JY, et al. Separating positive and negative susceptibility sources in QSM, ISMRM2017 abstract: 0751.
Figures