3295
Quantification of venous structures in the hippocampus using segment co-registered 7T susceptibility and structural images: First application to focal temporal lobe epilepsy1Radiology, Translational and Molecular Imaging Institute, New York, NY, United States, 2Icahn School of Medicine at Mount Sinai, New York, NY, United States, 3Neurology, Mount Sinai Hospital, New York, NY, United States, 4Mount Sinai Hospital, New York, NY, United States, 5Radiology, Icahn School of Medicine at Mount Sinai, New York, NY, United States
Synopsis
Susceptibility-weighted imaging offers superior contrast between veins and surrounding tissue. Our technique to isolate and quantify vein-like objects on SWI, combined with hippocampal segmentation of T1-weighted images, permits characterization of vascular density in focal temporal lobe epilepsy. We found difference in vascular density of both epilepsy patients (16%) and controls (30%), with diminished density on the left in both groups.
Purpose
Epilepsy affects 2.2 million people in the US [1]. 15%-30% of epilepsies, including temporal lobe epilepsy (TLE), are refractory to pharmacotherapy [2]. Surgical resection of the seizure onset zone (SOZ) may provide the most effective treatment [3], but this depends upon imaging conspicuity of a lesion [4] and certain focal lesions may escape detection with current MRI protocols [5]. Resected hippocampi from TLE patients have suggested an association between angiogenesis and sclerosis [6]. However, other experiments suggest a reduction in the functional vasculature in this population [7]. Susceptibility weighted imaging (SWI) exploits susceptibility changes in tissue such as those caused by paramagnetic deoxygenated blood to highlight veins. Susceptibility contrast increases with field strength; therefore SWI performed at 7 Tesla (7T) permits very high-resolution in vivo detection of veins in the brain.
We have developed a method to use susceptibility contrast to isolate and quantify structural features that resemble vasculature in SWI with the guidance of high resolution segmented structural images. We use this technique to identify alterations in vasculature in the hippocampus and report results of a preliminary investigation into abnormal vasculature associated with focal temporal lobe epilepsy.
Methods
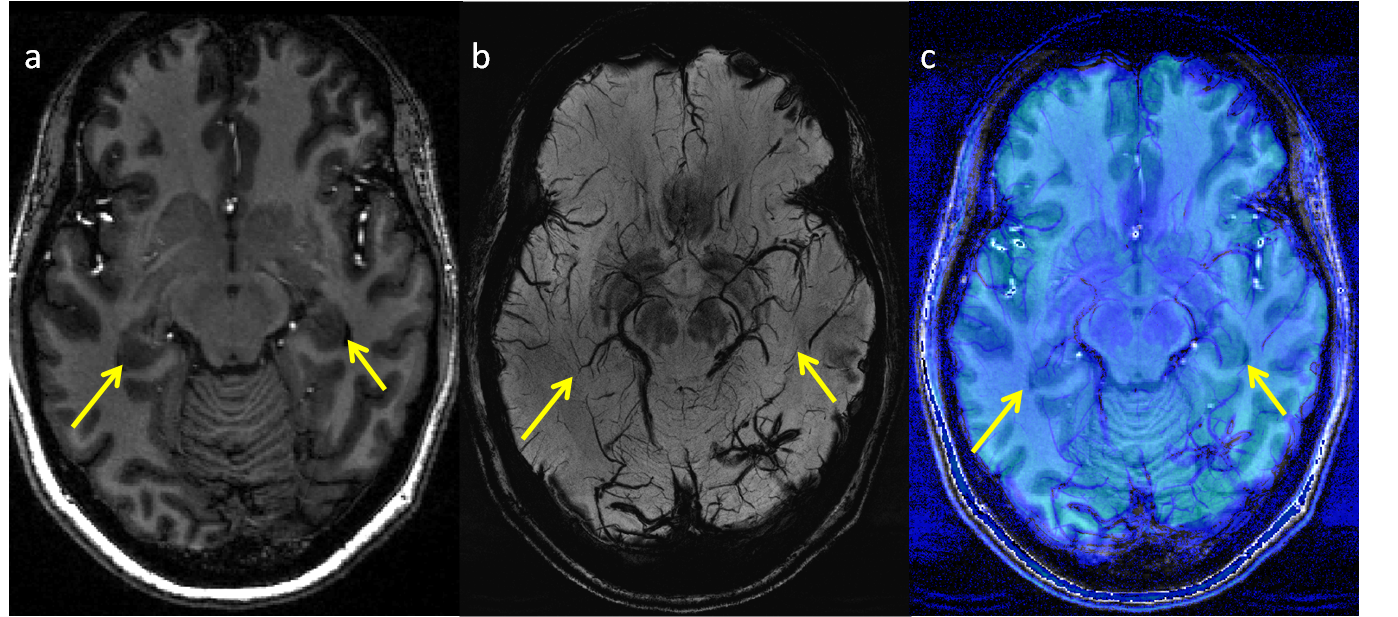
Five healthy controls and 5 patients with non-lesional focal epilepsy of suspected left temporal lobe origin were scanned on a 7T MRI (Siemens, MAGNETOM) using a 32-channel head coil (Nova Medical). MP2RAGE [8] and SWI were acquired as part of a comprehensive epilepsy imaging protocol (including FLAIR) [9] (Figure 1).
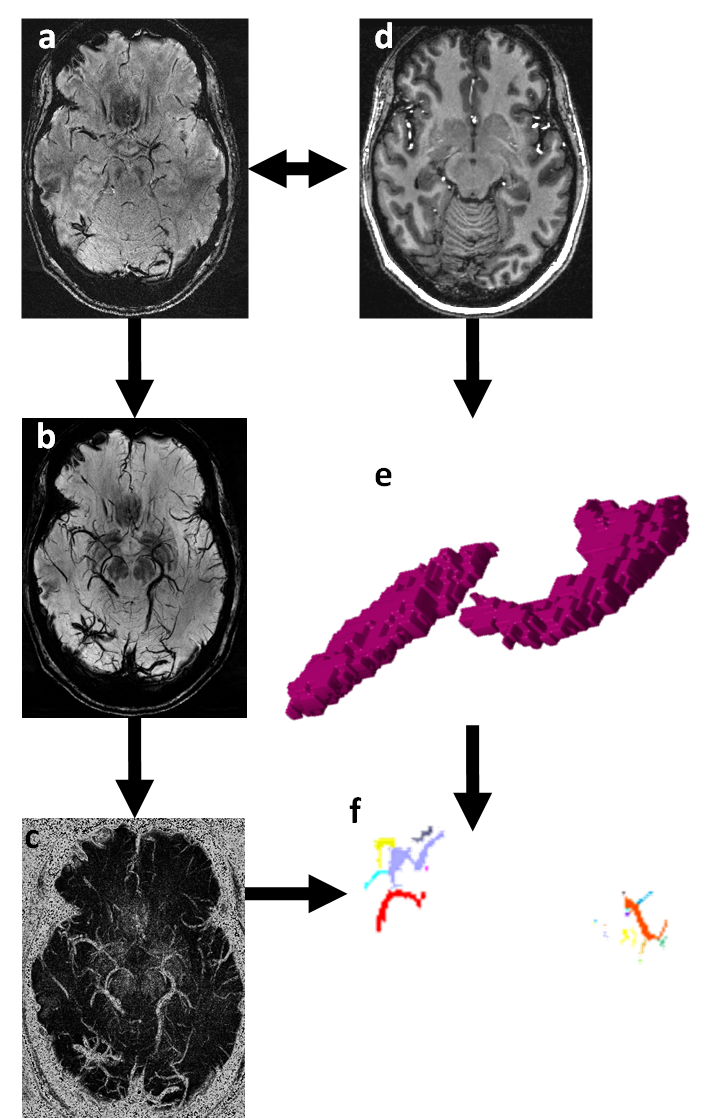
Uniform Denoised (UNIDEN) images were produced from the MP2RAGE acquisitions, and hippocampal masks were obtained from a cortical and subcortical brain segmentation using FreeSurfer (http://freesurfer.net, MGH). UNIDEN image and the associated hippocampal segmentations were co-registered to the SWI images using Statistical Parametric Mapping (SPM, UCL). To isolate veins on SWI, minimum intensity projection images (mIPs) were obtained by projecting through 5 contiguous slices. Canny Filter was applied for edge detection [10], and vascular objects (VO) larger than 1 voxel across the volume were identified in an 18-connected neighborhood (Figure 2).
Hippocampal volumes were calculated from the FreeSurfer segmentation, and vessel volume was estimated from the total VO volume. Vessel density was estimated by dividing the total VO volume by the hippocampal volume. The asymmetry index AI=2(Vr - Vl)/(Vr+Vl) was calculated for both total hippocampal volume (AIv) and estimated vessel density (AId) in the hippocampus for each subject. (Vr and Vl are the values for the right and left hemispheres respectively.)
Results/Discussion
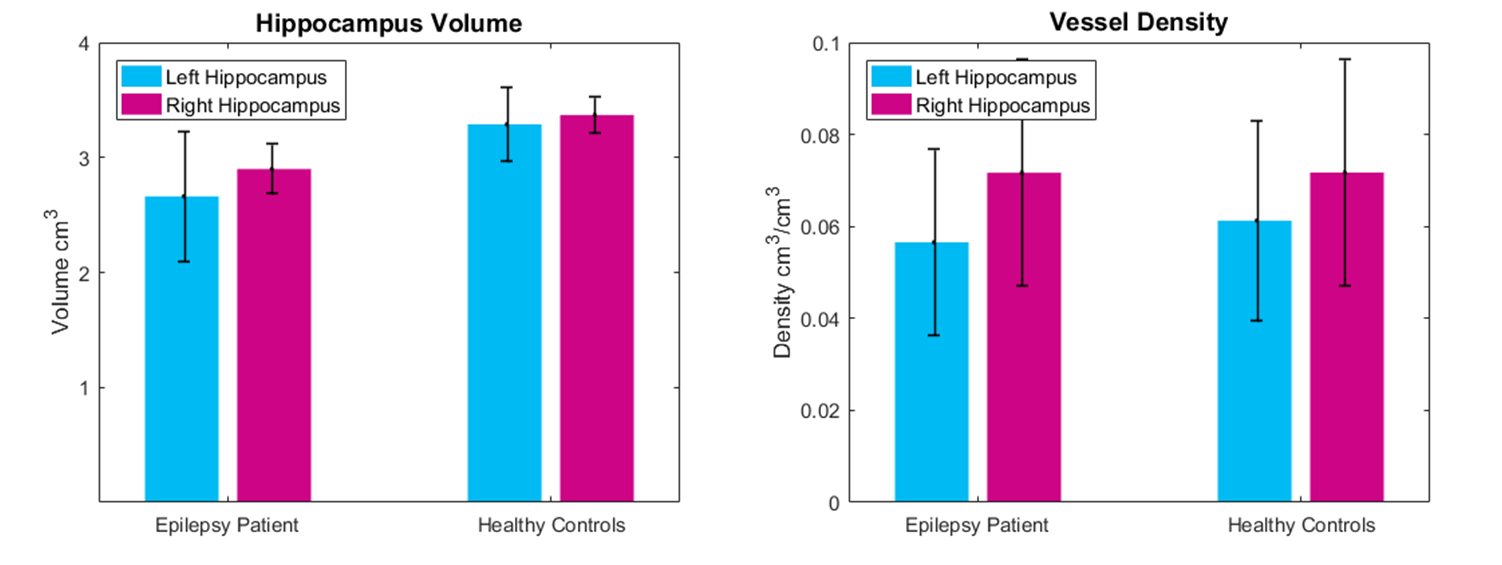
As shown in Figure 2, the mean hippocampal volume in epilepsy patients was lower than healthy controls (p<0.04), but there was no significant difference in mean vascular density between epilepsy patients and controls. However, for both epilepsy patients and controls, the error bars are large, suggesting high individual variability in both populations.
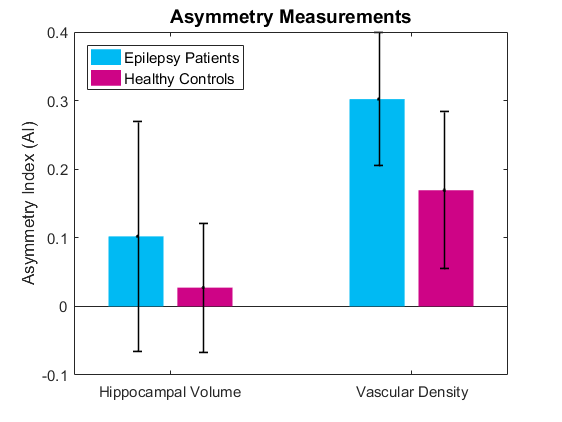
Figure 3 shows the mean AI in control and epilepsy patients’ hippocampal volume and vascular density. Using AI, the right and left sides of a single patient are compared, mitigating individual variability. While AIv was smaller in healthy controls (mean =0.03±0.09) than in epilepsy patients (mean=0.10±0.18), the difference was not significant. In healthy controls, there is very little asymmetry in vascular density (mean =0.17±0.11). However, the asymmetry was greater in patients with suspected left temporal lobe epilepsy (mean = 0.30±0.10). For example, an AId of 0.17 corresponds to a decrease of 16% between the right and left hemisphere, an AId of 0.3 corresponds to a decrease of 26% between the right and left hemispheres. For all epilepsy patients, the estimated vascular density asymmetry was greater than the average control AId.
Conclusions
Our technique uses contrast of SWI to localize and quantify venous structures in the human hippocampus in vivo. Preliminary application to a pilot group with left focal temporal lobe epilepsy and healthy controls revealed a decrease in estimated vascular density in the left temporal lobe compared with right. Future work will increase the sample size and expand the experiment to include the remaining cortex and white matter.Acknowledgements
NIH R00 NS070821
NIH R01 MH109544
Icahn School of Medicine Capital Campaign
Translational and Molecular Imaging Institute
References
1. England MJ, Liverman CT, Schultz AM, et al. Epilepsy Across the Spectrum:: Promoting Health and Understanding. National Academies Press; 2012
2. Kwan P, Brodie MJ. Early identification of refractory epilepsy. N Engl J Med 2000;342:314-319
3. Tellez-Zenteno JF, Dhar R, Wiebe S. Long-term seizure outcomes following epilepsy surgery: a systematic review and meta-analysis. Brain 2005;128(Pt 5):1188-1198.
4. So EL. Role of neuroimaging in the management of seizure disorders. Mayo Clin Proc 2002;77:1251-1264
5. Bien CG, Szinay M, Wagner J, et al. Characteristics and surgical outcomes of patients with refractory magnetic resonance imaging-negative epilepsies
6. Rigau V, Morin M, Rousset MC, et al. Angiogenesis is associated with blood-brain barrier permeability in temporal lobe epilepsy. Brain 2007; 130:1942-56
7. Alonso-Nanclares L, DeFelipe J. Alterations of the microvascular network in the sclerotic hippocampus of patients with temporal lobe epilepsy. Epilepsy and Behaviour 2014; 38:48-52.
8. Marques JP, Kober T, Krueger G, et al. MP2RAGE, a self bias-field corrected sequence for improved segmentation and T1-mapping at high field. Neuroimage 2010;49:1271-1281
9. Feldman RE, Dyvorne HA, Delman BN, et al. 7T Imaging of patients with focal epilepsy who appear non-lesional in diagnostic 1.5T and 3T MRI scans: first results. Proceedings of the Annual Meeting of the International Society for Magnetic Resonance in Medicine Toronto, Ontario, Canada 2015:0755
10. Canny JF. A computational approach to edge detection. IEEE Transactions in pattern analysis and machine intelligence 1986; 8:679-698.
Figures