3294
Echo time dependence in temporal frequency shift curves at 3T and 7T1Centre for Advanced Imaging, Brisbane, Australia
Synopsis
Quantitative susceptibility mapping is an MRI tool for mapping anatomical variations. The region specific echo time dependence of frequency shift curves computed from gradient recalled echo MRI data are likely due to variations in tissue microstructure, arrangement and packing. However, the effect of field strength on frequency shift curves has not been established to date. We investigated how frequency shift curves vary with field strength (3T versus 7T) and assessed how changes in the quantitative susceptibility mapping pipeline change the result. 7T data leads to less variability in frequency shift curves and, non-linear trends are present irrespective of methodological differences.
Introduction
Magnetic field inhomogeneities caused by tissue arrangement and composition influence gradient recalled echo MRI (GRE-MRI) data1. The GRE-MRI signal phase is influenced by magnetic field inhomogeneities, which can be converted to magnetic susceptibility or induced frequency shifts. We previously demonstrated echo time dependence in quantitative susceptibility mapping (QSM) outside of the corpus callosum2. Whilst the region specific non-linear trends in frequency shift curves have been suggested to be due to microstructural differences, they have also been indicated to be due to methods used to process the data3. There also exist inconsistencies across existing studies as some were performed at 3T and others at 7T. We therefore investigated how field strength and processing pipeline influence frequency shift curves as a function of echo time in six human brain regions using data acquired in six participants.Methods
Six healthy volunteers (19, 30 and 60 year old males and 26, 33 and 47 year old females) were scanned on a 7T whole-body MRI research scanner (Siemens Healthcare, Erlangen, Germany) with a 32 channel head coil (Nova Medical, Wilmington, USA) using a 3D GRE-MRI sequence, with the following parameters: TE1 = 4.98ms, echo spacing = 3.13ms, 9 echoes, TR = 52ms, flip angle = 15o, voxel size = 0.75 × 0.75 × 0.75 mm, and matrix size = 242 × 280 × 160. The same participants were scanned on 3T Siemens Magnetom Tim Trio scanner with TE1 = 6.29ms, echo spacing = 5.26ms, 9 echoes, TR = 60ms, flip angle = 18o, voxel size = 1 × 1 × 1 mm, and matrix size = 210 × 210 × 120. MP2RAGE data with: TE = 3.44ms, TR = 4,550ms, voxel size = 0.75 × 0.75 × 0.75 mm, and matrix size = 300 × 320 × 256 at 7T were acquired to segment six regions using FreeSurfer4 as shown in Fig 2. STI Suite v2.25 was used to perform Laplacian (integrated method of unwrapping and background field removal) and path-based MRPhaseUnwrap with V-SHARP, and iLSQR computed magnetic susceptibility maps as shown in Fig 1. Magnetic susceptibility was then converted to a frequency shift value for each echo point. The first echo time frequency shift was subtracted from all other echo time frequency shifts.Results
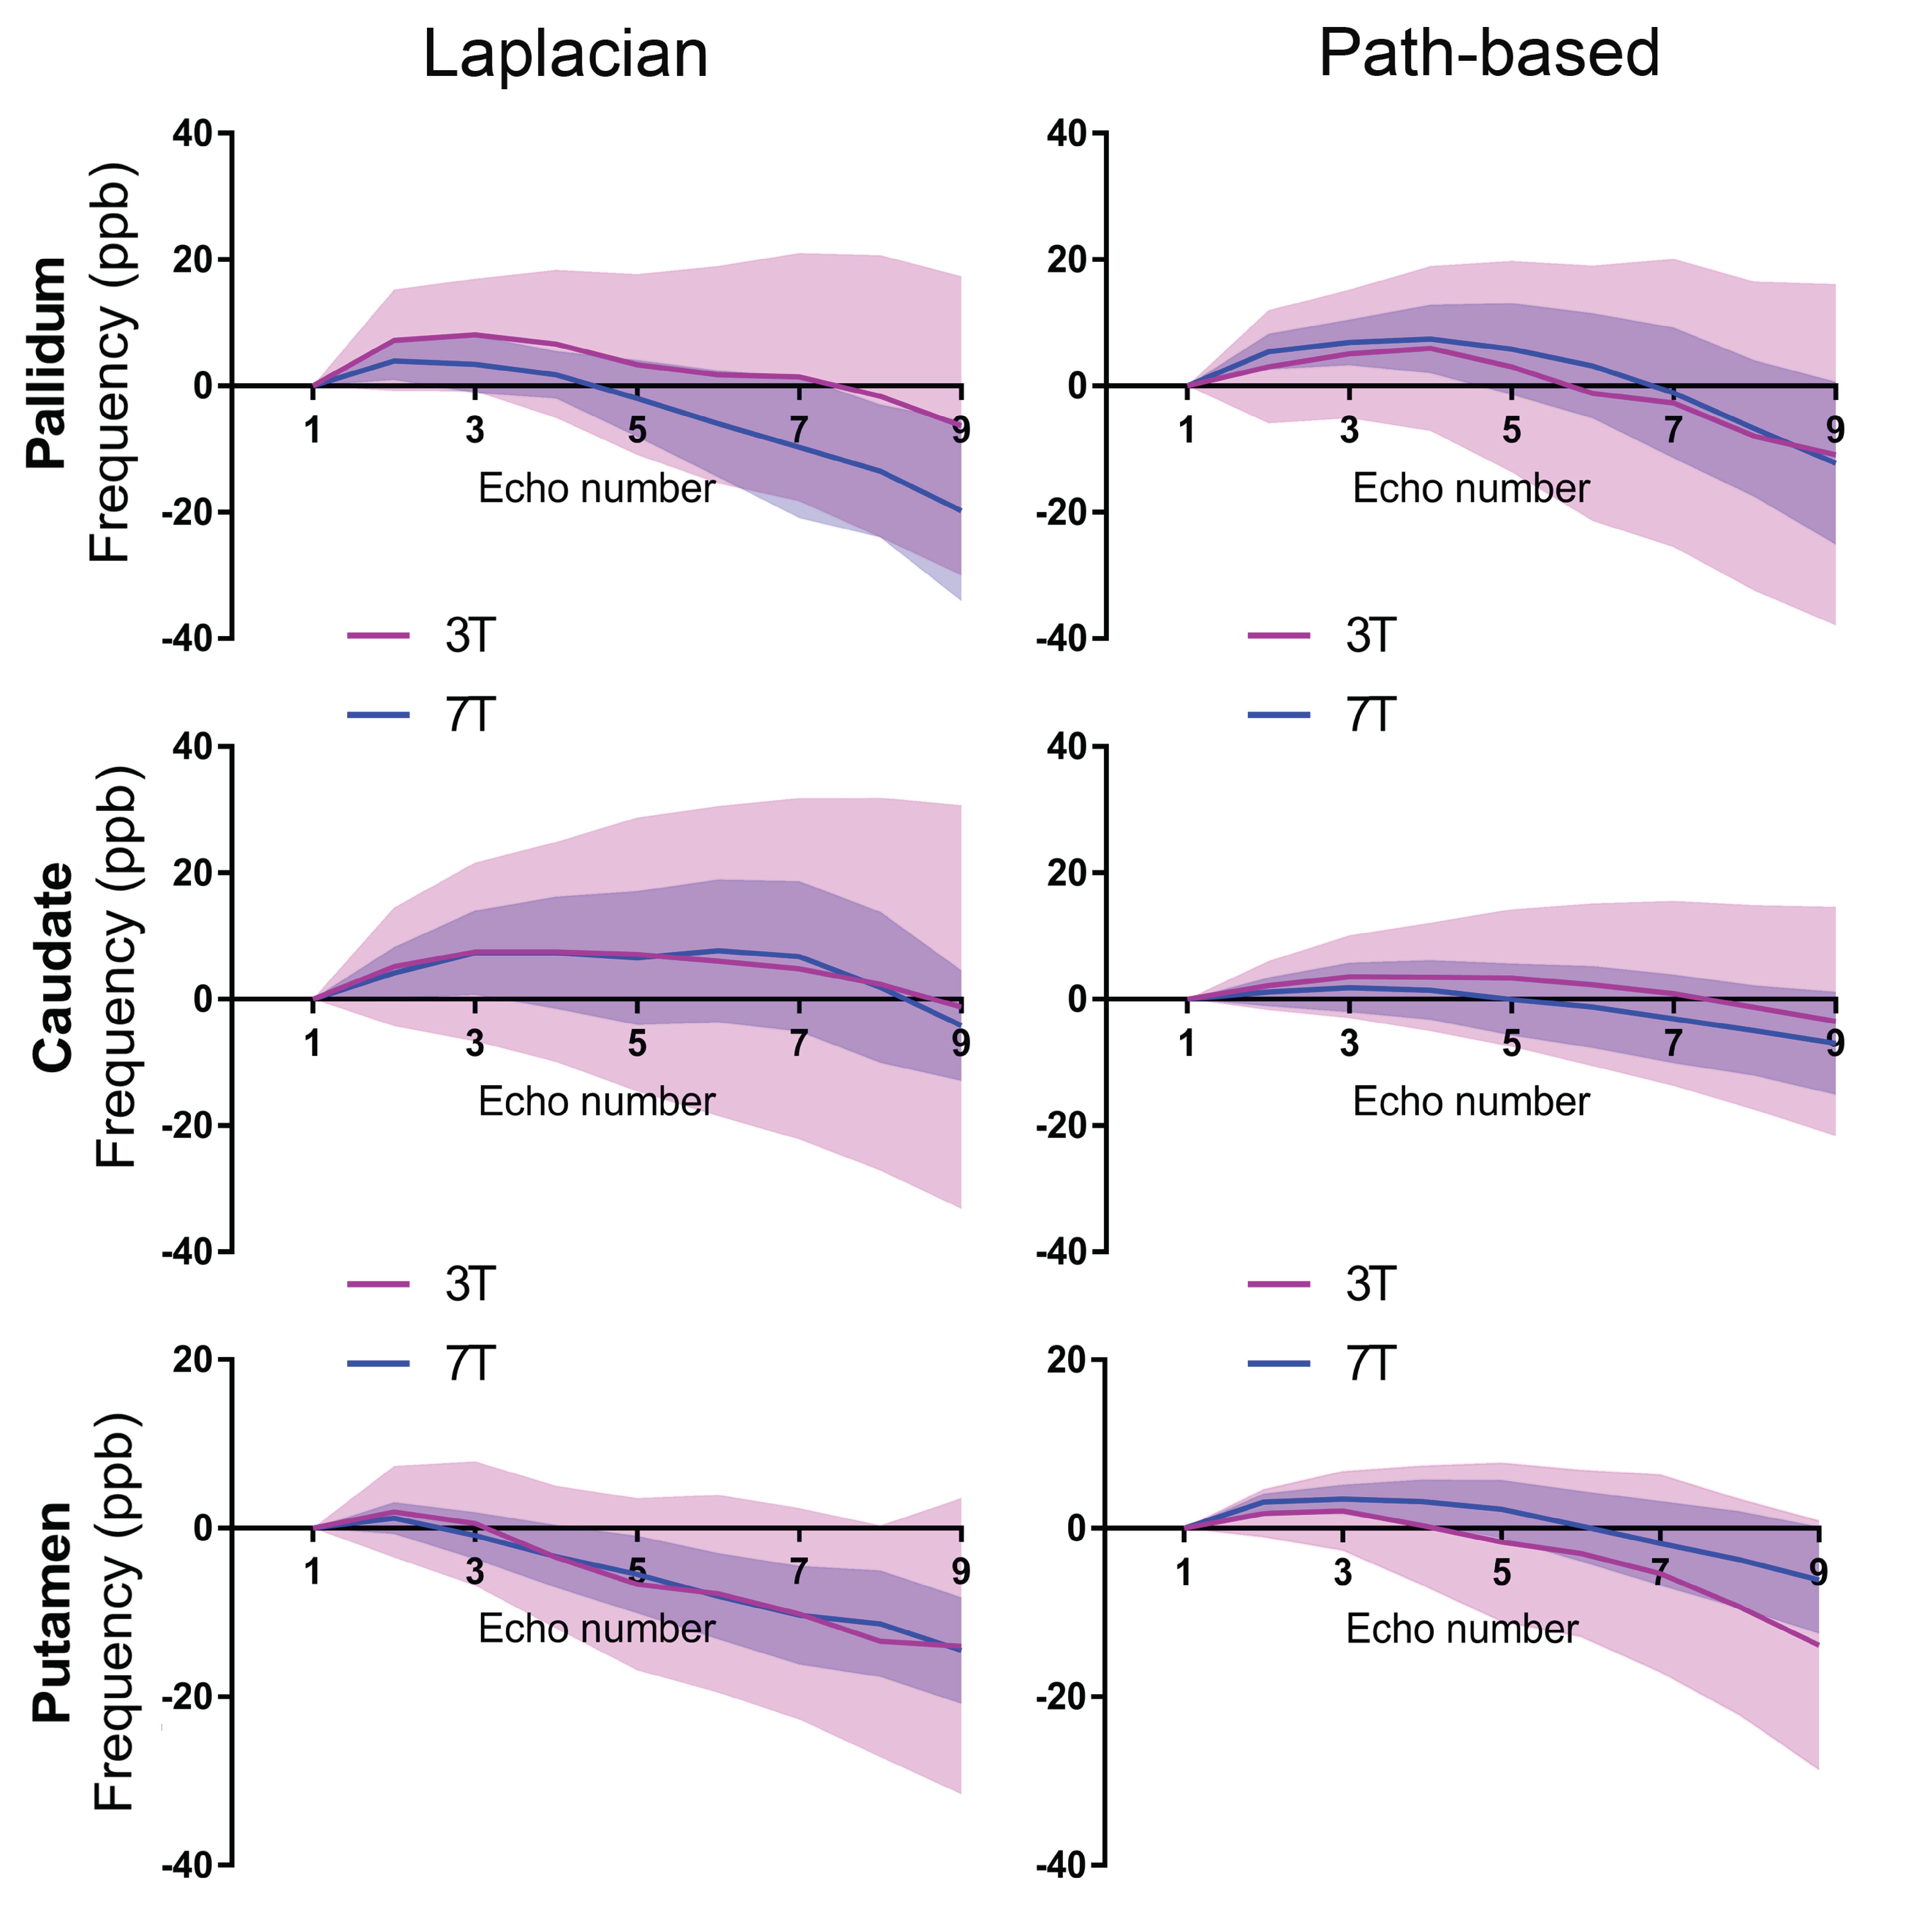
Fig 3 highlights increased variation in the log of the signal magnitude of brain regions at 7T as a function of echo number, implying an increase in sensitivity to effects which results in a deviation away from mono-exponential decay. The inset table summarises the results obtaining using a one term mono-exponential model fit. The mono-exponential model was able to better fit the 3T data than the 7T data. Frequency shift plots shown in Figs 4 and 5 were calculated using the two different phase unwrapping methods. The amount of variation across participants is larger at 3T than at 7T, and similar mean trends can be observed irrespective of field strength and method used to process the data.Discussion
The result in Fig 3 suggests underlying tissue influences of brain regions are more pronounced at 7T than at 3T. These are confirmed in Figs 4 and 5, wherein non-linear trends in frequency shift curves are present irrespective of the MRI field strength and method used to process data. The trend observed for corpus callosum using the Laplacian method has previously been demonstrated through simulations (note, we assume almost perpendicular orientation with respect to scanner field orientation)6. We previously investigated echo time dependence in human brain regions and found a pronounced effect at 7T2. Our additional findings presented here show that the mean 3T and 7T trends are mostly overlapping, and variability can be decreased by using 7T GRE-MRI data. In addition, the method used to process data can influence the non-linear behaviour present in frequency shift curves. The spatial unwrapping method, whilst influencing the outcome, does not appear to greatly change the shape of the mean trend. Additional work is needed in terms of signal compartmentalisation to assess how compartment parameters are affected by the method used to process the data.Conclusion
Our results show that 7T data leads to a lower level of variability in frequency shift curves as a function of echo time than 3T data. The non-linear trend in frequency shift curves appears to be present at both field strengths and mostly remain consistent with a change in the processing approach (i.e. Laplacian which achieves unwrapping and background field removal in a single step, and path-based unwrapping with V-SHARP background field removal).Acknowledgements
We thank Javier Urriola, Aiman Al-Najjar and Nicole Atcheson for help with data collection. Surabhi Sood received an Australian Post-graduate Award for her PhD studies. Viktor Vegh and David Reutens acknowledge the National Health and Medical Research Council (NHMRC Project Grant – APP1104933) for funding our research. Markus Barth acknowledges funding received for his Australian Research Council Future Fellowship (FT140100865).References
1. Chen WC, Foxley S, Miller KL, Detecting microstructural properties of white matter based on compartmentalization of magnetic susceptibility. NeuroImage. 2013;70:1-9.
2. Sood S, Urriola J, Vegh V, et al. Echo time-dependent quantitative susceptibility mapping contains information on tissue properties. Magn Reson Med. 2017;77(5):1946-58.
3. Cronin MJ, Wang N, Decker KS, et al. Exploring the origins of echo-time-dependent quantitative susceptibility mapping (QSM) measurements in healthy tissue and cerebral microbleeds. NeuroImage. 2017;149(Supplement C):98-113.
4. Dale AM, Fischl B, Sereno MI. Cortical Surface-Based Analysis: I. Segmentation and Surface Reconstruction. NeuroImage. 1999;9(2):179-94.
5. Li W, Avram AV, Wu B, et al. Integrated Laplacian-based phase unwrapping and background phase removal for quantitative susceptibility mapping. NMR Biomed. 2014;27(2):219-27.
6. Wharton S, Bowtell R. Fiber orientation-dependent white matter contrast in gradient echo MRI. Proc Natl Acad Sci. 2012;109(45):18559-64.
Figures