3293
In-Vivo Evaluation of MR Fingerprinting at 7T1Kyoto University Graduate School of Medicine, Kyoto, Japan, 2Osaka Red Cross Hospital, Osaka, Japan, 3Human Brain Research Center, Kyoto Univerisity Graduate School of Medicine, Kyoto, Japan, 4Department of Radiology, New York School of Medicine, Center for Advanced Imaging Innovation and Research (CAI2R) and Bernard and Irene Schwartz Center for Biomedical Imaging, New York, NY, United States
Synopsis
At 7T RF wavelength effects create a highly heterogeneous B1+ field, which can lead to contrast artifacts and signal dropouts. Instead of attempting to mitigate the B1+ inhomogeneity, the Plug-and-Play MRF (PnP-MRF) method simultaneously encodes the B1+ produced by multiple transmit channels alongside desired tissue properties (PD,T1,T2) to extract B1+ bias free multi-parametric maps. Although this method was designed for use with multiple transmit-channels, a single transmit channel may suffice if B1+ voids can be avoided. In this work, we evaluate the performance of PnP-MRF for brain imaging at 7T in a single transmit configuration.
Introduction
The MR Fingerprinting (MRF) framework enables simultaneous quantification of tissue properties by utilizing a pseudo-random RF pulse train and matching its signal evolution to a simulated dictionary entry (1). Since its introduction, many studies have shown the robustness and precision of the method in 1.5T and 3.0T (2–5). However, only a limited number of studies have shown results at ultra high field such as 7T (6,7). At 7T RF wavelength effects create heterogeneous B1+ fields, which bias the images. Instead of attempting to mitigate these inhomogeneities, the Plug-and-Play MRF (PnP-MRF) method simultaneously encodes the B1+ produced by multiple transmit channels alongside desired tissue properties (PD,T1,T2) to extract B1+ bias free multi-parametric maps. Although this method was designed for use with multiple transmit-channels, a single transmit channel may suffice in areas where B1+ voids can be avoided. In this work, we evaluate the performance of PnP-MRF for brain imaging at 7T using a single-transmit system.
Methods: sequence design
The PnP-MRF sequence uses segments of FISP (2x) and FLASH (2x) based variable flip-angle trains. The FLASH segments contain RF spoiled gradient echoes that predominantly encode RF-field distribution (B1+) and T1, whereas the other segments also add a T2 relaxation component (no RF spoiling). To improve the applicability for single-transmit systems, we added a non-selective adiabatic inversion at the start. Collectively, these 4 segments (250 RF pulses each) capture a distinct signal evolution that simultaneously identifies B1+ and tissue properties. A constant TR and 2D radial readout was used. The effective undersampling factor can be altered by changing the number of “shots”.
Methods: image acquisition
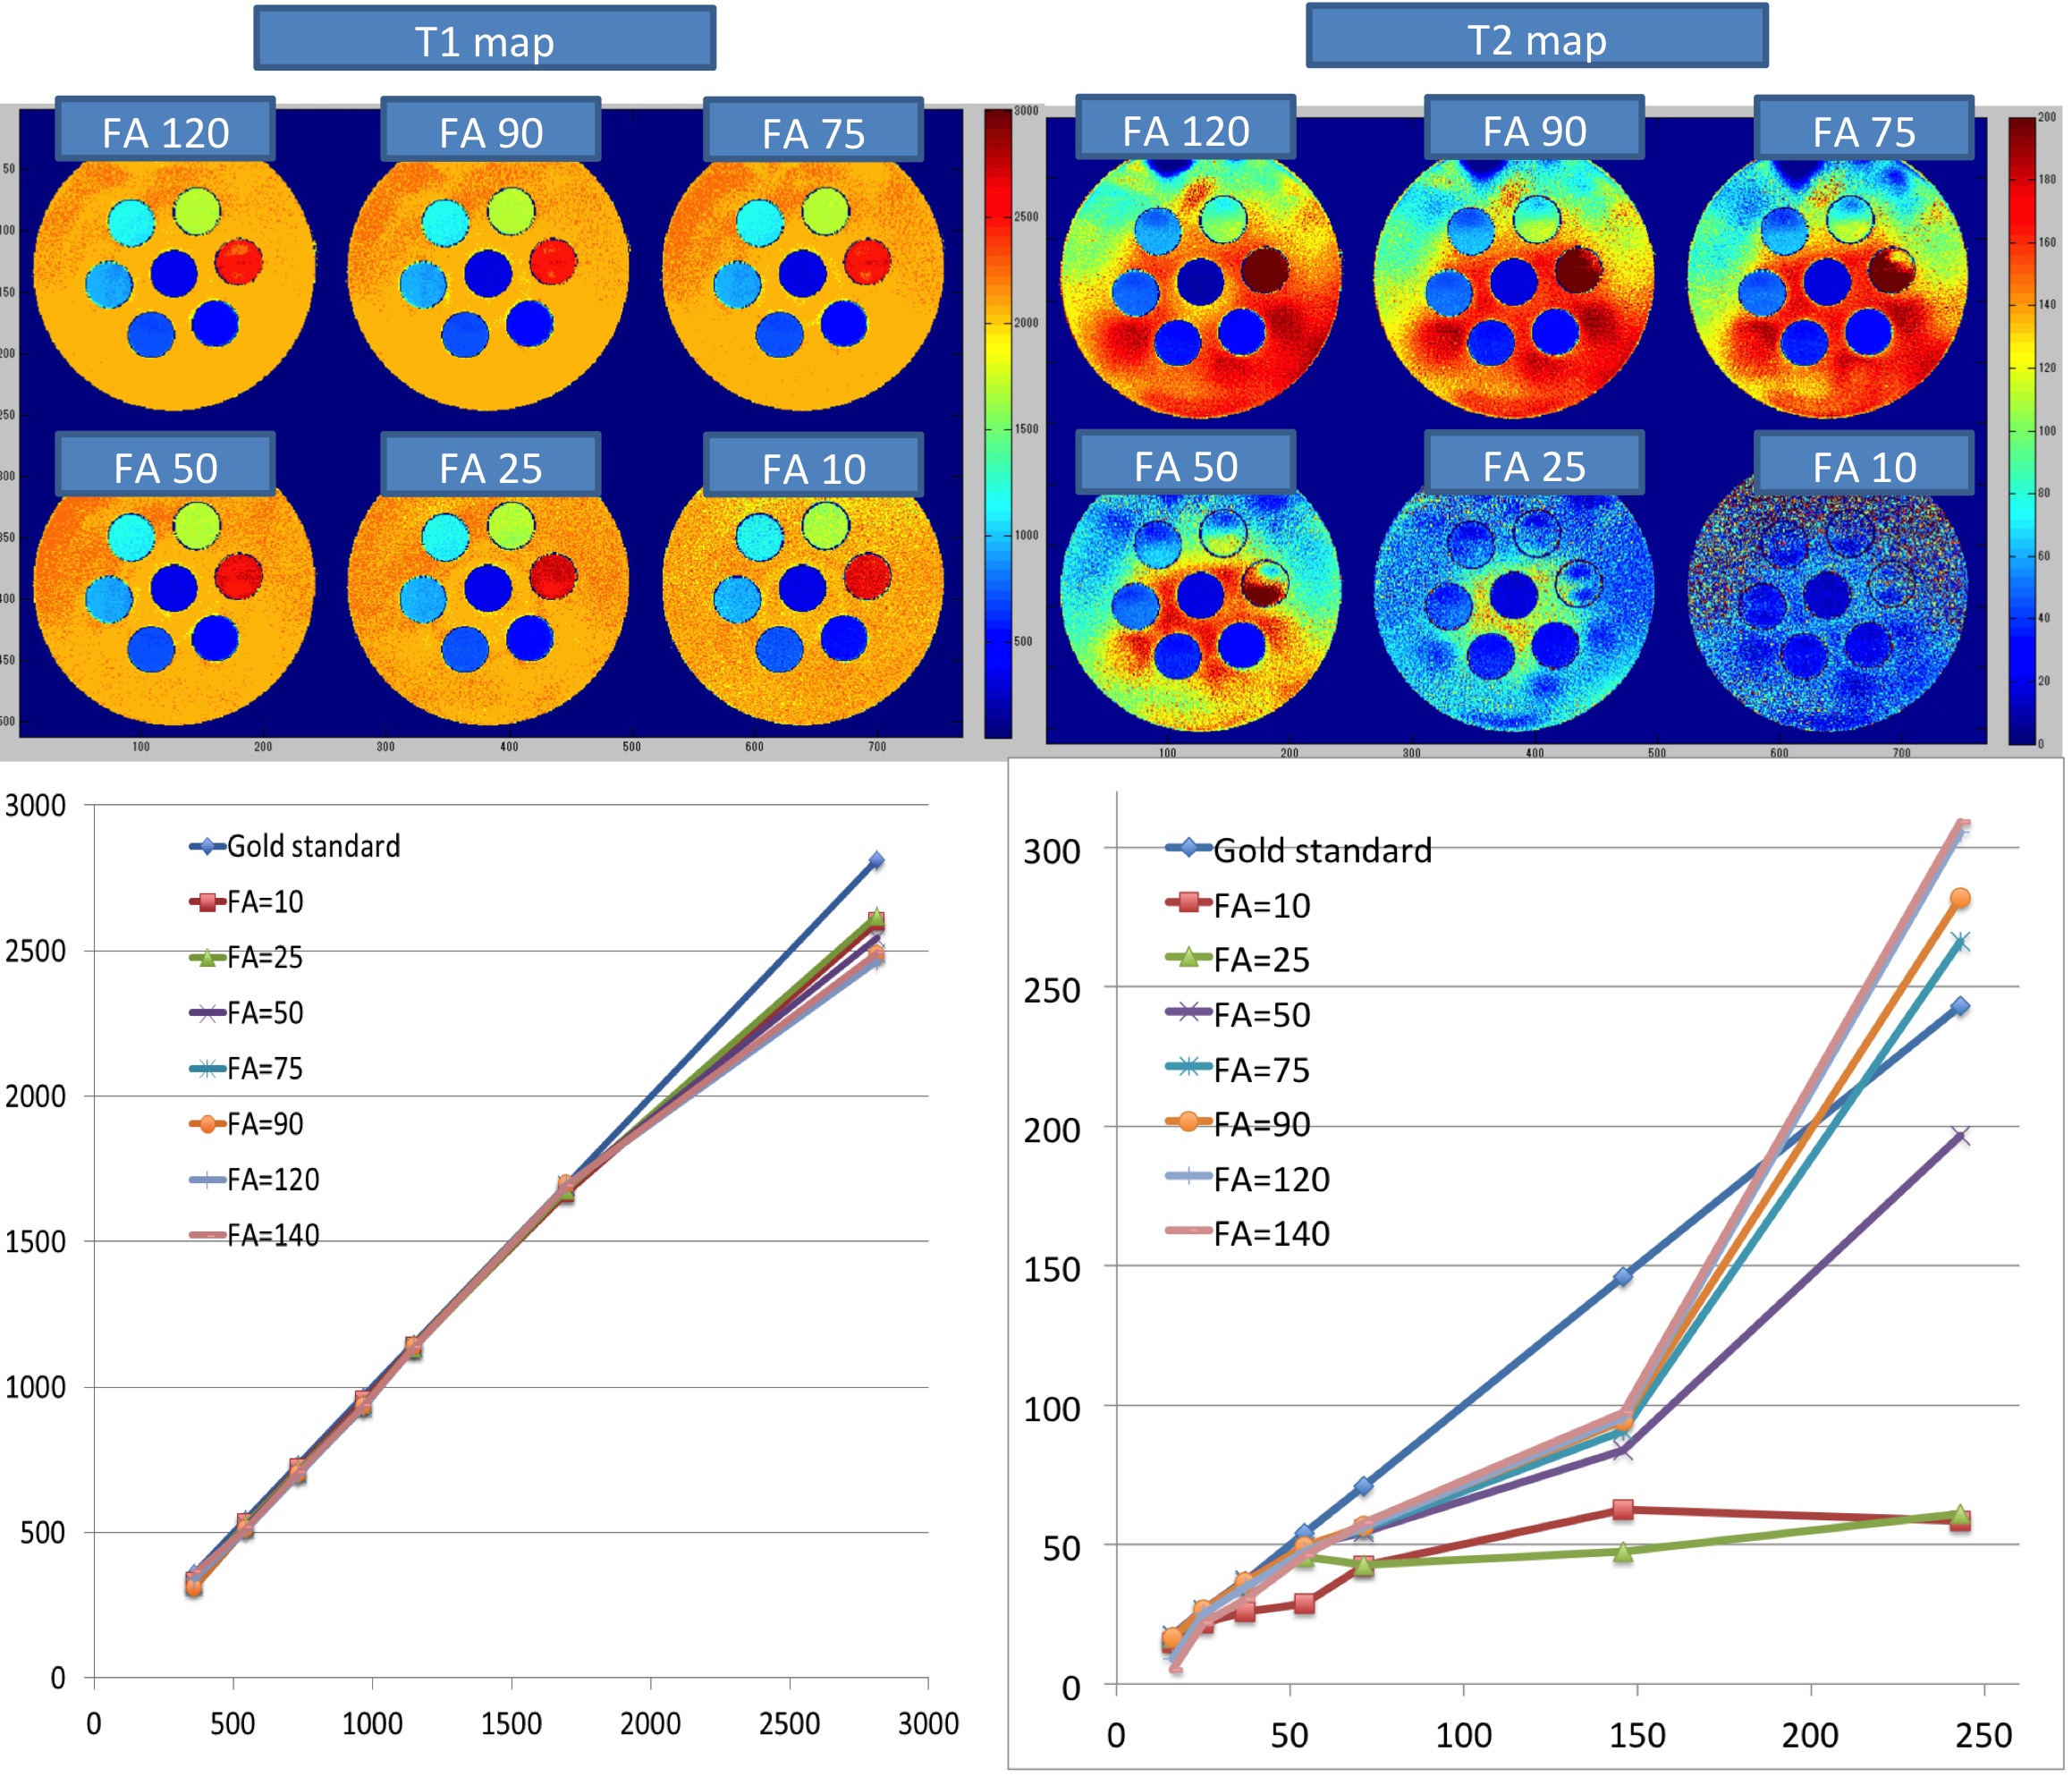
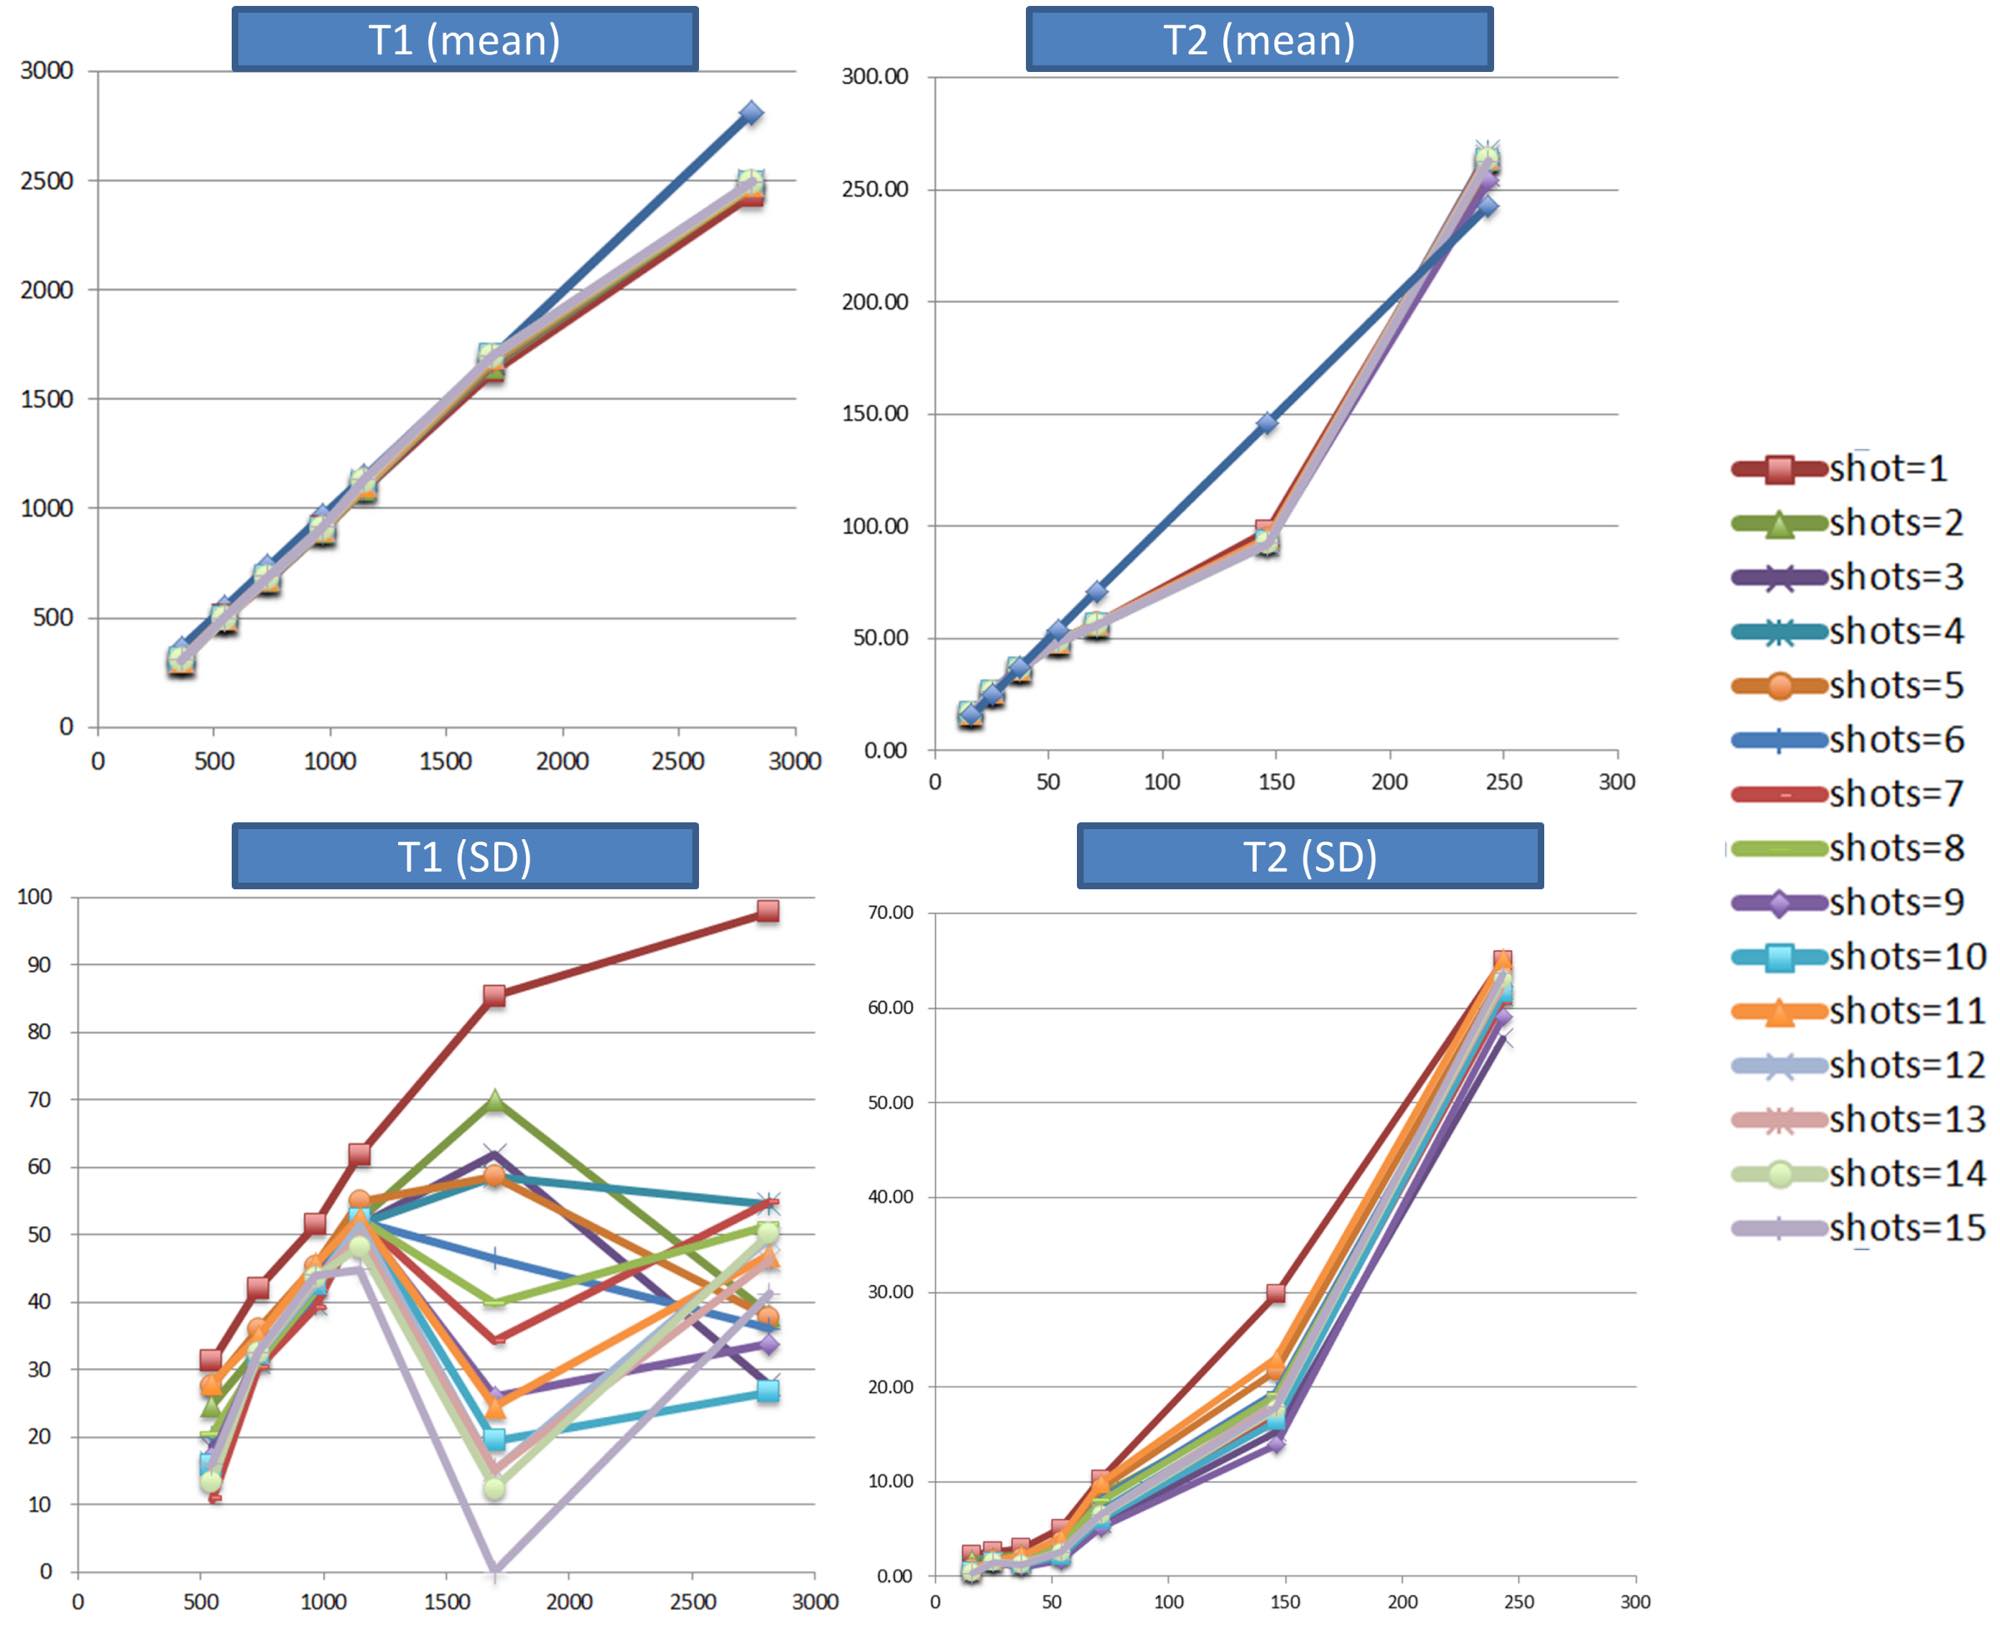
A custom-made liquid phantom containing 7 different T1 and T2 combinations was scanned with the 1TX-PnP-MRF sequence (0.75x075x3mm, matrix=256x256) using 1 to 15 shots and different scale factors for the RF train (peak flip-angle 10,35,50,75,90,120,140). Gold standard T1 and T2 maps were obtained from a series of IR-SE measurements (acquisition parameters: TR/TI/TE=10000ms/[25,50,100,200,400,800,1600,3200,6400]ms/12ms).
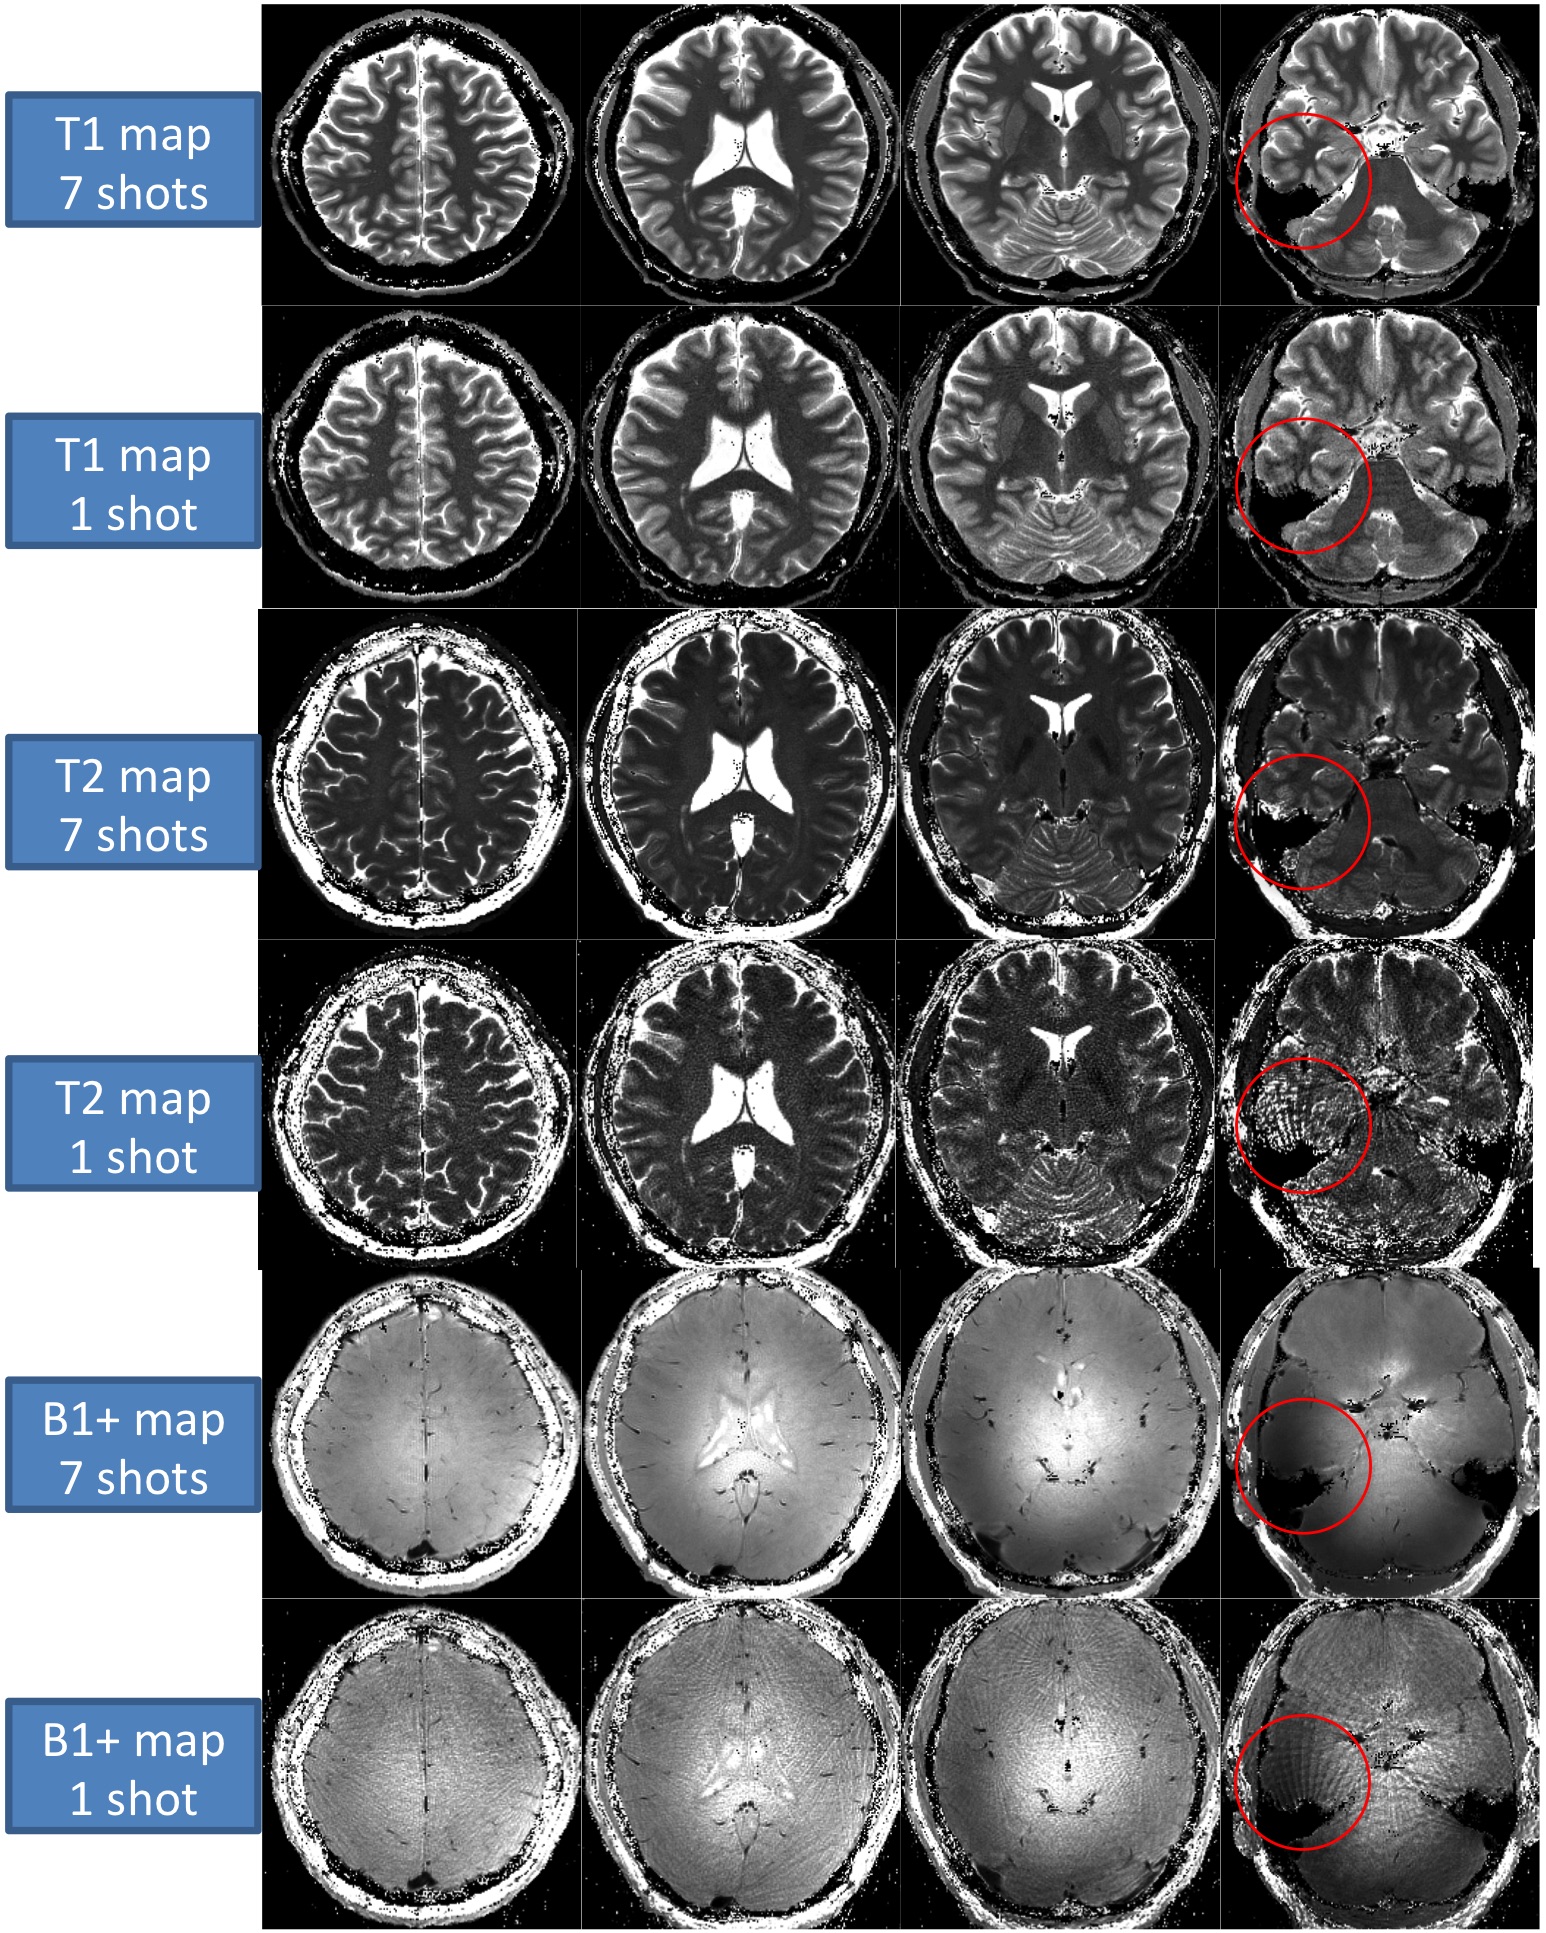
Three healthy volunteers (male, age 36-44) were scanned with the 1TX-PnP-MRF sequence. Four axial slices of the brain were acquired, using 1, 3, and 7 shots (7.5, 22.5, and 53s per slice, respectively). The resolution/slice-thickness/TR/FA were 0.75x075mm/3mm/7.5ms/90deg.
All experiments were performed on an investigational whole-body 7T scanner (MAGNETOM 7T, Siemens Healthcare, Erlangen, Germany) equipped with body gradients and a 1ch Tx, 32ch Rx coil (Nova Medical, Wilmington, MA). The study was approved by our institutional review board.
Methods: post processing & analysis
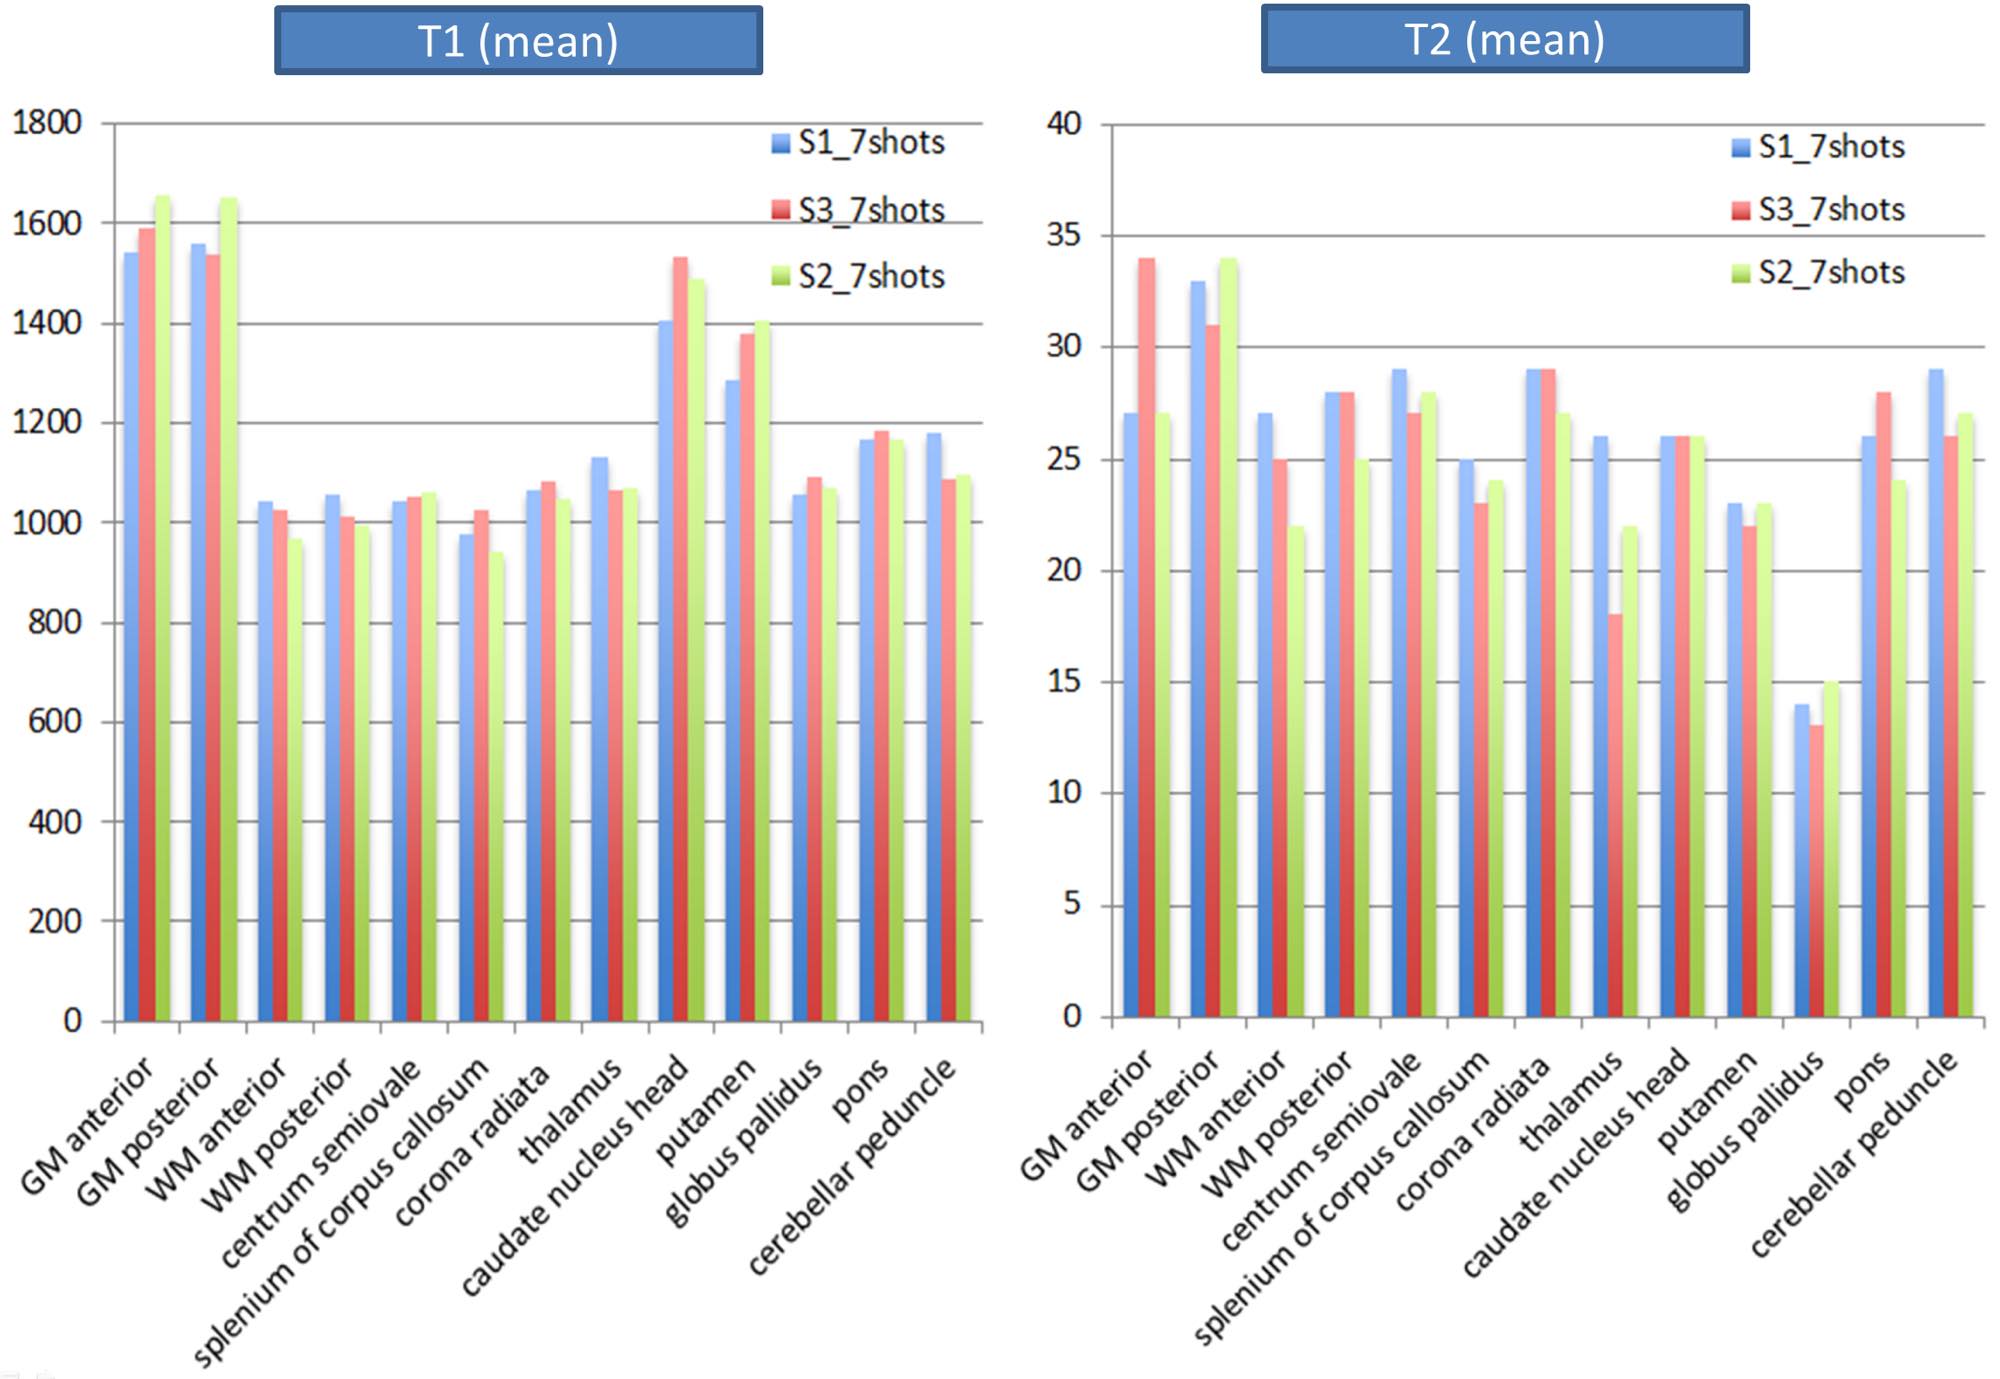
Images were reconstructed with in-house Matlab scripts. Prior to the dictionary matching, data compression with SVD was used to reduce computational time without reducing matching accuracy (8). The T1 and T2 maps of the phantom obtained by 1TX-PnP-MRF were compared to the reference values by drawing a total of 7 regions of interests (ROI), each corresponding to a compartmentalized liquid with distinct T1 and T2 values. The Pearson’s correlation coefficients were calculated. For the in-vivo experiment, ROIs were drawn on multiple locations of the brain. Their T1 and T2 values were extracted and compared to the values of previously reported literature (9,10).
Results & Discussion
The T1 values measured in the phantom were in excellent agreement with the reference maps (minimum R=0.995). The T2 values below 50ms also showed a good agreement (minimum R=0.962) provided that the flip-angle exceed the linear regime of the Bloch equations (FA>>25). However, long T2 values were systematically under-estimated. It is currently not clear where this discrepancy is coming from. One possible explanation is convection in the phantom, or imperfect gradient balancing in the sequence.
The in-vivo experiments demonstrated that a single transmit-channel may be sufficient to obtain clean T1 and T2 maps in most parts of the brain at 7T (Fig 3). However, at the base of the brain, where the B1+ is lowest, some residual artifacts may appear, especially when using a higher undersamping factor.
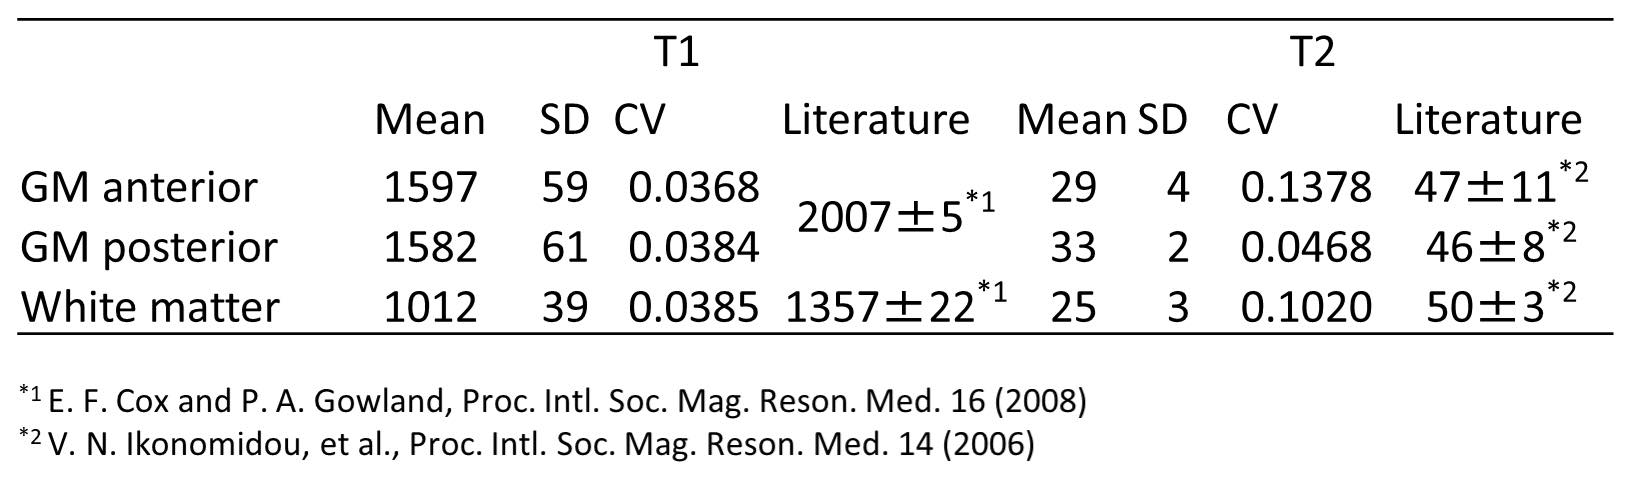
With 7 shots, the across-subject CV was as small as 4% for T1 and 13% for T2 (Figures 3-5). T1 and T2 values of anterior gray matter (GM), posterior GM and white matter (WM) were substantially lower than what is reported in the literature (Figure 5). This may be due to magnetization transfer effects (11). Currently, our dictionary assumes a single pool model, which works well for phantoms but may not accurately reflect tissue in-vivo (12).
Conclusion
One single transmit-channel may be sufficient to obtain artifact-free T1 and T2 maps in most of the brain at 7T. Nevertheless, areas near the base of the brain may still suffer from the low signal and near linear spin-dynamics produced by the low B1+. Further work is needed to further validate the accuracy in-vivo.Acknowledgements
No acknowledgement found.References
1. Ma D, Gulani V, Seiberlich N, et al. Magnetic resonance fingerprinting. Nature. Nature Publishing Group; 2013;495(7440):187–192
2. Rieger B, Zimmer F, Zapp J, Weingartner S, Schad LR. Magnetic resonance fingerprinting using echo-planar imaging: Joint quantification of T1 and T2* relaxation times. Magn Reson Med. 2016;0:1–10.
3. Hamilton JI, Jiang Y, Chen Y, et al. MR fingerprinting for rapid quantification of myocardial T 1 , T 2 , and proton spin density. Magn Reson Med. 2017;77(4):1446–1458.
4. Jiang Y, Ma D, Keenan KE, Stupic KF, Gulani V, Griswold MA. Repeatability of magnetic resonance fingerprinting T1and T2estimates assessed using the ISMRM/NIST MRI system phantom. Magn Reson Med. 2017;78(4):1452–1457.
5. Badve C, Yu A, Rogers M, et al. Simultaneous T1 and T2 Brain Relaxometry in Asymptomatic Volunteers Using Magnetic Resonance Fingerprinting. Tomography. 2015;1(2):136–144.
6. Cloos MA, Knoll F, Zhao T, et al. Multiparametric imaging with heterogeneous radiofrequency fields. Nat Commun. Nature Publishing Group; 2016;7:12445.
7. Buonincontri G, Schulte RF, Cosottini M, Tosetti M. Spiral MR fingerprinting at 7 T with simultaneous B1 estimation. Magn Reson Imaging. 2017;41:1–6.
8. McGivney DF, Pierre E, Ma D, et al. SVD compression for magnetic resonance fingerprinting in the time domain. IEEE Trans Med Imaging. 2014;33(12):2311–2322.
9. Cox E, Gowland P. Measuring T2 and T2’ in the brain at 1.5T, 3T and 7T using a hybrid gradient echo-spin echo sequence and EPI. Proc Intl Soc Mag Reson Med. 2008;16:1411/MyPathway2008/1411.
10. Ikonomidou VN, van Gelderen P, de Zwart JA, Duyn JH. T1 measurements at 7T with application to tissue specific imaging. Proc Int Soc Magn Reson Med. 2006;251(1970):920.
11. Dortch RD, Moore J, Li K, et al. Quantitative magnetization transfer imaging of human brain at 7 T. Neuroimage. 2013;64:640–649.
12. Hilbert et al., Mitigating the Effect of Magnetization Transfer in Magnetic Resonance Fingerprinting. ISMRM 2017 #0074.
Figures