3292
Test-retest reproducibility of cortical thickness, B1+, and R1 in healthy young adults measured at 7T1Human Brain Research Center, Kyoto University Graduate School of Medicine, Kyoto, Japan, 2Siemens Healthcare K.K., Tokyo, Japan, 3Advanced Clinical Imaging Technology, Siemens Healthcare AG, Lausanne, Switzerland, 4Department of Radiology, Centre Hospitalier Universitaire Vaudois (CHUV), Lausanne, Switzerland, 5Signal Processing Laboratory (LTS 5), École Polytechnique Fédérale de Lausanne (EPFL), Lausanne, Switzerland
Synopsis
Twenty-two healthy volunteers were scanned at 7T using MP2RAGE (R1 mapping) and Sa2RAGE (B1 mapping) sequences. Applying a modified HCP pipeline, within-subject (test-retest) reproducibility and across-subject variability of cortical thickness, B1+, and R1 were analyzed. The mean absolute difference of cortical thickness was larger at the bilateral lower temporal lobes and insula. Intra-subject variation of B1+ was larger in the lower temporal lobe, whereas across-subject variation of B1+ seems to come from reference transmitter amplitude settings. Except for the lower temporal lobes, variation in the cerebral cortex R1 was very small for both intra-subject measurement (1.5%) and across-subject measurement (3%).
Introduction
R1 (=1/T1) is a quantitative value which can be measured with MRI, and is considered to reflect the amount of myelin and iron in the cerebral cortex [1]. MP2RAGE [2] is capable of mitigating B1+ inhomogeneity at 7T by acquiring two different images during the recovery from an inversion pulse. For clinical translation of R1 measurements of the human brain cortex at 7T, accurate relaxometry is necessary. In this study, we evaluated within-subject (test-retest) reproducibility and across-subject variability of the R1 value at 7T in young adults. B1+ and cortical thickness are also measured and evaluated.Methods: image acquisition
Healthy volunteers at the age between 20-30 were recruited and 24 subjects (mean 22.3, range 20-25) were enrolled under approval of institutional review board. Subjects were scanned on an investigational whole-body 7T MRI (MAGNETOM 7T, Siemens Healthcare, Erlangen, Germany) equipped with body gradients using a 1ch-Tx 32ch-Rx coil (Nova Medical, Wilmington, MA) between 2017/8/1-2017/9/25. Subjects were scanned on the same day, with a 5-15 minutes break between two sessions with repositioning. Scanning protocol included MP2RAGE (prototype sequence) with 0.7mm isotropic resolution and Sa2RAGE (prototype sequence) for B1+ mapping. The scanning parameters for the MP2RAGE were as follows: TI1/TI2/TR/TE/FA1/FA2/BW/echo spacing/matrix/GRAPPA/total acquisition time=800ms/2700ms/6000ms/2.9ms/4°/5°/260Hz/pix/6.8ms/284×284x256/R=3/9min20sec. The scanning parameters for Sa2RAGE were as follows: TI1/TI2/TR/TE/FA1/FA2/BW/echo spacing/matrix/GRAPPA/total acquisition time=50ms/1800ms/2400ms/0.88ms/4°/10°/1180Hz/pix/2.5ms/128x128x64/R=3/2min09sec.Methods: data post-processing
One subject was excluded due to motion artifacts. Cerebral cortex was segmented based on the Human Connectome Project (HCP) pipelines [3] with some modifications. Specifically, instead of using MPRAGE and T2TSE, we used uniform images with de-noising (UNI-DEN) [4] and T1 map, respectively as an input, both obtained with MP2RAGE. After cortical segmentation was performed, R1 and B1+ at the midline of the cortical gray matter was obtained and projected to the inflated cortical surface map.Methods: data analysis
One subject was excluded due to severe registration error, yielding a total of 22 subjects for data post-processing. By using in-house Matlab scripts and Linux shell scripts with HCP workbench commands, the following metrics are calculated on the gray-ordinate space [3].
(1) within-subject (test-retest) reproducibility
For each subject, within-subject coefficient of variation (wCV) was calculated by dividing standard deviation (SD) of cortical thickness/B1+/R1 from the first and second scans with the average value of two scans. wCV for each vertex were averaged over subjects to obtain averaged wCV to represent test-retest reproducibility. For cortical thickness, absolute difference was also calculated.
(2) across-subject variation
Similarly, across-subject coefficient of variation (aCV) and the standard deviation (aSD) was calculated by using the data of the first session of each subject.
Results
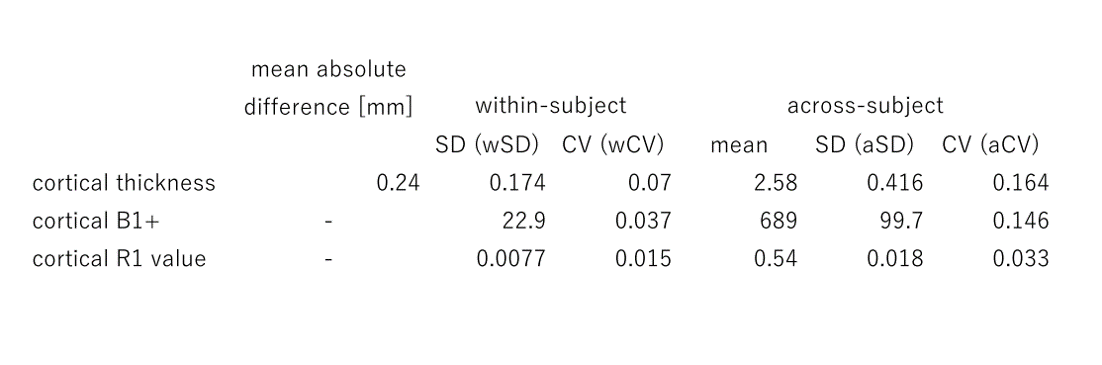
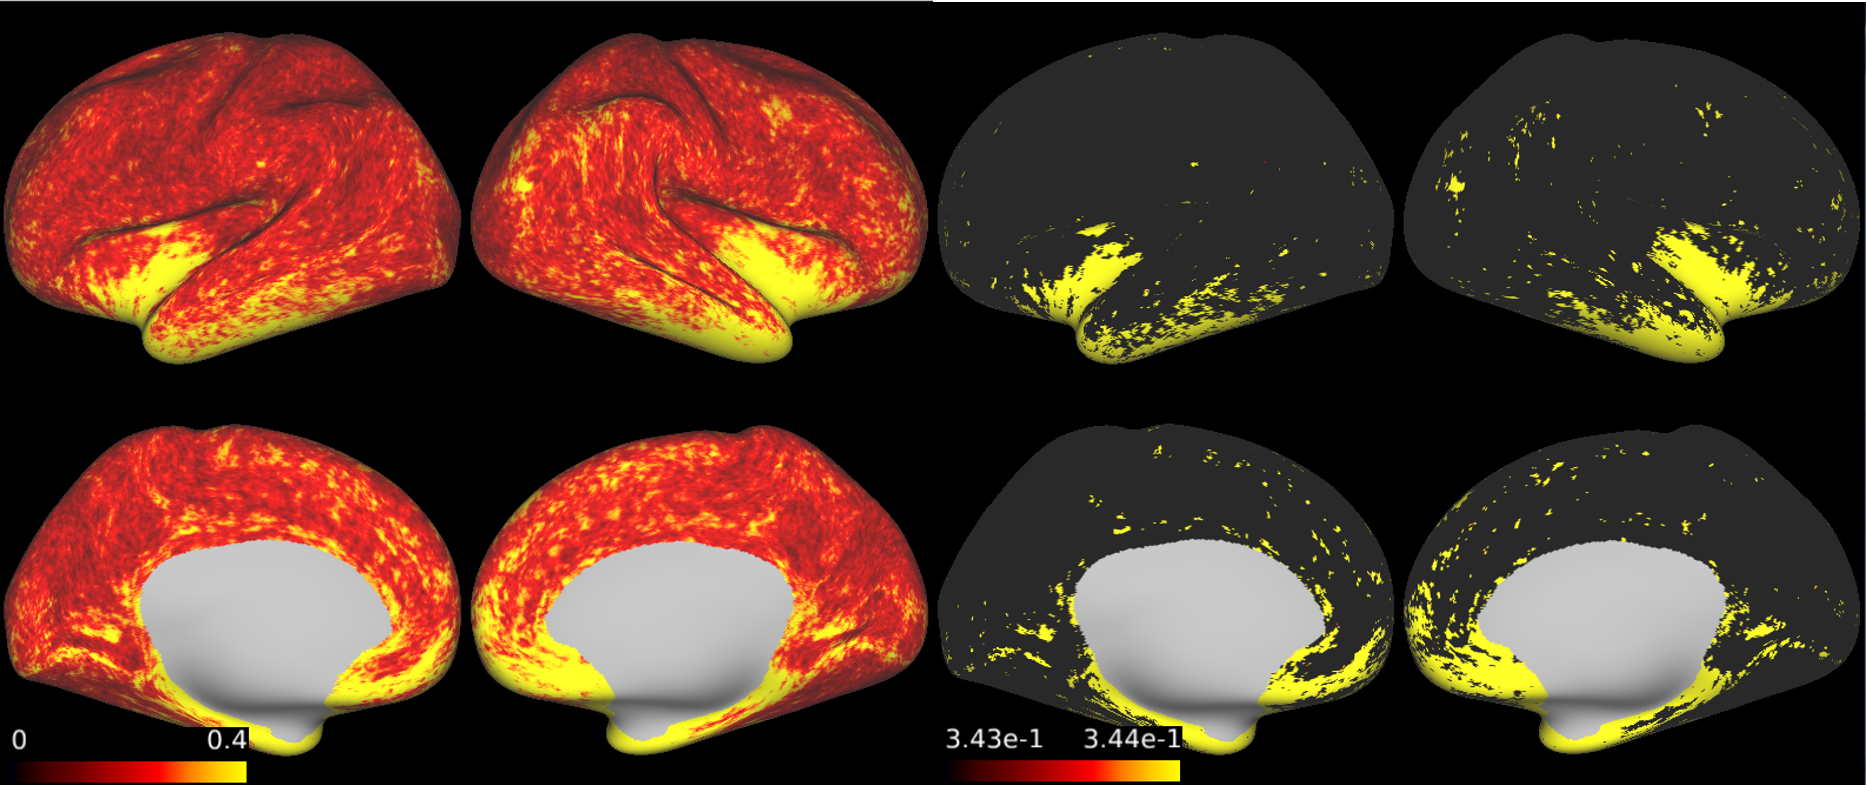
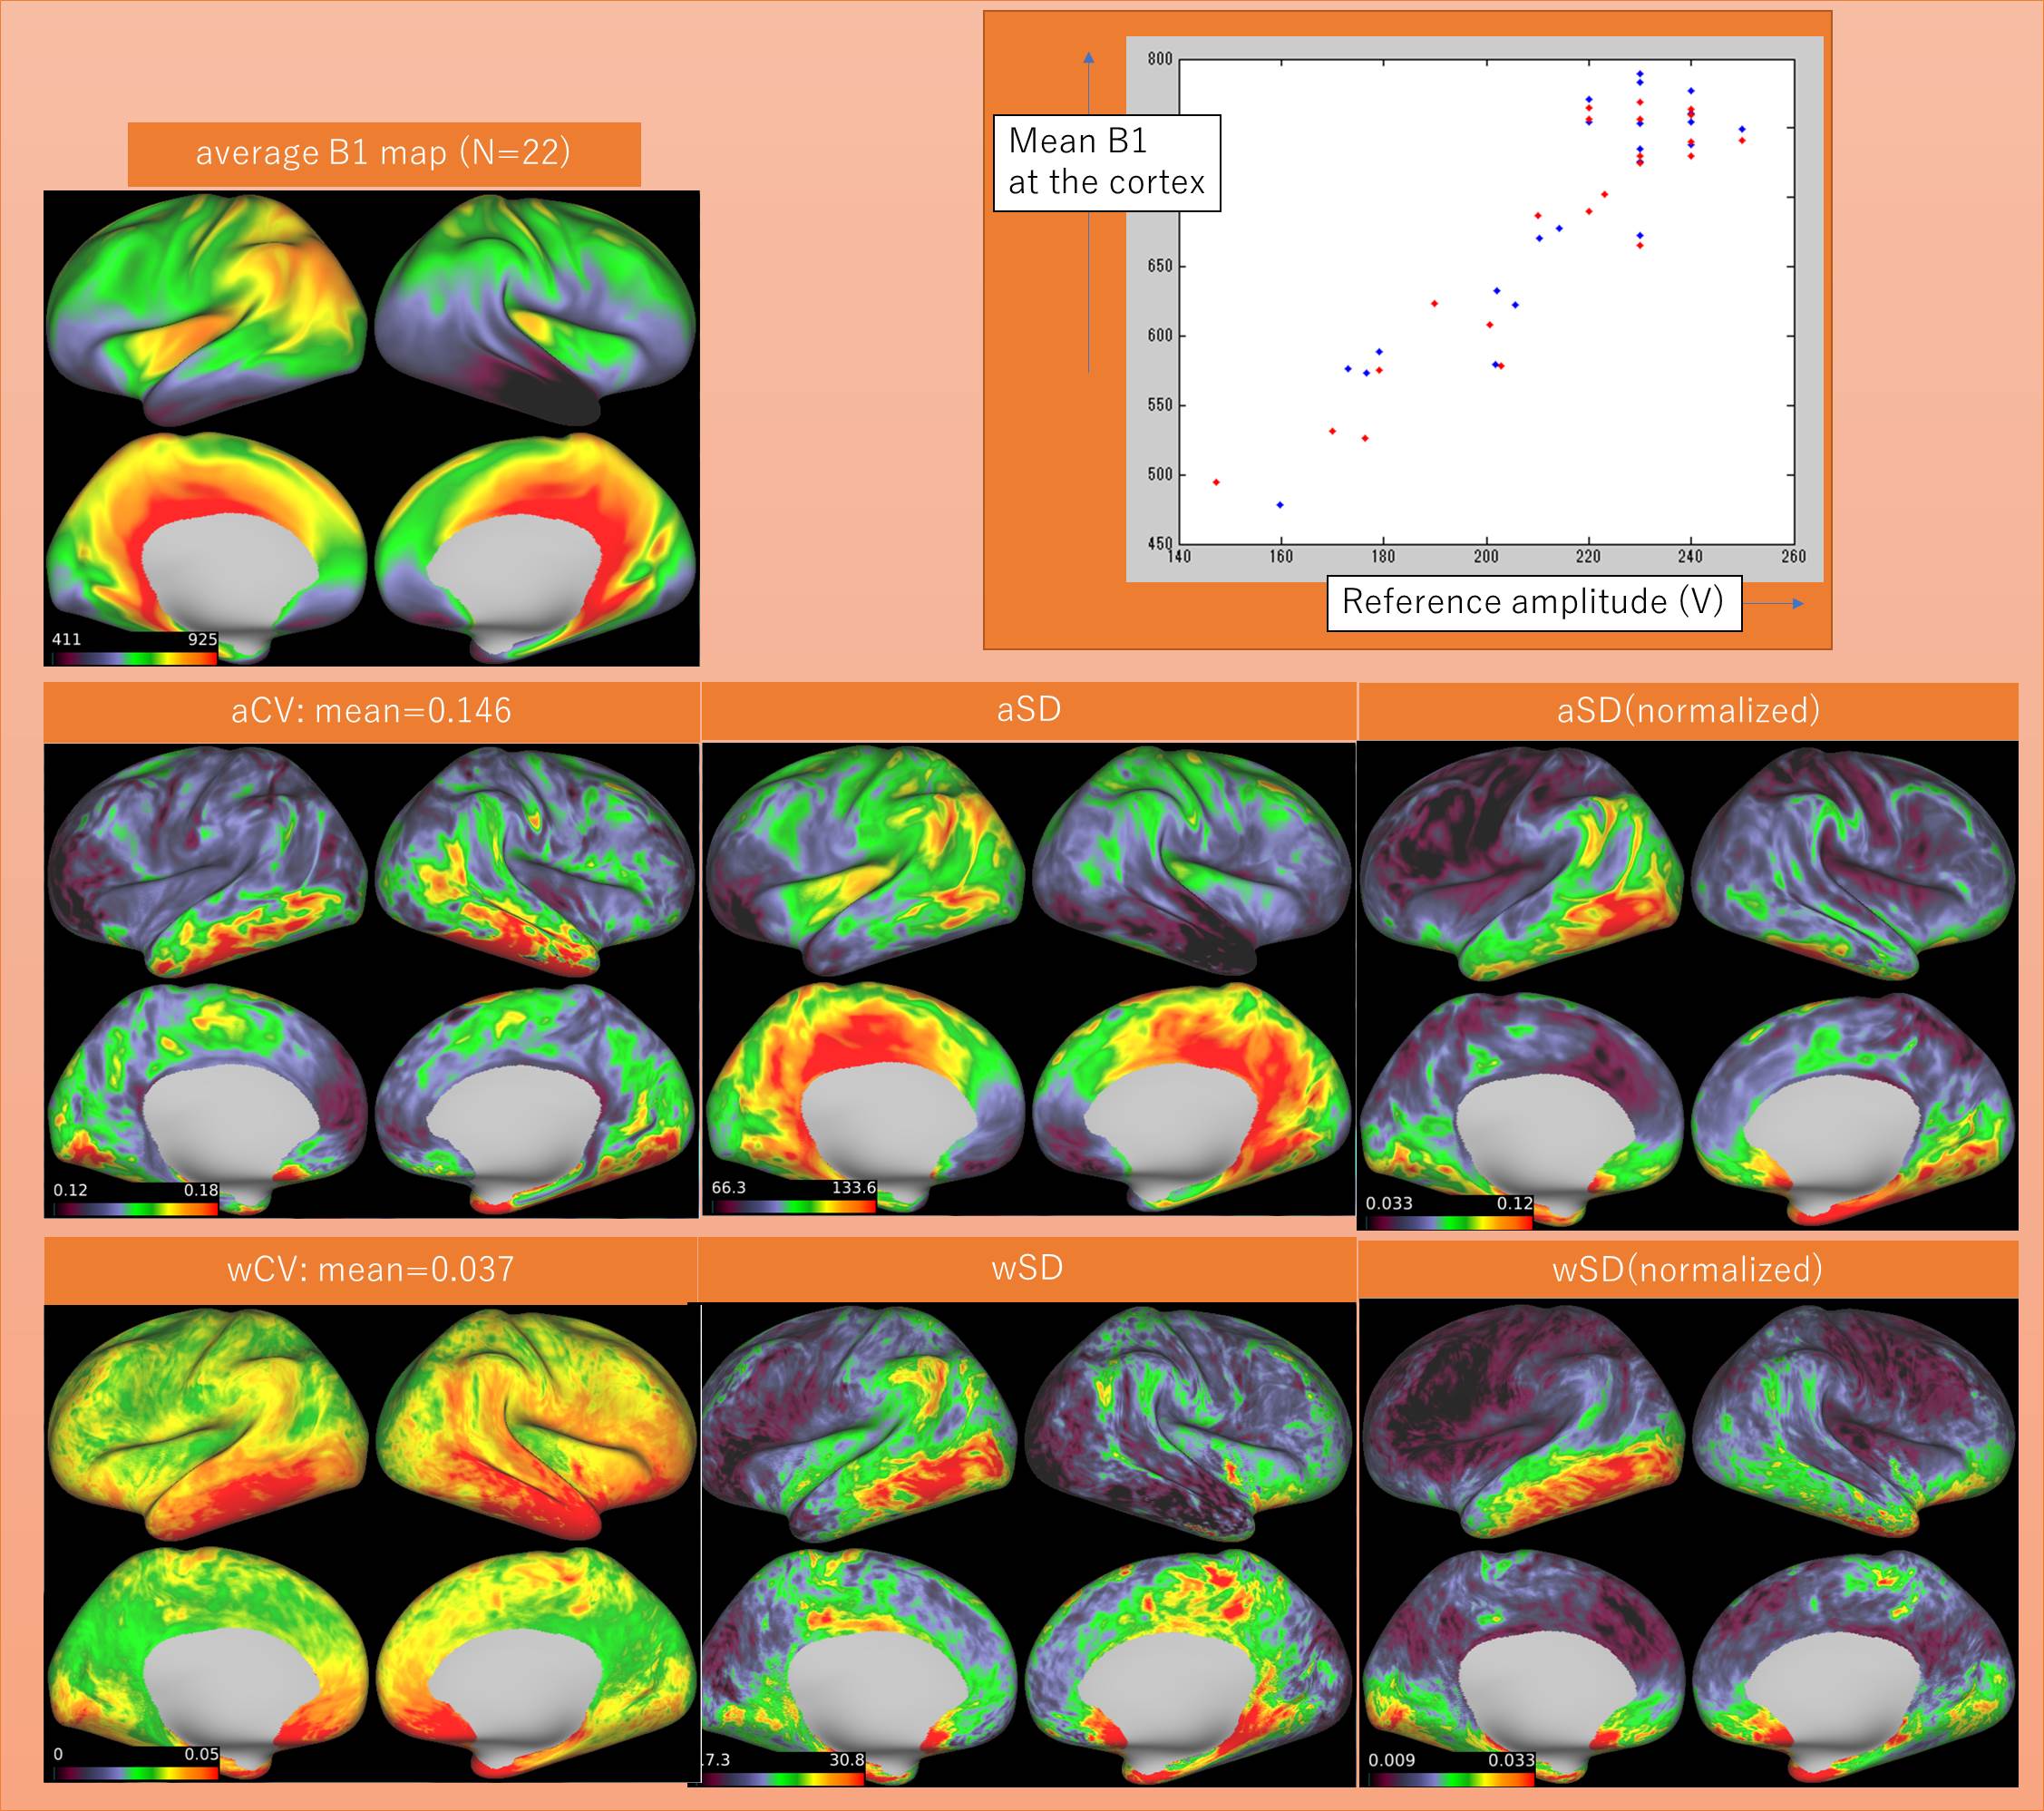
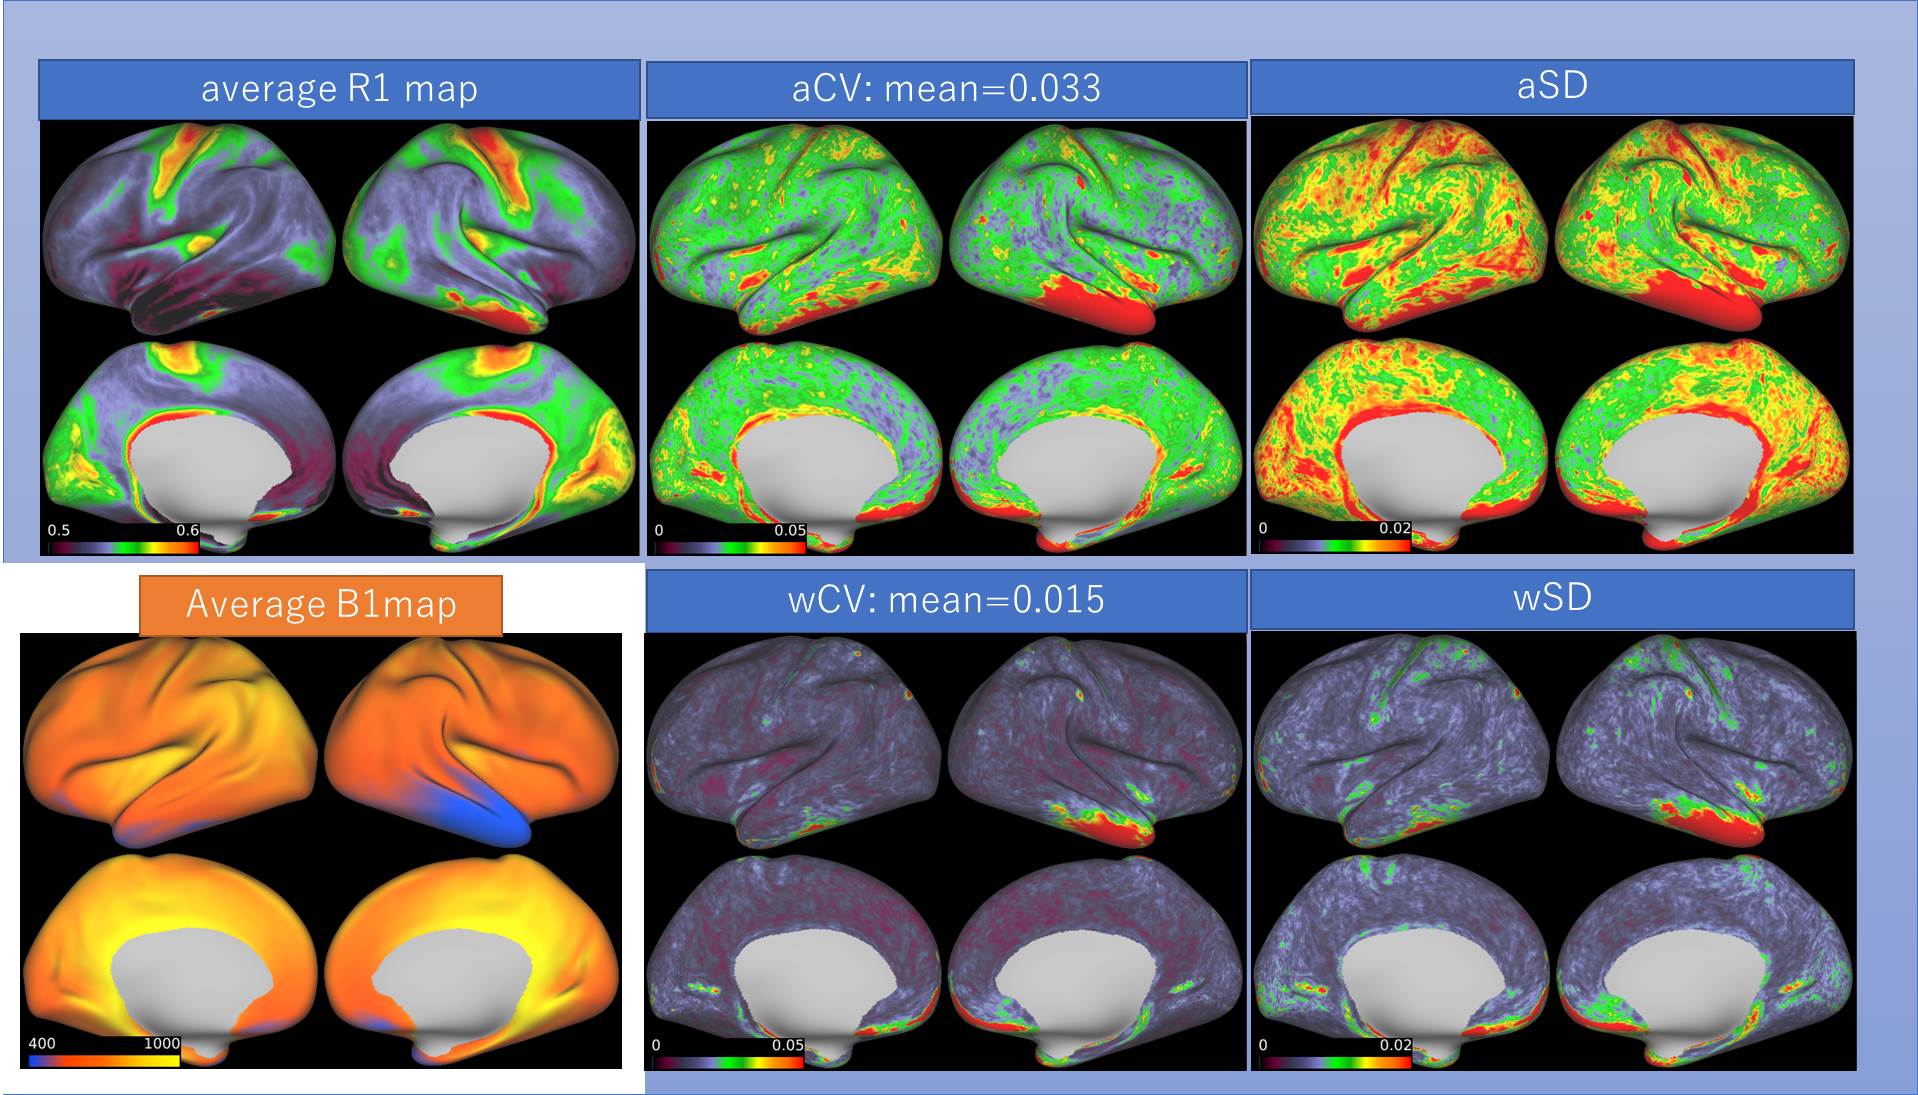
Mean, CV, SD and absolute differences are summarized in Table 1. The mean absolute difference (MAD) of cortical thickness was larger at the bilateral lower temporal lobes and insula (Figure 1). B1+ was lower for the right hemisphere, especially for the lower temporal lobe. B1+ at the right temporal lobe was as low as 10-20% of the nominal value. In general, aSD was high where the average B1+ is high, whereas aCV was high at the lower temporal lobe. When the data was normalized with the reference transmitter amplitude, aSD showed a similar trend. The almost linear relationship with average B1+ over the cortical surface in relation to the reference voltage is shown in figure 2. wCV and aCV of R1 were on average 1.5% and 3.3%, respectively. They were high at the right lower temporal area, where B1+ was low.Discussion
The MAD of 0.24mm was larger compared with the previous report at 3T [5]. This could be because we did not use a subject-specific atlas for precise registration, which is used in the previous study. Instead, we treated test-retest data as the independent subjects. Therefore, our data additionally included variations due to the HCP image processing pipeline. Difficulty in cortical segmentation at the insula, as well as the effect of low B1+ in the lower temporal lobe seems to be reflected in the result. Intra-subject variation of B1+ was large at the lower temporal lobe, whereas across-subject variation of B1+ seems to be due to different reference amplitude settings. The average R1 map showed similar result as a previous report [6]. Except for the lower temporal lobes, variation in the cerebral cortex R1 was very small for both intra-subject measurement (1.5%) and across-subject measurement (3%). This may imply that the measurement of R1 value has a great potential for translational research for clinical application.Conclusion
Measurement of R1 value for young adult brain was feasible at 7T with MP2RAGE. The measured R1 value was stable not only within subject but also across subjects.Acknowledgements
No acknowledgement found.References
1. Gracien RM, Nürnberger L, Hok P, et al. Evaluation of brain ageing: a quantitative longitudinal MRI study over 7 years, Eur Radiol. 2017: 27(4):1568-1576.
2. Marques JP, Kober T, Krueger G, et al. MP2RAGE, a self bias-field corrected sequence for improved segmentation and T1-mapping at high field, Neuroimage. 2010: 49(2):1271-81.
3. Glasser MF, Sotiropoulos SN, Wilson JA, et al. The minimal preprocessing pipelines for the Human Connectome Project, Neuroimage. 2013; 80: 105-24.
4. Kieran R. O'Brien, Tobias Kober et al. Robust T1-Weighted Structural Brain Imaging and Morphometry at 7T Using MP2RAGE. PLoS One. 2014; 9(6): e99676.
5. Fujimoto K, Polimeni JR, van der Kouwe AJ, et al. Quantitative comparison of cortical surface reconstructions from MP2RAGE and multi-echo MPRAGE data at 3 and 7 T, Neuroimage. 2014; 90: 60-73.
6. Marques JP, Khabipova D, Gruetter R. Studying cyto and myeloarchitecture of the human cortex at ultra-high field with quantitative imaging: R1, R2* and magnetic susceptibility, Neuroimage. 2017 15;147:152-163.
Figures