3291
Age-related changes in cortical thickness and R1 values measured at 7T1Human Brain Research Center, Kyoto University Graduate School of Medicine, Kyoto, Japan, 2Siemens Healthcare K.K., Tokyo, Japan, 3Advanced Clinical Imaging Technology, Siemens Healthcare AG, Lausanne, Switzerland, 4Department of Radiology, Centre Hospitalier Universitaire Vaudois (CHUV), Lausanne, Switzerland, 5Signal Processing Laboratory (LTS 5), École Polytechnique Fédérale de Lausanne (EPFL), Lausanne, Switzerland
Synopsis
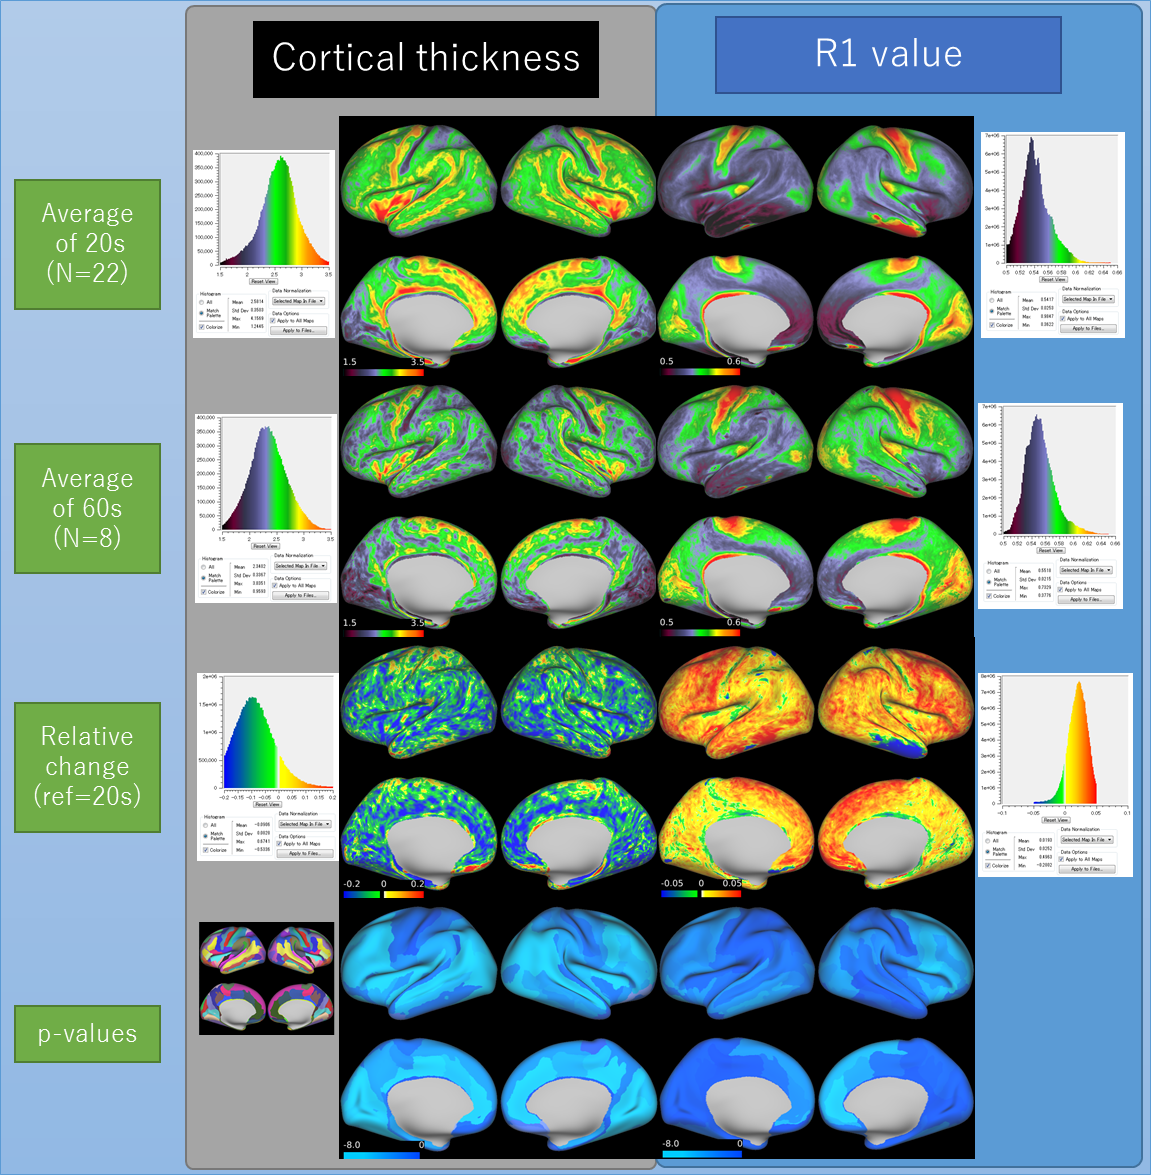
Healthy volunteers at the age between 20-30 (N=22) and over 60 (N=8) were scanned using a 7T MRI and a 1ch-Tx/32ch-Rx coil with a MP2RAGE prototype sequence at 0.7mm isotropic resolution. Cerebral cortex was segmented based on the human connectome project pipelines with some modifications to obtain cortical thickness and R1 on the gray-ordinate space. Results showed that the average cortical thickness decreased from 2.58 to 2.34 (9%) between the age groups; average R1 increased from 0.542 to 0.552 (1.9%). R1 change seems to have spatial predominance, with the preference in the frontal area.
Introduction
It is well known that human cerebral cortex shows atrophic change at later stages in life. However, it is not easy to quantitatively measure and compare these changes within or across subjects, due to the complicated morphological structure. Recently, image processing tools such as the FSL, FreeSurfer and HCP pipelines has enabled precise segmentation and parcellation of the individual cortex [1]. High-field 7T MRI scanner can provide high-resolution images of the brain, but increased B1+ inhomogeneity adds additional challenges. By acquiring two images at different time points during the recovery from one inversion pulse, the MP2RAGE sequence [2] is capable of mitigating B1+ inhomogeneity at 7T and enabling to generate volumetric quantitative R1 (=1/T1) maps. The R1 of the white matter (WM) is reported to show U-shaped change across the life-span [3]. R1 is considered to reflect the amount of myelin and iron in the cerebral cortex, with a possible link to degenerative disorders such as Alzheimer's disease. Recently, a longitudinal study has shown decrease in cortical R1 in a healthy aged group using 3T [4]. For clinical translation of R1 measurements of the human brain at 7T for diagnosis and prediction of disease outcome, accurate and robust measurements are required. With this in mind, the purpose of this study was to assess the capability of showing age-related change by means of cortical thickness and R1 of the cerebral cortex.Methods: image acquisition
Healthy volunteers at the age between 20-30 and over 60 were enrolled under approval of institutional review board. Twenty-five young subjects (mean 22.3, range 20-25) and eight elderly subjects (mean 69.4, range 62-76) were scanned using an investigational 7T whole-body MRI (MAGNETOM 7T, Siemens Healthcare, Erlangen, Germany) equipped with body gradients using a 1ch-Tx 32ch-Rx coil (Nova Medical, Wilmington, MA) between 2017/8/1-2017/9/28. Scanning protocol included MP2RAGE (prototype sequence) in 0.7-mm isotropic resolution with the following parameters: TI1/TI2/TR/TE/FA1/FA2/BW/echo spacing/matrix/GRAPPA/total acquisition time=800ms/2700ms/6000ms/2.9ms/4°/5°/260Hz/pix/6.8ms/284×284x256/R=3/9min20sec.Methods: data post-processing
One subject was excluded due to motion artifacts. The cerebral cortex was segmented based on a modified HCP pipeline using de-noised uniform images (UNI-DEN) [5] and T1 instead of MPRAGE and T2-TSE as an input, both obtained with MP2RAGE. After cortical segmentation, R1 values at the midline of the cortical gray matter (GM) were projected to the inflated cortical surface map for visualization.Methods: data analysis
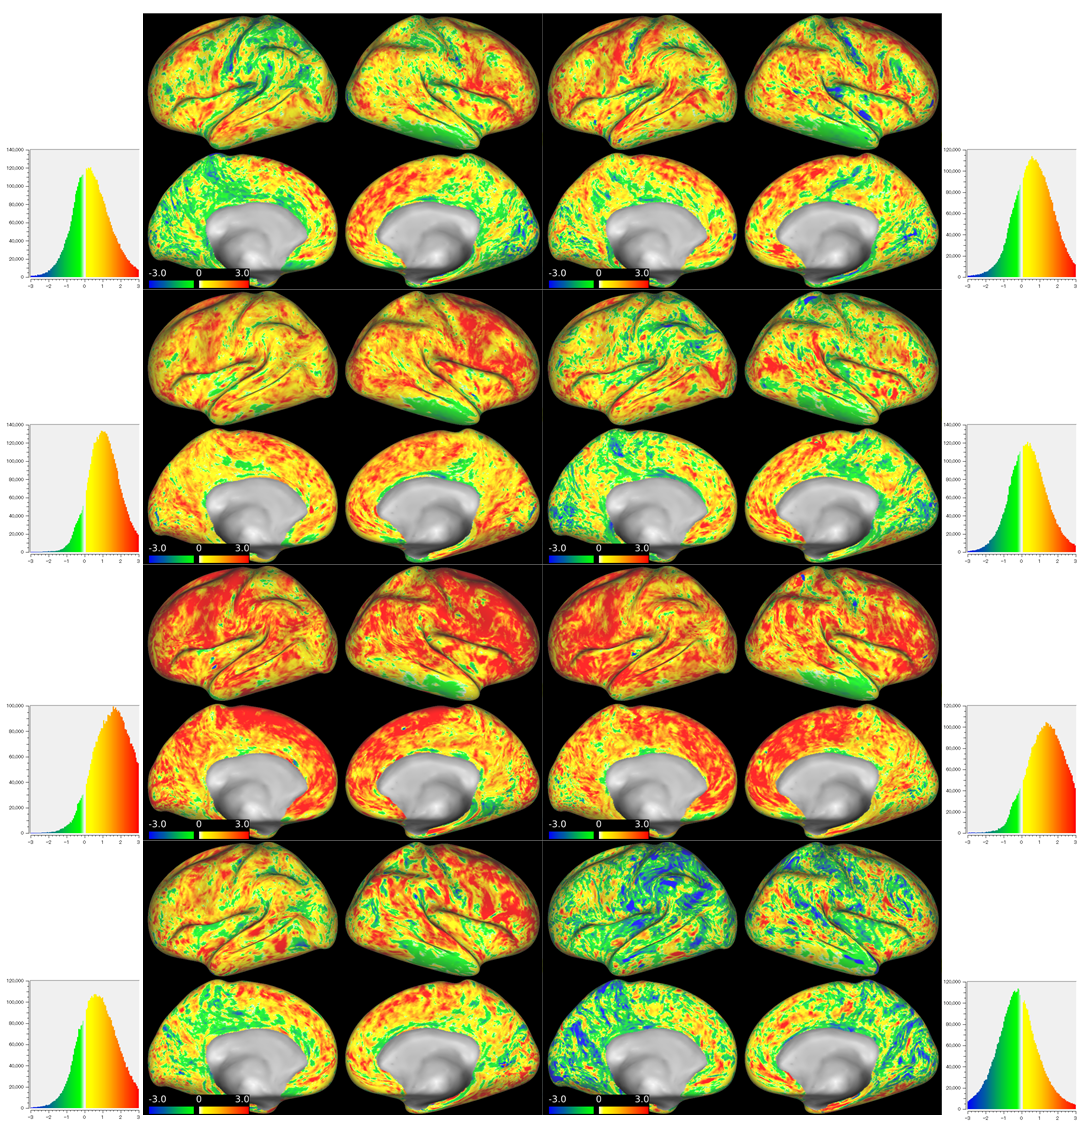
Two subjects were excluded due to severe registration errors, yielding a total of 30 subjects (22 for young, 8 for elderly) for the analysis. By using in-house Matlab scripts and Linux shell scripts with HCP workbench commands, the following metrics were calculated for both cortical thickness and R1 on the gray-ordinate space [1]: (1) average surface maps two groups, (2) Relative changes of the elderly group compared to the young group, and (3) Z-score maps for each subject in the elderly group by using the young group as reference. In addition, by using an atlas provided with HCP pipeline (aparca2009s), the data were averaged over each region and were compared with an unpaired two-sample t-test.Results
Group-wise were summarized in Figure 1. Mean and standard deviation (SD) of all the vertices on the surface map were summarized in Table 1. Z-score maps of elderly subjects were summarized for cortical thickness (figure 2) and cortical R1 value (figure 3). Average cortical thickness decreased from 2.58 to 2.34 (9%). Relatively large p-values were observed at the primary sensorimotor area, lower temporal area and frontal base. Regional difference was not apparent on Z-score maps. Z-score maps and corresponding histogram showed decreased cortical thickness in all elderly subjects. Average R1 values increased from 0.542 to 0.552 (1.9%). R1 change seems to have spatial predominance, with the preference in the frontal area. Z-score maps and corresponding histogram showed increased R1 value except for one subject (Figure 3).Discussion
Our result of the cortical thickness distribution confirmed previous reports [1,6] , suggesting validity of the cortical segmentation using MP2RAGE. The average R1 map showed similar result with a previous report [7]. The cortical thickness did not show spatial preferences, whereas R1 value tends to decrease more in the frontal area of the cortex.. However, precise measurement of the R1 value has to be investigated because (1) the change is relatively small (2%), and (2) there is significant subject-to-subject variability in our data.Conclusion
Age-related change in cortical thickness and R1 value was successfully shown by using a 7T scanner. The change in the cortical R1 value seems to have regional predominance.Acknowledgements
No acknowledgement found.References
1. Glasser MF, Sotiropoulos SN, Wilson JA, et al. The minimal preprocessing pipelines for the Human Connectome Project, Neuroimage. 2013; 80: 105-24.
2. Marques JP, Kober T, Krueger G, et al. MP2RAGE, a self bias-field corrected sequence for improved segmentation and T1-mapping at high field, Neuroimage. 2010: 49(2):1271-81.
3. Okubo G, Okada T, Yamamoto A, et al. Relationship between aging and T1 relaxation time in deep gray matter: A voxel-based analysis. J Magn Reson Imaging, 2017: 46(3): 724-731.
4. Gracien RM, Nürnberger L, Hok P, et al. Evaluation of brain ageing: a quantitative longitudinal MRI study over 7 years, Eur Radiol. 2017: 27(4):1568-1576.
5. Kieran R. O'Brien, Tobias Kober et al. Robust T1-Weighted Structural Brain Imaging and Morphometry at 7T Using MP2RAGE. PLoS One. 2014; 9(6): e99676.
6. Fujimoto K, Polimeni JR, van der Kouwe AJ, et al. Quantitative comparison of cortical surface reconstructions from MP2RAGE and multi-echo MPRAGE data at 3 and 7 T, Neuroimage. 2014; 90: 60-73.
7. Marques JP, Khabipova D, Gruetter R. Studying cyto and myeloarchitecture of the human cortex at ultra-high field with quantitative imaging: R1, R2* and magnetic susceptibility, Neuroimage. 2017 15;147:152-163.
Figures