3290
A novel method to detect fractional anisotropy differences in short association fibers discriminated by their functional connectivity between Multiple Sclerosis patients and healthy subjects1Biomedical Imaging Center, Pontificia Universidad Católica de Chile, Santiago, Chile, 2Electrical Engieneering, Pontificia Universidad Católica de Chile, Santiago, Chile, 3Interdisciplinary Center of Neurosciences, Pontificia Universidad Católica de Chile, Santiago, Chile, 4Faculty of Engineering, Universidad de Concepción, Chile, Concepción, Chile, 5Neurology Department, Pontificia Universidad Católica de Chile, Santiago, Chile, 6Radiology Department, School of Medicine, Pontificia Universidad Católica de Chile, Santiago, Chile, 7Institute for Biological and Medical Engineering, Schools of Engineering, Medicine and Biological Sciences, Pontificia Universidad Católica de Chile, Santiago, Chile
Synopsis
We propose a novel method to evaluate fractional anisotropy (FA) differences in short association fibers (U-fibers) between patients with relapsing-remittent multiple sclerosis (RRMS) and healthy subjects by classifying each U-fiber in different groups according to their functional connectivity.
Introduction
A traditional approach for the analysis and comparison of FA for U-fibers between healthy and non-healthy people is the use of a statistical test across all fibers (1-3). These tests assume that samples are independent. However, it is known that fibers in the brain are not independent, they connect structurally and functionally (4). Furthermore, if one performs a statistical analysis over 100 U-fibers (5) (assuming independency), the probability of finding significant difference in at least one fiber between two groups is 99.4% (1-0.95^100), assuming an alpha error of 5%. Therefore, this analysis is not only incorrect but also may overestimate the number of fibers that are significant different.
In this work, we propose a novel method that considers the functional connectivity as a way to discriminate independent groups of U-fibers, before applying a statistical analysis to DTI data.
Methods
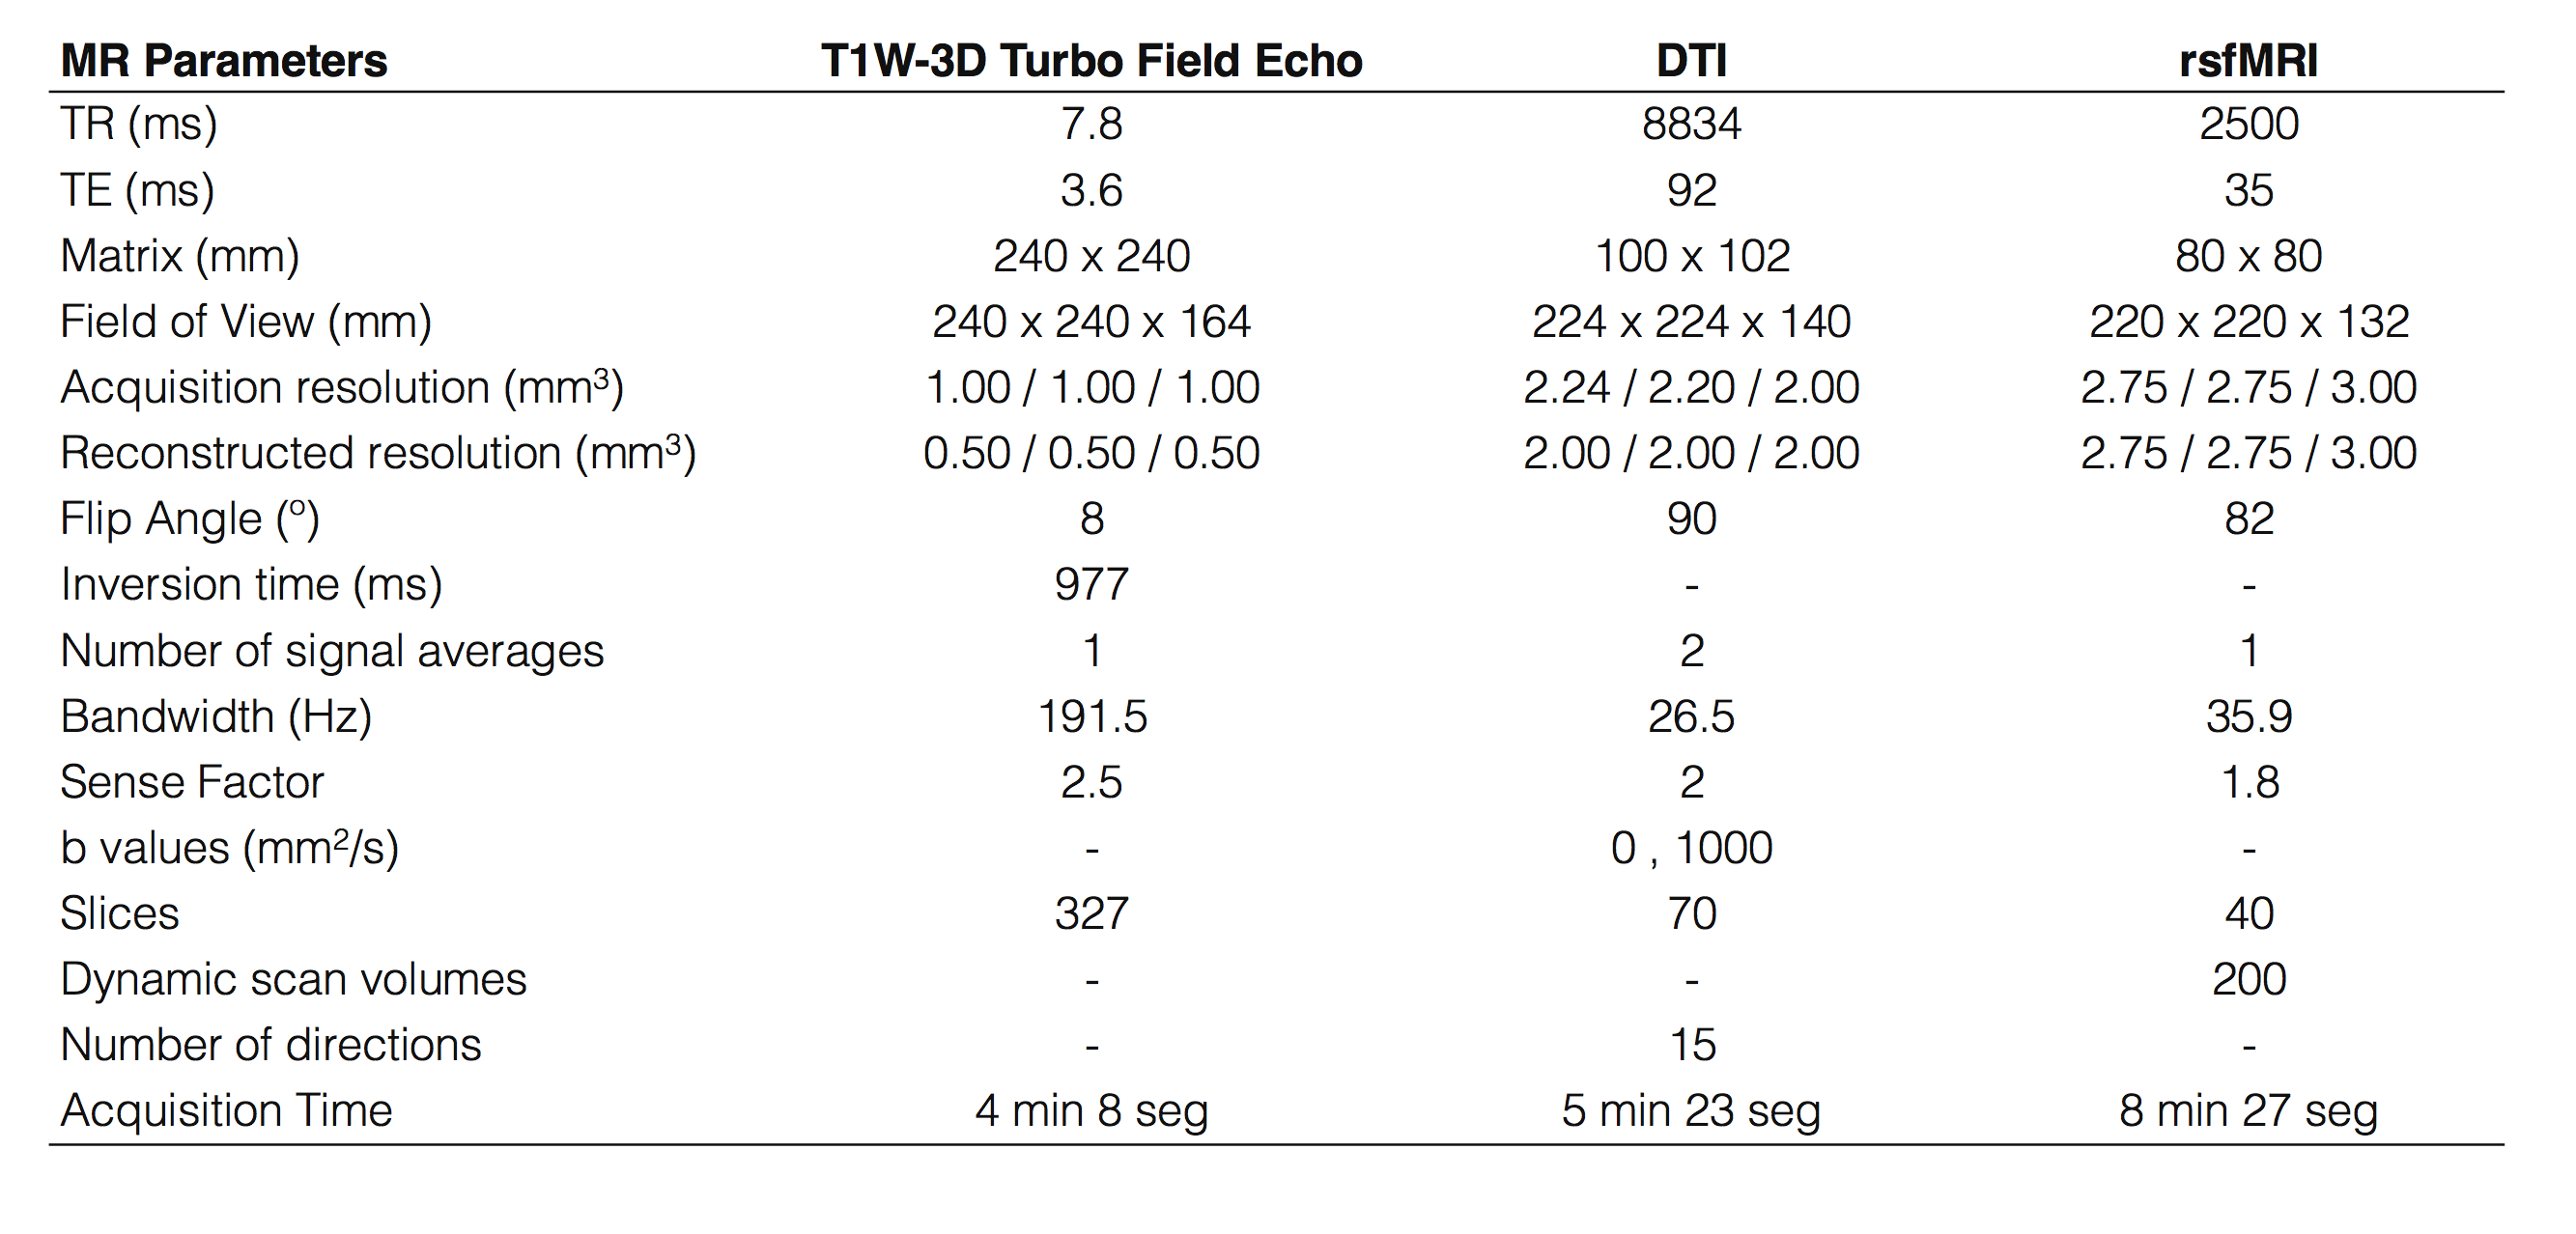
Forty-six RRMS patients and forty-six healthy subjects participated in this study. T1W-3D, DTI and rsfMRI images (Table 1) were acquired on a 3T MR scanner (Philips Ingenia). DTI were acquired to calculate FA maps. rsfMRI were used to obtain functional connectivity (BOLD signal correlation).
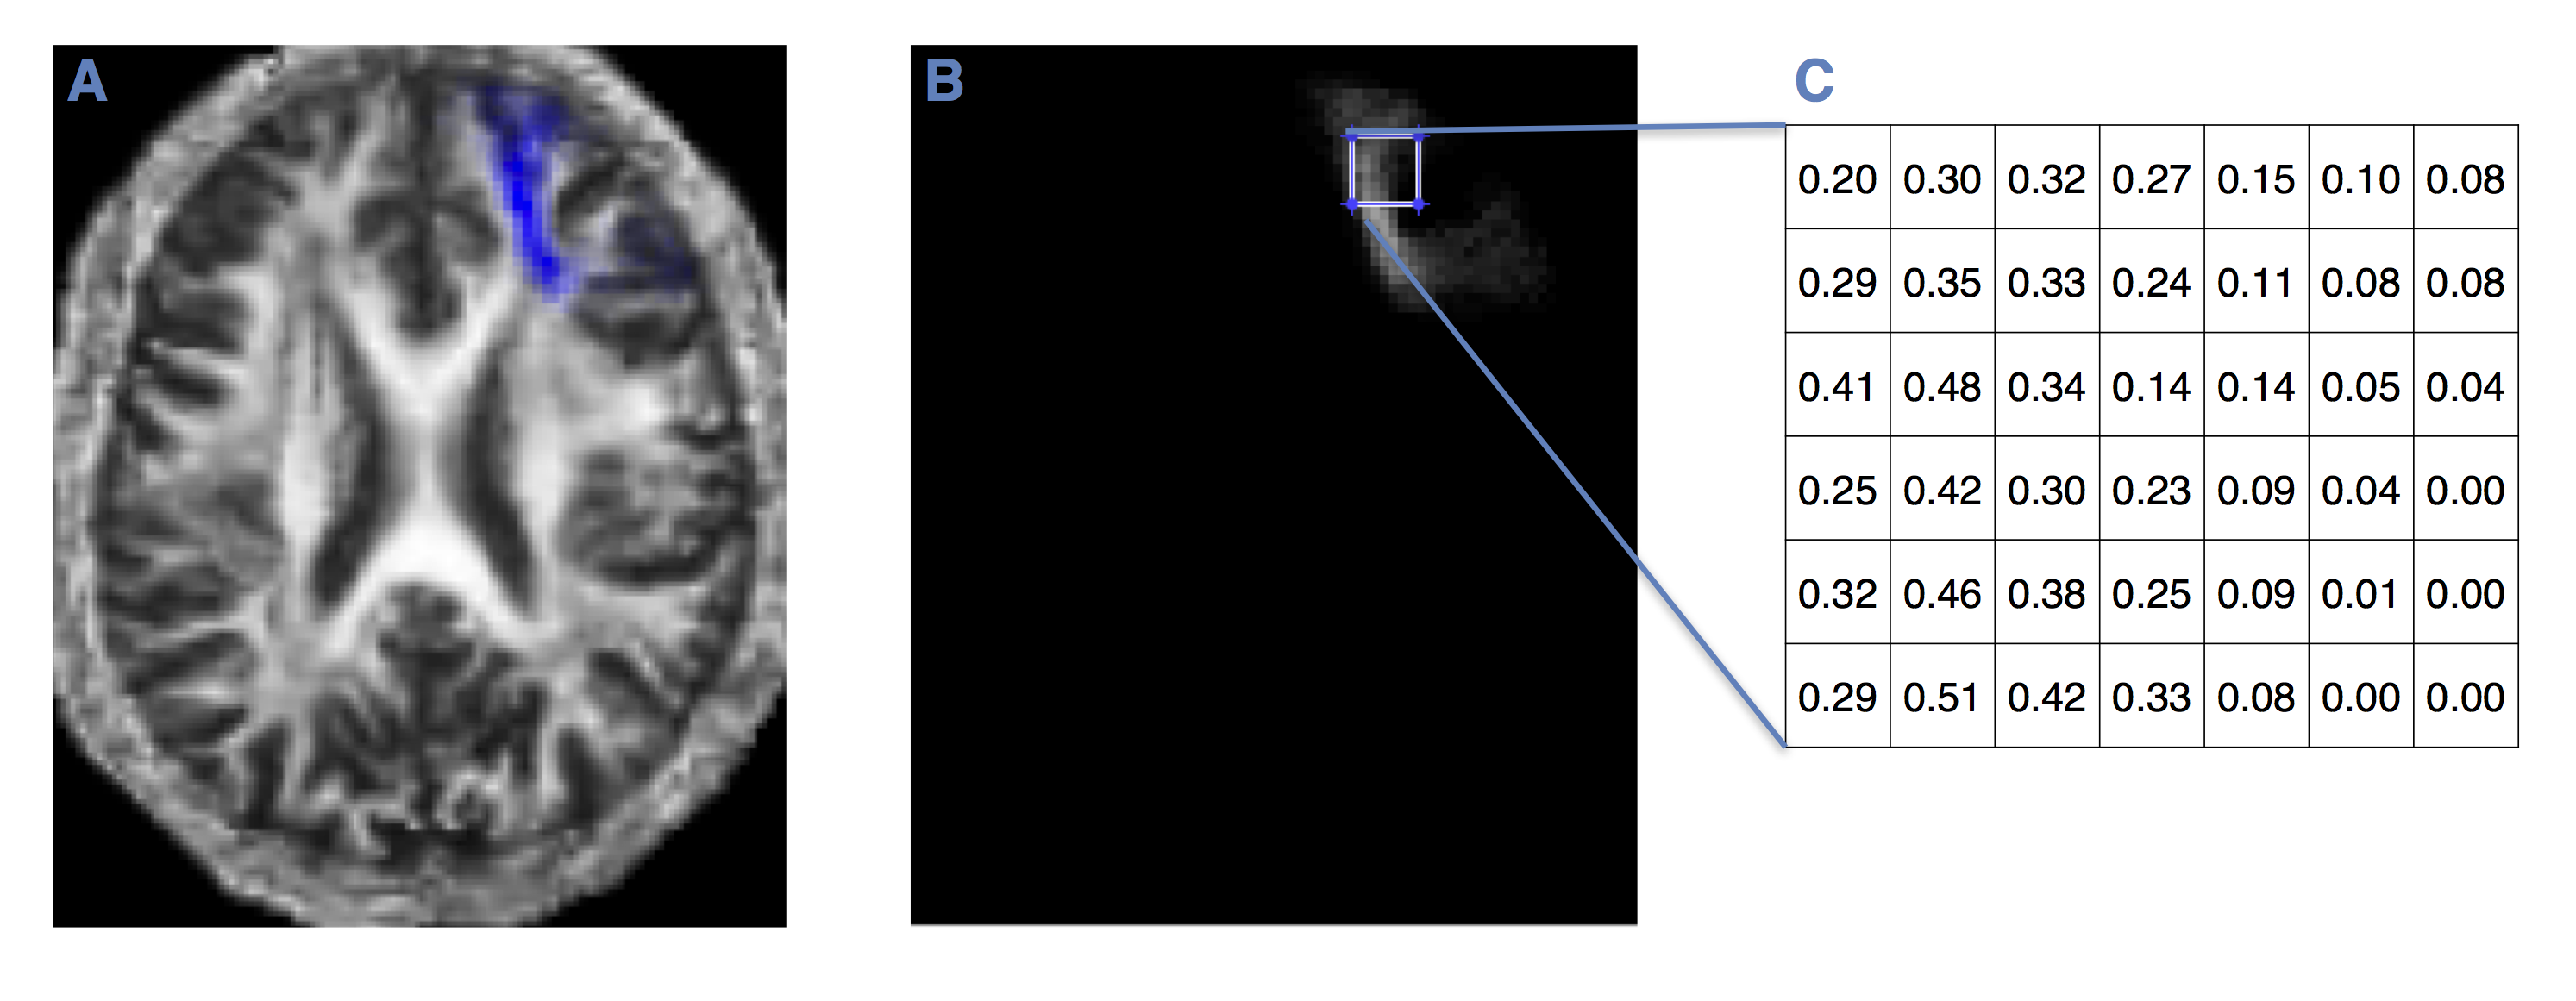
100 probabilistic masks of U-fibers from LNAO-SWM79 Atlas (5) were applied to each subject to obtain the mean FA multiplied for each voxel’s spatial localization probability of each U-fiber (FIG. 1). A threshold was applied to the BOLD signal correlation to obtain different dependent groups of fibers. We made a sensitivity analysis varying the threshold from 0.5 to 0.7 every 0.025. We also included a threshold of 0.825.We analyzed the FA differences between healthy and RRMS patients in the dependent groups applying a Hotelling's T-Squared test. Independent fibers were analyzed with a one-way ANOVA and a post hoc test. For comparison, a Wilcoxon rank test between each fiber and a one-way ANOVA using the whole dataset was performed.
Results
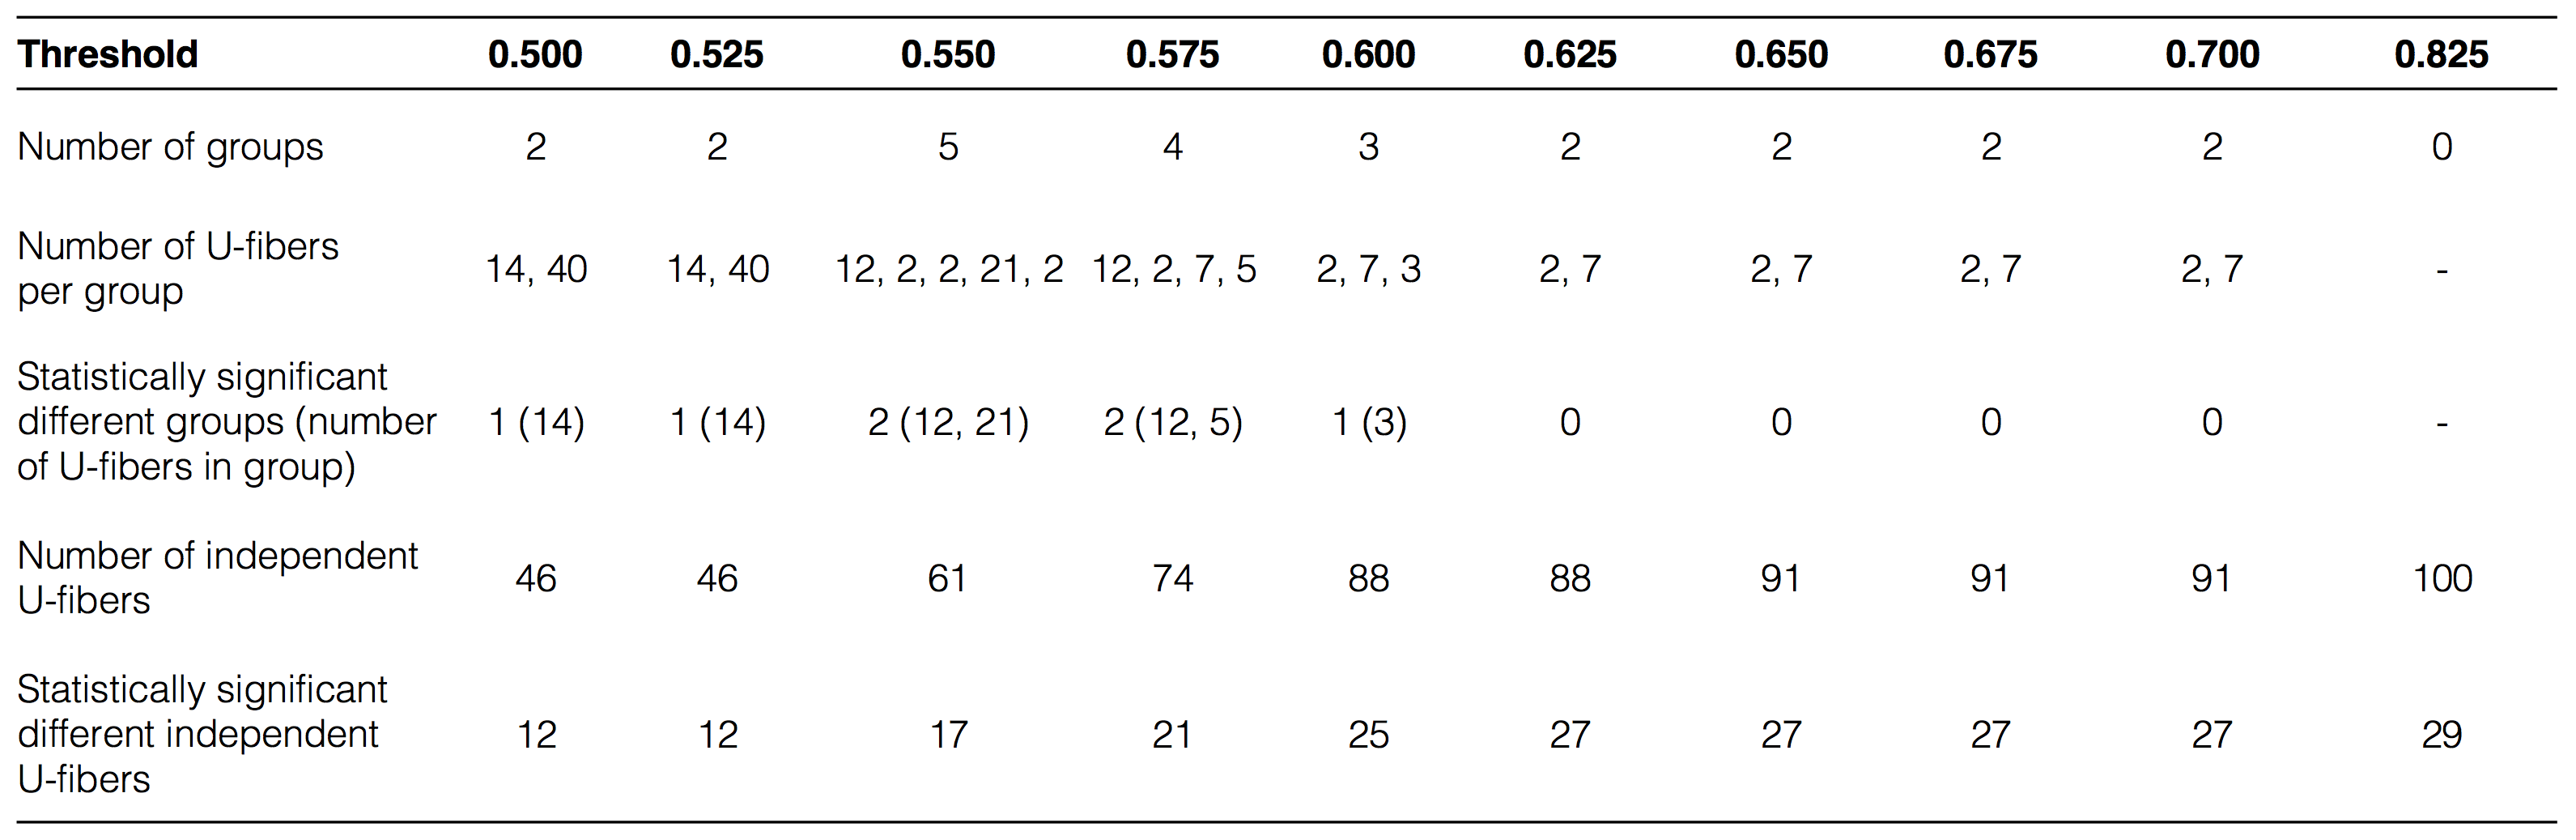
Table 2 shows the number of U-fibers with significant difference between healthy and RRMS subjects. We observed that, as expected, as the threshold increases, the amount of dependent fibers per group decreases and the number of independent fibers increases. For a threshold of 0.825, all fibers were functionally independent. For a threshold of 0.5, we found two groups of 14 and 40 dependent U-fibers and 46 fibers independent from each other. Of those, we found that only the group with 14 U-fibers and 12 of the 46 were statistically different between volunteers and patients.
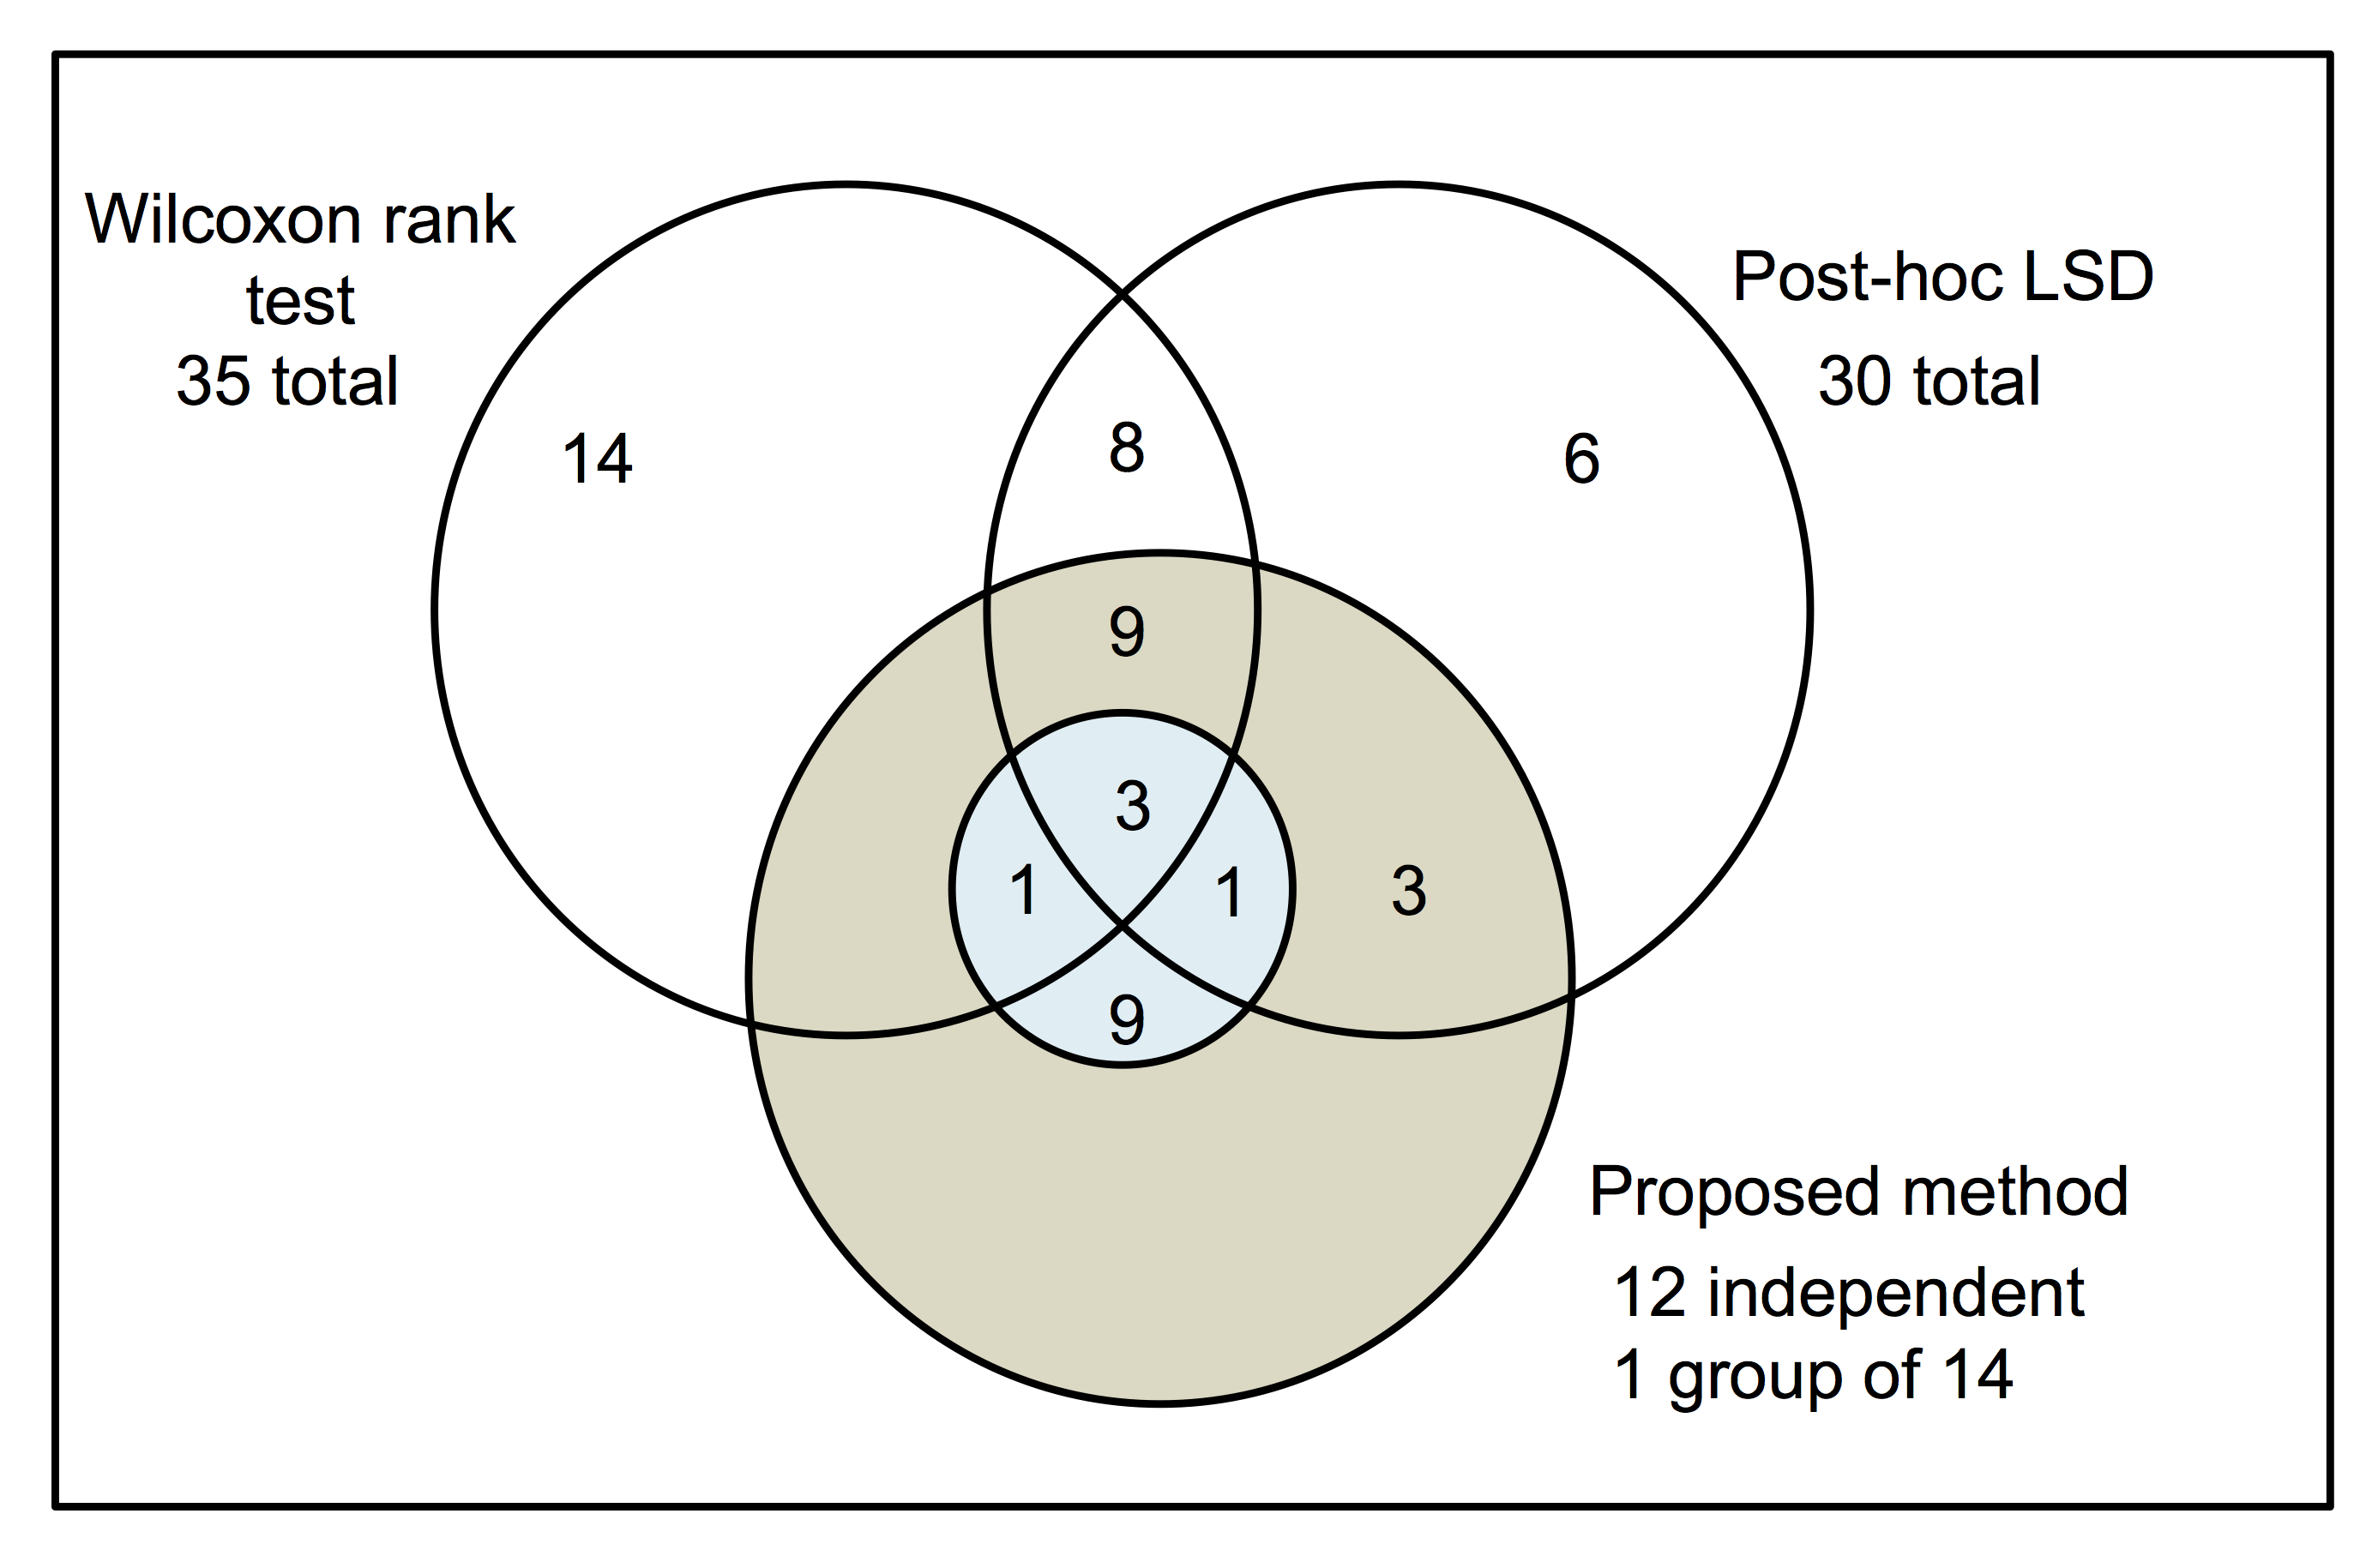
The intersection of the results of the group of fibers for a threshold of 0.5 between the Wilcoxon and ANOVA test with the proposed method are summarized in FIG. 2. 35 U-fibers were found different between volunteer and patients using the Wilcoxon method, while 30 were found with the ANOVA test. The proposed method found 12 independent U-fibers and a group of 14 dependent U-fibers. Nevertheless, the intersection between all methods were 9 independent U-fibers and 3 U-fibers (from the group of 14 dependent fibers).
Discussion and conclusion
We have proposed a novel method that allows a correct statistical comparison of the FA of U-fibers between different groups. The proposed method allows to classify these fibers in dependent and independent groups by their functional connectivity and then analyze them to find differences between groups. We applied this method to differentiate the FA in 100 U-fibers and found 9 independent fibers and 1 group of 14 fibers to be different between RRMS patients and healthy subjects for a threshold of 0.5.Acknowledgements
Grant Sponsor: Anillo ACT1416.References
1.- Shukla DK. Microstructural abnormalities of short-distance white matter tracts in autism spectrum disorder. Neuropsychologia. 2011 Apr;49(5):1378-1382.
2.- Sedlacik J, Schüre, J, Boelmans K, Fiehler J. “Microstructural Changes of Short Association Fibers in Parkinson's Disease and Normal Aging Assessed by Diffusion Tensor Imaging”. Poster 2207 Mechanisms of Neural Degeneration & Damage 13:30 - 15:30, 3rd June, 2015. ISMRM annual meeting, 30th May – 5th June 2015, Ontario, Canada. http://cds.ismrm.org/protected/15MPresentations/abstracts/2207.pdf
3.- Gao J, Cheung RT, Chan YS, Chu LW, Mak HK, Lee TM. The relevance of short-range fibers to cognitive efficiency and brain activation in aging and dementia. PLoS One. 2014 Apr 2;9(4):e90307.
4.- Honey CJ, Sporns O, Cammoun L, Gigandet X, Thiran JP, Meuli R, Hagmann P. Predicting human resting-state functional connectivity from structural connectivity.Proc Natl Acad Sci U S A. 2009 Feb 10;106(6):2035-40.
5.- Guevara M, Román C, Houenou J, Duclap D, Poupon C, Mangin JF, Guevara P. Reproducibility of superficial white matter tracts using diffusion-weighted imaging tractography. Neuroimage. 2017 Feb 15;147:703-725.
Figures