3289
Brain metabolic and connectivity changes associated to the progression of Alzheimer's disease in a transgenic rat model1Experimental 7T MRI Unit, Institut d'Investigacions Biòmediques August Pi i Sunyer (IDIBAPS), Barcelona, Spain, 2Champalimaud Foundation, Lisbon, Portugal, 3CIBER de Bioingeniería, Biomateriales y Nanomedicina (CIBER-BBN) Group of Biomedical Imaging of the University of Barcelona, Barcelona, Spain
Synopsis
TgF344-AD is a transgenic rat model of Alzheimer’s disease (AD) that shows all its pathological hallmarks in a progressive way. A cohort of transgenic rats and their control littermates were scanned at different time-points from early adulthood to aged animals, including spectroscopy and diffusion-weighted MRI. Acquisitions were processed to obtain regional structural connectivity parameters and metabolite concentrations in hippocampus and striatum. Decrease in network metrics in both regions at different ages, and increases in glutamine and decreases in glutamate, NAA, NAAt and taurine were observed in the transgenic group. Thus, multimodal MRI can improve characterization of different AD stages.
Introduction
TgF344-AD is a transgenic rat model of Alzheimer’s disease (AD) that shows all the pathological hallmarks of the disease in a progressive way1, and therefore its longitudinal evaluation can contribute to understand the disease at different stages. Changes in the metabolic profile between 8 and 15 months of age2 and in whole brain structural connectivity before 6 months of age3 have been reported. Here, regional structural connectivity parameters and metabolite concentrations are analysed to identify patterns of brain alterations associated to AD at different time-points from early adulthood to aged animals.Methods
A cohort of 10 transgenic TgF344-AD rats and 10 control littermates was scanned on a 7T Bruker BioSpec in two sessions: first, T2 and diffusion weighted magnetic resonance imaging (60 gradient directions, b-value=1000 mm²/s, voxel size=0.3x0.3x0.3mm³) were acquired to estimate the structural connectome and, one week after, magnetic resonance spectroscopy (MRS) was performed, including T2-weighted reference images in the three orthogonal planes followed by localized proton spectroscopy (PRESS, TR/TE=5000/12 ms, 10μl/voxel). Two regions were considered by MRS: hippocampus and striatum (Figure 1). For each region, a partially water-suppressed spectrum (VAPOR on; 256 averages) and a non-suppressed reference water signal (VAPOR off; 8 averages) were acquired. Animals were anesthetized with isoflurane (60-80 breaths-per-minute) and heated with a recirculating water bed. Acquisitions were performed at 5.5, 8.5, 11.5 and 15 months of age.
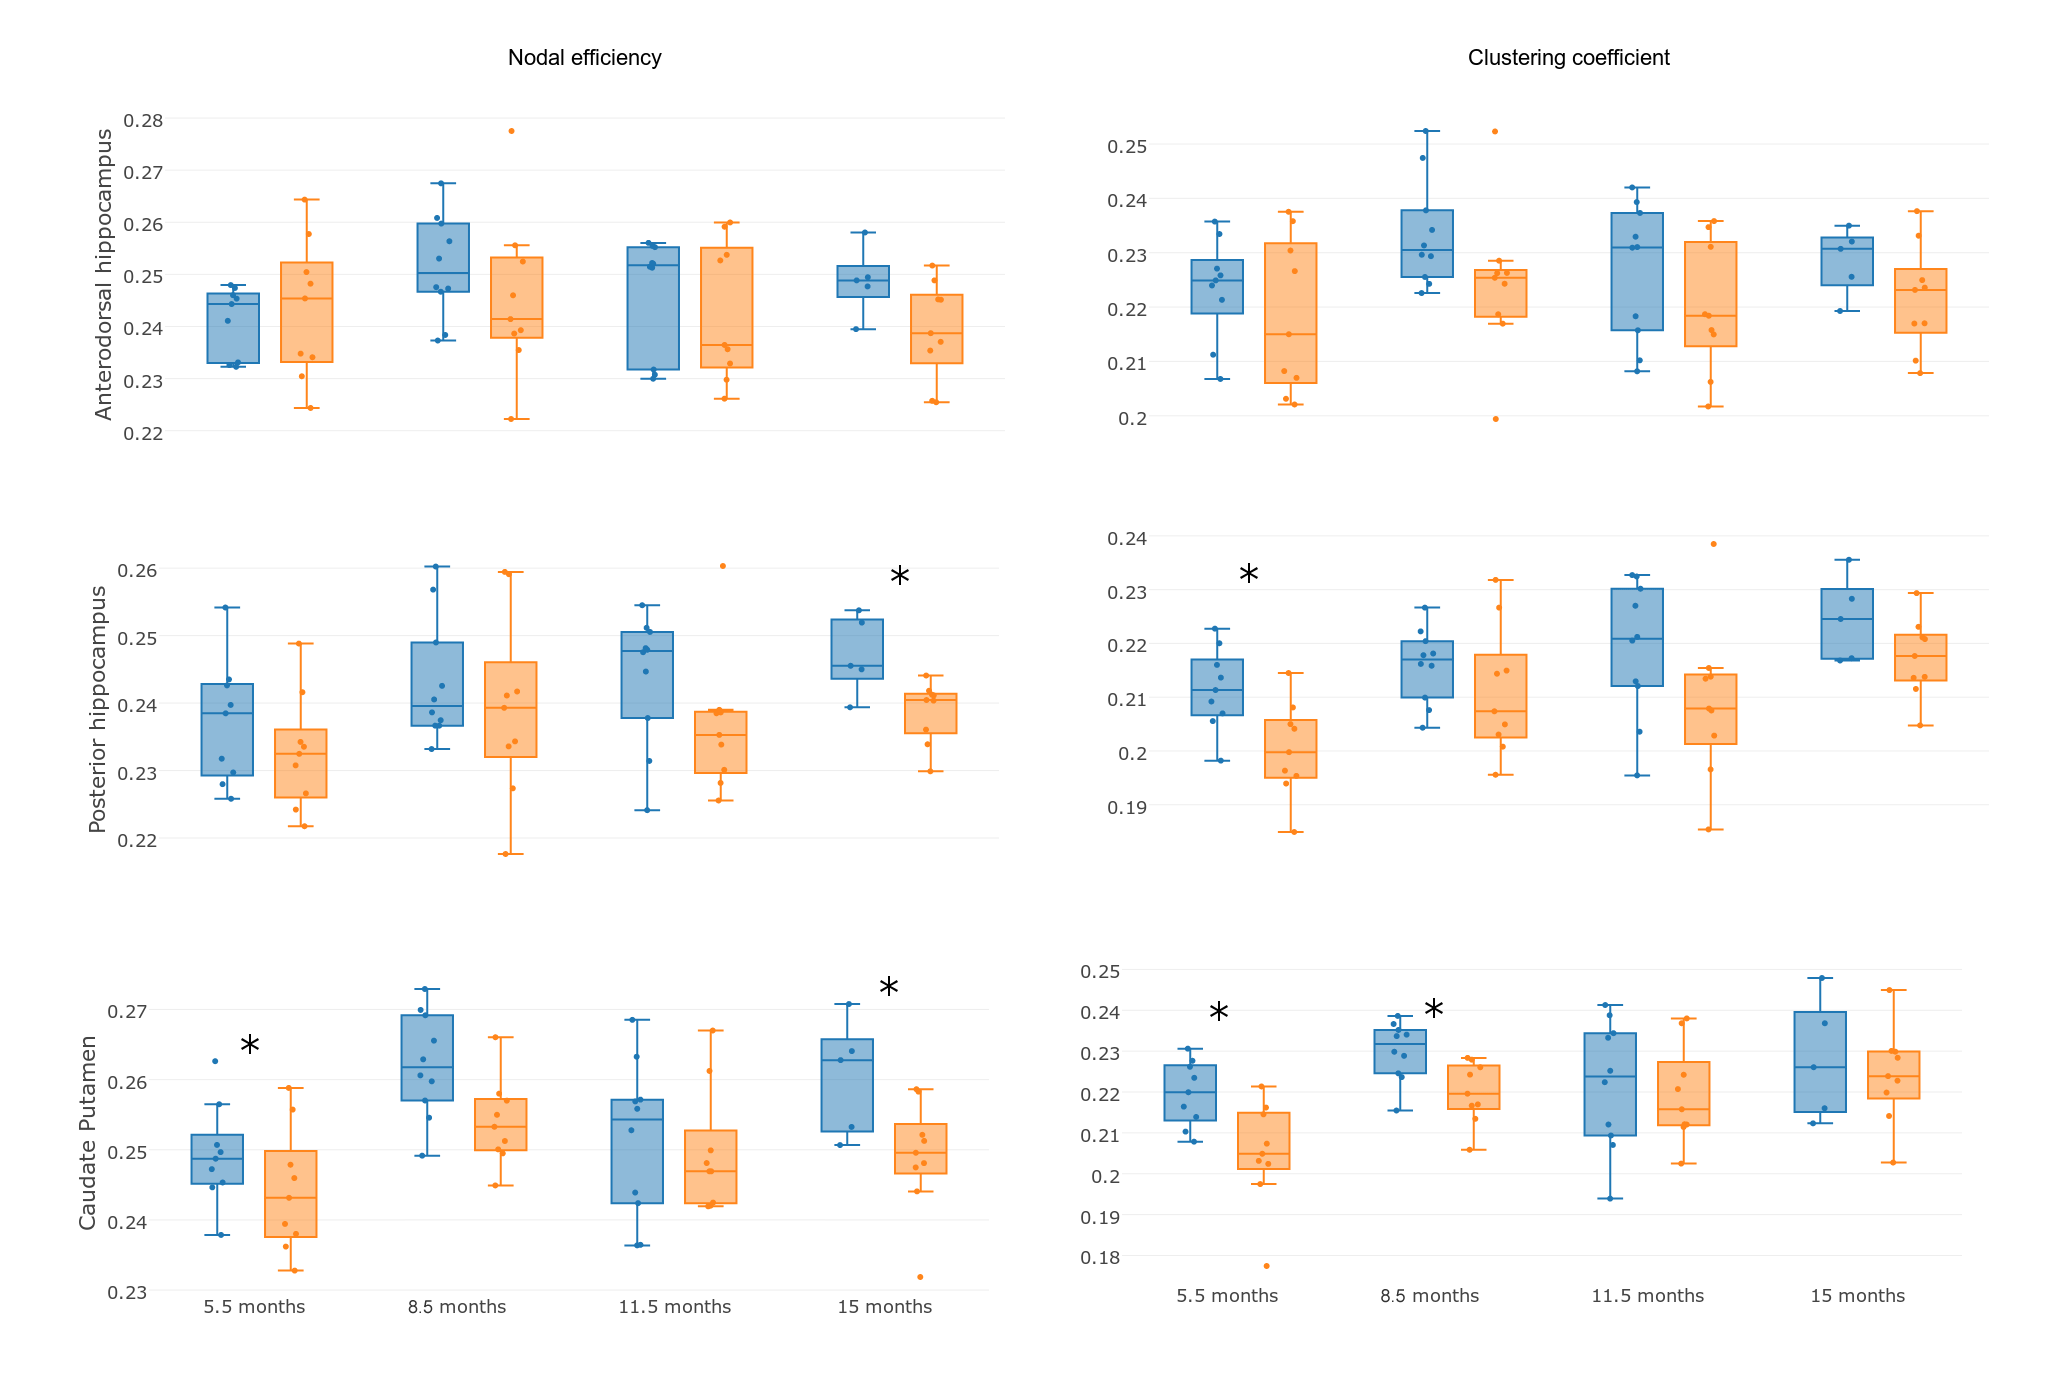
T2-weighted and diffusion MRI were processed to obtained the structural connectome3,4, including brain segmentation in white matter (WM), grey matter (GM) and cerebrospinal fluid (CSF), parcellation according to a modified version of a rat brain atlas3,5 and tractography based on constrained spherical deconvolution as implemented in Dipy6. A connectome matrix was built per each subject, considering two regions connected if there was at least one streamline between them, and weighting the connection by the averaged fractional anisotropy (FA) in the connecting streamlines. Regional network metrics (nodal efficiency and clustering coefficient) were computed7 in right anterodorsal and posterior hippocampus, which comprise the MRS hippocampus voxel, and right caudate putamen, that includes the MRS striatum voxel (Figure 1).
The MRS T2 reference images were processed to segment the brain in WM, GM and CSF, and calculate their relative contributions to each voxel2. MRS data were quantified by LC Model, fitting a basis set of 19 small metabolites and 9 macromolecules, and correcting for partial volume effects. Spectra were selected for further analyses based on visual inspection (correct pattern, no artefacts) and objective parameters (FWHM<15 Hz, SNR≥10, metabolite fitting CRLB <20%)2. For further analysis we focused in 5 metabolites: glutamine (Gln), glutamate (Glu), N-acetylaspartate (NAA), taurine (Tau) and total NAA (NAAt), that is, the combined quantification of NAA and N-acetylaspartyglumate (NAAG). Figure 1(d) shows an example of MRS quantification by LCModel in a transgenic rat at 11.5 months of age.
Results
Regional network metrics showed statistical significant differences at 3 of the 4 evaluated ages as shown in Figure 2. Significant differences in metabolite concentrations between transgenic and control rats were also found (Figures 3 and 4). Metabolite concentration and regional connectivity metrics were not highly correlated (maximum Spearman correlation coefficient was 0.29) and therefore they can provide complementary information to identify AD. This can be observed in Figure 5, where perfect separation between transgenic and control rats can be observed at some time points between given metabolite concentration in striatum and nodal efficiency in the equivalent network region (caudate puntamen).Discussion
AD induced changes in the metabolite profile of hippocampus and striatum associated to a decrease of Tau, especially pronounced at the earlier stages, decreases of Glu, NAA and NAAt and an increase of Gln. Likewise, nodal efficiency and clustering coefficient were reduced in transgenic rats with respect to controls. However, metabolomic and connectivity changes were not correlated, which could be due to the fact that metabolite concentration is more related to functional activation than to the underlying anatomical network. For this reason, these parameters can complement each other in order to determine biomarkers of the disease, providing a more accurate classification of AD’s and control subjects as suggested by the examples in Figure 5. Altered patterns were identified even at the initial stages of the disease, pointing to these features as a potential biomarker for early diagnosis.Conclusion
Multimodal
MRI allows to characterize changes occurring in the AD brain at
different stages of the disease. The combination of different
parameters computed from MRI, such as metabolite concentration and
network metrics, can lead to new and more efficient non-invasive
biomarkers of AD.Acknowledgements
This work has been funded by the project PI14/00595, integrated in the Plan Nacional I+D+I and co-funded by ISCIII-Subdirección General de Evaluación and European Regional Development Fund (ERDF); and by the Fundació La Marató de TV3 (201441 10). CIBER-BBN is an initiative financed by the Instituto de Salud Carlos III with assistance from the European Regional Development Fund. We are indebted to the Experimental MRI 7T Unit of the IDIBAPS.References
1. Cohen RM, Rezai-Zadeh K, Weitz TM, et al. A transgenic Alzheimer rat with plaques, tau pathology, behavioral impairment, oligomeric Aβ and frank neuronal loss. J. Neurosci. 2013; 33:6245–6256.
2. García-Darás M, Simoes RV, Muñoz-Moreno E, Tudela R, Soria G. Regional and longitudinal brain metabolic changes in a new transgenic rat model of Alzheimer’s disease, Magn Reson Mater Phy. 2017; 30(Suppl 1, ESMRMB Congress):S493-S494
3. Muñoz-Moreno E, Tudela R, López-Gil X, Soria G. Early characterization of a rat model of Alzheimer’s Disease based on structural and functional connectomics and neurobehavior, Magn Reson Mater Phy. 2017; 30(Suppl 1, ESMRMB Congress):S464-S465
4. Batalle D, Muñoz-Moreno E., Arbat-Plana A, et al. Long-term reorganization of structural brain networks in a rabbit model of intrauterine growth restriction. Neuroimage, 2014; 100:24–38.
5. Schwarz AJ, Danckaert A, Reese T, et al. A stereotaxic MRI template set for the rat brain with tissue class distribution maps and co-registered anatomical atlas: application to pharmacological MRI. Neuroimage, 2006; 32:538–550.
6. Garyfallidis E, Brett M, Amirbekian B, et al. Dipy, a library for the analysis of diffusion MRI data. Front. Neuroinform. 2014; 8:8.
7. Rubinov M, Sporns O. Complex network measures of brain connectivity: uses and interpretations. Neuroimage 2010; 52:1059–1069.
Figures