3288
Normal aging differences in static and dynamic functional connectivity between men and women studied by quantitative data-driven analysis of R-fMRI data12Aging Research Center, Karolinska Institute, Stockholm, Sweden, 2Department of Medical Radiation and Nuclear Medicine, Karolinsak University Hospital, Stockholm, Sweden
Synopsis
A growing number of resting-state fMRI (R-fMRI) studies have reported a significant effect of normal aging in resting-state functional connectivity (RFC) of the default mode network (DMN). One of the more intriguing findings is that gender can interact with normal aging effect to influence the RFC changes over lifespan. This adds to our understanding of gender-related cognitive differences and gender-specific nature of aging-related brain disorders. However, the precise interaction effects between sex and age on RFC remain inconclusive. The aim of the study is to quantify the normal aging induced RFC reduction difference between man and women.
Introduction
A growing number of resting-state fMRI (R-fMRI) studies (1) have reported a significant effect of normal aging in resting-state functional connectivity (RFC) of the default mode network (DMN). One of the more intriguing findings is that gender may interact with normal aging effect. However, the precise interaction effects between sex and age on RFC remain inconclusive. The discrepancies in the reported findings among different R-fMRI studies may reflect not only variability in sample characteristics, but also diversity in processing and evaluation approaches (2). In this study we quantify the normal aging induced RFC differences between man and women by taking advantage of a recently developed quantitative data-driven analysis (QDA) framework which can provide voxel-wise RFC metrics as well as their dynamic variations.Methods
We studied a group of well-characterized healthy volunteers (30 young and 30 older adults, ♀50%) with R-fMRI conducted on a 3T clinical MRI scanner (Magnetom Trio, Siemens) equipped with a 32-channel phased-array receiving head coil. The R-fMRI protocol lasted for 10-min, including the following main acquisition parameters: TE/TR=35/2000ms, flip angle = 90°, 34 slices of 3.5 mm thick, in-plane resolution=3mm, GRAPPA parallel imaging with acceleration factor=2, and 300 dynamic timeframes. The R-fMRI data underwent a standard preprocessing pipeline that was performed with AFNI and FSL programs in a bash wrapper (3-5).
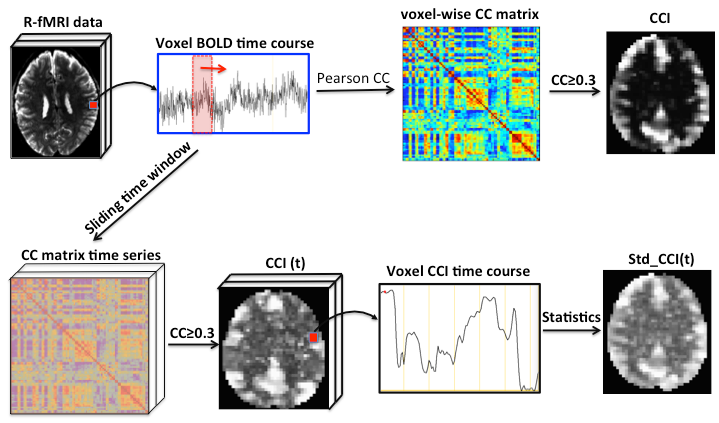
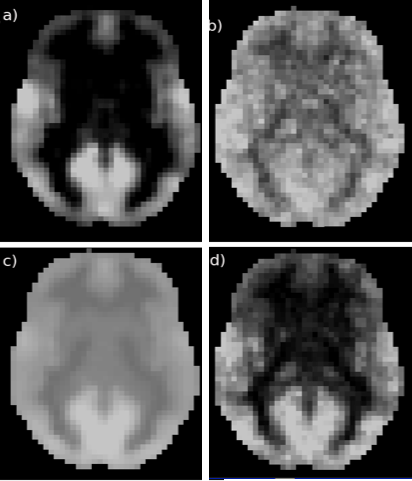
The QDA pipeline is schematically outlined in Fig. 1. For each R-fMRI dataset we extract two voxel-wise metrics: CSI and CCI, which are the non-zero mean value of the Pearson’s cross-correlation coefficients and the number of voxel pairs with the Pearson’s cross-correlation coefficient >0.3 for all voxel pairs in the brain involving the current voxel in question. To capture the time variations of the CCI and CSI we performed sliding window analysis for the time course to heighten QDA (SWATCH-QDA) and computed the temporal standard deviation (Std) of the sliding window time series for the CCI and CSI metrics. Fig. 2 shows a slice of the averaged CCI, CSI, Std_CCI(t) and Std_CSI(t) for the studied cohort. We performed voxel-wise 3-way ANOVA analysis with these RFC metrics. Gender and age are the covariates of interest, as well as their interaction. The participants were modeled as a random factor. The statistical significance was assessed at family-wise error rate p<0.05.
Results
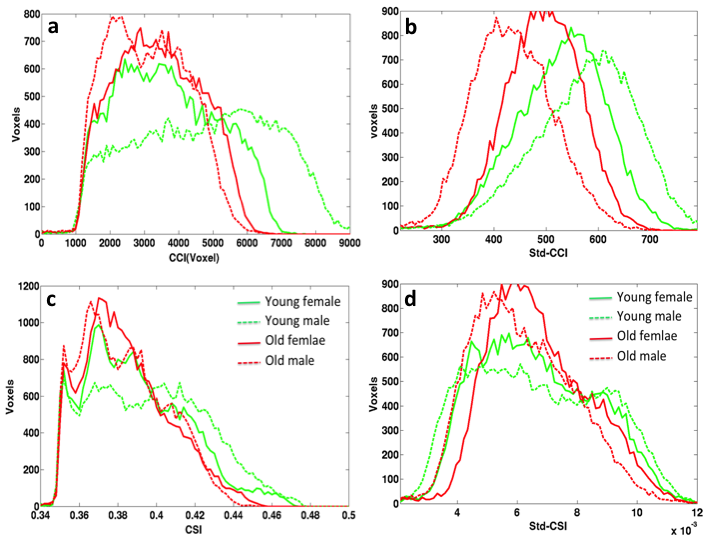
Fig. 3 shows the histograms of the average RFC metrics for the 4 different sub-groups, Young males have overall higher fraction of voxels with the highest CCI and Std_CCI(t), whereas the elder males have higher fraction of voxels with the lowest CCI and Std_CCI(t). Similar trends are also observed for the CSI and Std_CSI(t) histograms. Compared with males, the histograms for the females are less affected by normal aging.
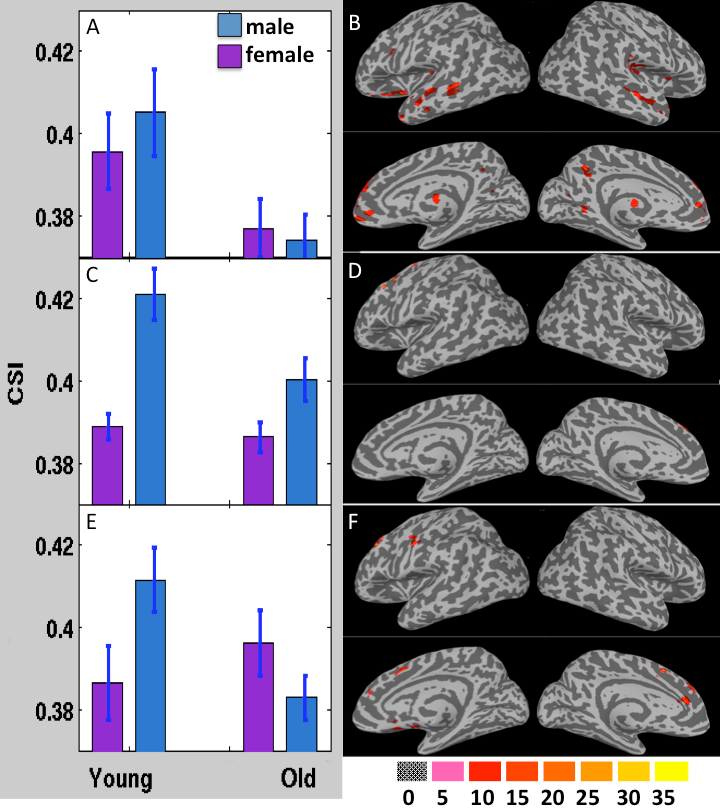
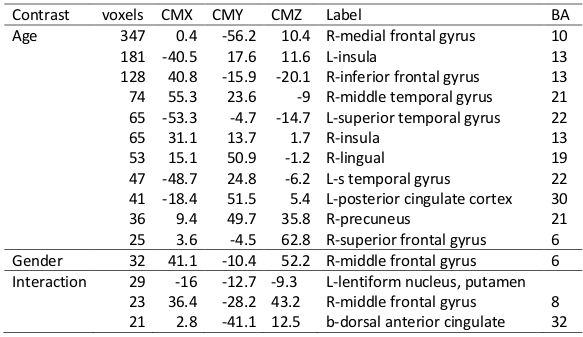
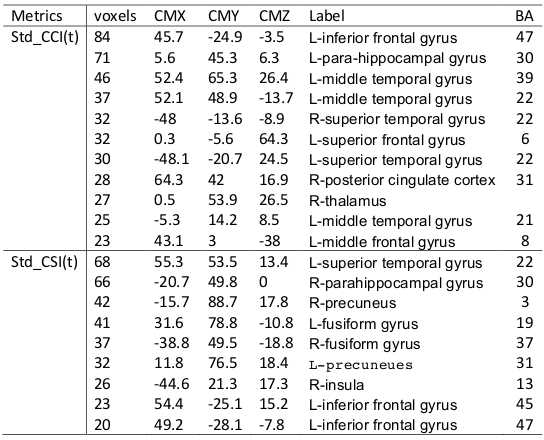
Fig. 4 depicts the results obtained from 3-way ANOVA of the CCI data. For the elder subjects the CCI was significantly decremented in multiple brain regions of DMN and limbic system, including superior and meddle frontal cortices (MFG), middle and superior temporal gyri, inferior parietal lobe, posterior cingulate, precuneus, inferior frontal gyrus, parahippocampal cortex, insula and thalamus (Table 1). The CSI, Std_CSI(t) and Std_CCI(t) results showed similar patterns, but the affected brain regions were less extensive (Table 2).
The 3-way ANOVA modeling revealed significantly lower RFC metrics (both CCI and CSI) in the r-MFG in women (Table 1 and Fig. 4). It detected also significant age by sex interaction effect in a number of brain regions (both CCI and CSI), suggesting that normal aging induces different RFC change trends between men and women.
Discussion
Using QDA method for quantification of RFC metrics, we found age-related declines in both the amount, strength, and their dynamic variations of the functional connection in the anterior-posterior parts of the DMN, which replicated previously reported results using other types of processing and evaluation methods. We extend on previous studies in the following aspects: 1) Showing RFC in the limbic system also decreased with advanced age; 2) Not only the RFC metrics but also their dynamic variations are influence by age; 3) In most of the brain regions of DMN and limbic system, men and women showed age-related RFC decline, but women showed greater maintenance in r-MFG, ACC and lentiform nucleus; 4) The main effect of sex on RFC was found in the r-MFG.Conclusion
The most novel finding of our study is that RFC between limbic network and DMN are altered in aging. Not only the static RFC metrics but also their dynamic variations decline with aging. The clinical relevance of RFC quantification has been shown in clinical populations covering both psychotic and neurodegenerative diseases. The QDA method and result reported herein may be of particular relevance for establishing a baseline between non-pathologic aging, and dementia.Acknowledgements
The study was support by an ALF grant from Stockholm Province. The authors would like to acknowledge the supports from Karolinska Institute, Karolinska University Hospital, and Stockholm University. Stimulating discussion with Prof. H. Fisher has been very helpful.References
1. Persson N, Wu J, Zhang Q, Liu T, Shen J, Bao R, Ni M, Liu T, Wang Y, Spincemaille P. Age and sex related differences in subcortical brain iron concentrations among healthy adults. Neuroimage 2015;122:385-398. 2. Tyszka JM, Kennedy DP, Paul LK, Adolphs R. Largely typical patterns of resting-state functional connectivity in high-functioning adults with autism. Cereb Cortex 2014;24(7):1894-1905. 3. Li TQ, Wang Y, Hallin R, Juto JE. Resting-state fMRI study of acute migraine treatment with kinetic oscillation stimulation in nasal cavity. Neuroimage Clin 2016;12:451-459. 4. Wang Y, Li TQ. Analysis of whole-brain resting-state FMRI data using hierarchical clustering approach. PLoS One 2013;8(10):e76315. 5. Wang Y, Li TQ. Dimensionality of ICA in resting-state fMRI investigated by feature optimized classification of independent components with SVM. Front Hum Neurosci 2015;9:259. 6. Nordin LE, Moller MC, Julin P, Bartfai A, Hashim F, Li TQ. Post mTBI fatigue is associated with abnormal brain functional connectivity. Sci Rep 2016;6:21183.Figures