3279
A Preliminary MR g-Ratio–Based Connectome Analysis in Multiple Sclerosis1Department of Radiology, Juntendo University Graduate School of Medicine, Tokyo, Japan, 2Melbourne Neuropsychiatry Centre, Department of Psychiatry, The University of Melbourne & Melbourne Health, Parkville, Australia, 3Department of Neurology, Juntendo University Graduate School of Medicine, Tokyo, Japan, 4Department of Radiology, The University of Tokyo Graduate School of Medicine, Tokyo, Japan, 5Department of Radiological Sciences, Graduate School of Human Health Sciences, Tokyo, Japan, 6Department of Diagnostic Radiology, Tokyo Metropolitan Geriatric Hospital, Tokyo, Japan
Synopsis
Multiple sclerosis (MS) is an inflammatory demyelinating disease of the central nervous system. We propose the use of g-ratio–based connectome for evaluating the network topology of MS since it is reported to be useful in the evaluation of demyelinating lesions in MS. Here, we evaluated the structural connectome of patients with MS, as mapped by MR g-ratio based connectome. The network-based statistic identified a subnetwork of reduced connectivity in patients with MS involving the limbic area. In conclusion, MR g-ratio–based connectome analysis can potentially detect changes in brain topology in MS with high sensitivity.
Introduction:
Multiple sclerosis (MS) is an inflammatory demyelinating disease.1 Numerous neuroimaging studies have reported disease effects such as brain atrophy,2 diffusion abnormalities,3 functional damage, and plasticity4 in MS patients. The brain is a complex integrative network, and neurological disease pathophysiology can be understood from the perspective of brain network topology.5 Accordingly, network topology analysis in MS is essential to understand underlying disease mechanisms and identify important biomarkers for diagnosis and progression assessment. Although diffusion MRI-based connectome analysis has provided new insights into disrupted structural connectivity between frontal temporal lobe, occipital lobe, and limbic area,6-8 the precise microstructural mechanisms underlying these deficits remain unknown. To better elucidate these mechanisms, we propose using g-ratio–based connectome to evaluate network topology in MS. The g-ratio is the ratio of the inner to outer diameters of myelinated axons, which can be estimated in vivo using MRI.9 MR g-ratio is an important indicator for evaluating myelination and demyelination and is sensitive to demyelinating lesions in MS.10 We hypothesized that connectomes derived from the g-ratio would provide greater sensitivity to detect connectivity deficits than those derived from conventional methods. We mapped whole-brain connectomes and evaluated interregional connectivity strength in MS patients and healthy controls using two measures: i) number of streamlines (NOS) and ii) tract-averaged g-ratio. We then tested for between-group differences in connectivity strength.Methods:
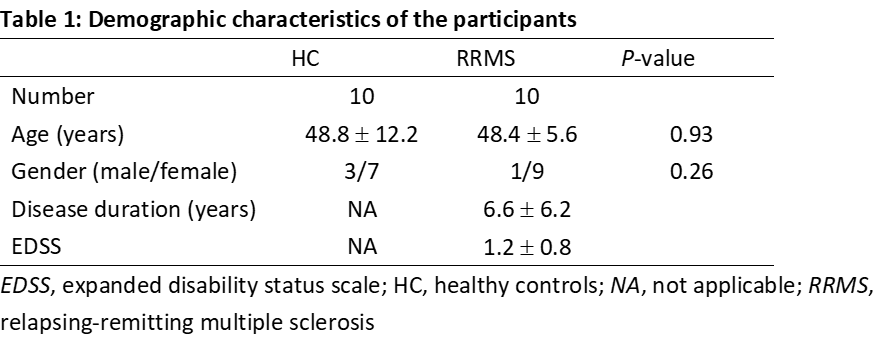
Ten MS patients and 10 healthy controls were recruited (Table 1). MR images using simultaneous multi-slice accelerated echo planar diffusion-weighted imaging consisting of two b values (1,000, and 2,000 s/mm2) acquired along 64 isotropic diffusion gradient directions for axon volume fraction (AVF) and MT saturation for myelin volume fraction (MVF) were acquired with a Siemens Prisma 3T scanner (MAGNETOM Prisma, Siemens Healthcare, Erlangen, Germany) with a 64-channel head coil. MT saturation data were analyzed using in-house MATLAB software for computing MVF map. For AVF, neurite orientation dispersion and density imaging (NODDI) model analysis was performed using diffusion MRI data for intra-axonal volume fraction (Viav) and cerebrospinal fluid volume fraction (Viso) calculation using the NODDI MATLAB toolbox. Next, AVF was estimated as, AVF=(1-MVF)×(1-Viso)×Vic.9 Aggregate MR fiber g-ratio is a function of MVF and AVF {g-ratio=sqrt[1/(1+MVF/AVF)]}.9 Brain nodes were defined using Automated Anatomical Labeling atlas that includes 90 cortical and subcortical regions (45 per hemisphere). To compute the number of fibers connecting each brain node pair, we utilized probabilistic tractography and constrained spherical deconvolution.11 The structural connectome was reconstructed for each subject by counting the NOS between every possible region pair and arranging values into an adjacency matrix. We computed average g-ratio for these streamlines and repeated network analysis by selecting two edge weight definitions, NOS and NOS divided by mean g-ratio along inter-regional streamlines for comparing differences between these brain structural networks. The network-based statistic (NBS)12 was used to identify subnetworks comprising connections with reduced streamline counts in MS patients. NBS was separately applied to those connectivity matrices derived from the NOS-based matrix compared with those derived from the g-ratio–based matrix.Results:
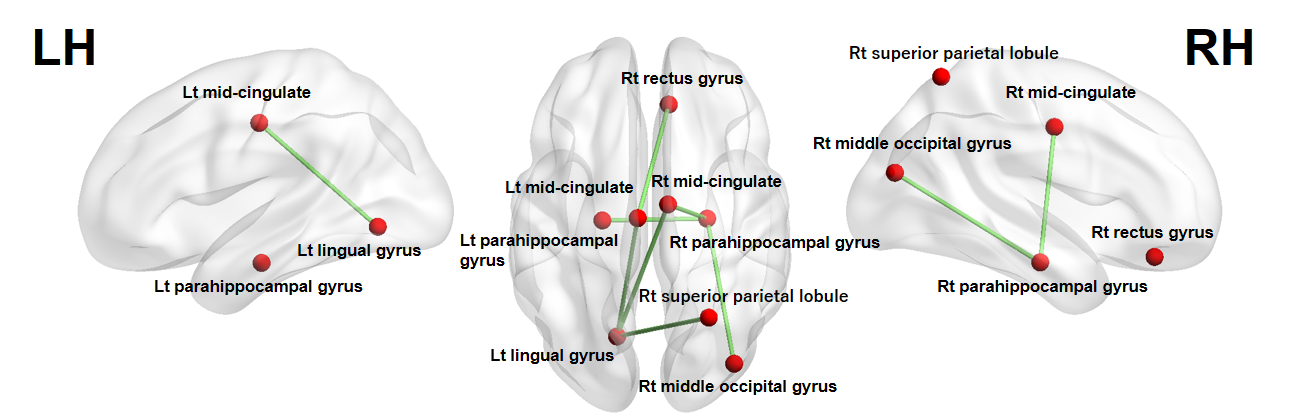
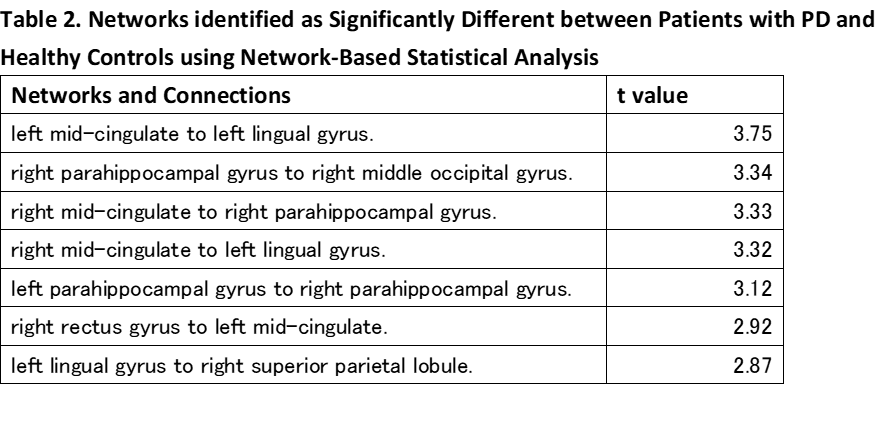
NBS did not identify any between-group differences when applied to the NOS-based connectome. In the g-ratio–based connectome, connectivity was reduced in the MS group relative to the control group (P<0.05) for networks involving frontal, occipital, and limbic areas (Figure 1). G-ratio–based connectome identified a comparable subnetwork of reduced connectivity comprising 7 edges connecting 8 regions (Table 2).Discussion and Conclusion:
We compared structural connectivity obtained using g-ratio–based and NOS-based connectomes. Although the latter did not detect any connectivity change in MS patients, g-ratio–based connectome detected reduced connectivity in the network involving frontal, occipital, and limbic areas in MS patients. These reduced connectivity areas correspond with previous studies.6-8 Therefore, we conclude that MR g-ratio–based connectome analysis can detect brain topology changes in MS with high sensitivity.Acknowledgements
This work was supported by the program for Brain Mapping by Integrated Neurotechnologies for Disease Studies (Brain/ MINDS) from Japan Agency for Medical Research and development (AMED); JSPS KAKENHI (JP16K19854).References
1. Noseworthy, J.H., et al., Multiple sclerosis. N Engl J Med, 2000. 343(13): p. 938-52.
2. Barkhof, F., et al., MRI monitoring of immunomodulation in relapse-onset multiple sclerosis trials. Nat Rev Neurol, 2011. 8(1): p. 13-21.
3. Ciccarelli, O., et al., Diffusion-based tractography in neurological disorders: concepts, applications, and future developments. Lancet Neurol, 2008. 7(8): p. 715-27.
4. Schoonheim, M.M. and M. Filippi, Functional plasticity in MS: friend or foe? Neurology, 2012. 79(14): p. 1418-9.
5. Bullmore, E. and O. Sporns, The economy of brain network organization. Nat Rev Neurosci, 2012. 13(5): p. 336-49.
6. Li, Y., et al., Diffusion tensor imaging based network analysis detects alterations of neuroconnectivity in patients with clinically early relapsing-remitting multiple sclerosis. Hum Brain Mapp, 2013. 34(12): p. 3376-91.
7. Nigro, S., et al., Structural 'connectomic' alterations in the limbic system of multiple sclerosis patients with major depression. Mult Scler, 2015. 21(8): p. 1003-12.
8. Shu, N., et al., Diffusion tensor tractography reveals disrupted topological efficiency in white matter structural networks in multiple sclerosis. Cereb Cortex, 2011. 21(11): p. 2565-77.
9. Stikov, N., et al., In vivo histology of the myelin g-ratio with magnetic resonance imaging. Neuroimage, 2015. 118: p. 397-405.
10. Hagiwara, A., et al., Analysis of White Matter Damage in Patients with Multiple Sclerosis via a Novel In Vivo MR Method for Measuring Myelin, Axons, and G-Ratio. AJNR Am J Neuroradiol, 2017.
11. Jeurissen, B., et al., Probabilistic fiber tracking using the residual bootstrap with constrained spherical deconvolution. Hum Brain Mapp, 2011. 32(3): p. 461-79.
12. Zalesky, A., A. Fornito, and E.T. Bullmore, Network-based statistic: identifying differences in brain networks. Neuroimage, 2010. 53(4): p. 1197-207.
Figures