3277
A meta-analysis of studies using graph theory in traumatic brain injury suggests inconclusive evidence for structural disconnectivity1School of Psychology, Australian Catholic University, Melbourne, Australia, 2School of Psychology, Cardiff University Brain Research Imaging Centre, Cardiff, United Kingdom
Synopsis
The purpose of this meta-analysis is to investigate which graph metrics reliably represent changes to structural connectivity following Traumatic Brain Injury (TBI). Effect sizes were pooled for sixteen different graph metrics, from ten diffusion MRI articles that compared the structural connectome of TBI patients and healthy controls. Interestingly, no metric showed consistent differences across the studies. This analysis indicates that heterogeneity in samples are hindering progress towards clinically relevant disconnectivity biomarkers following brain trauma.
Introduction:
Traumatic Brain Injury (TBI) is the third largest cause of death and disability in young people1. TBI is often characterized by damage to white matter pathways that are integral to the structural network of the brain2. Studies using graph theoretical analysis claim there is altered structural connectivity in TBI compared to the healthy connectome3-5. Specifically, recent evidence has accumulated revealing alterations in functional segregation and global integration in patients with TBI3,5-7. Graph metrics may serve as viable biomarkers to monitor the efficacy of TBI rehabilitation. However, to date there has been no systematic review of the literature to support this claim. Pooled analysis is needed to uncover robust patterns of change in graph metrics, the first of its kind in TBI research.Methods:
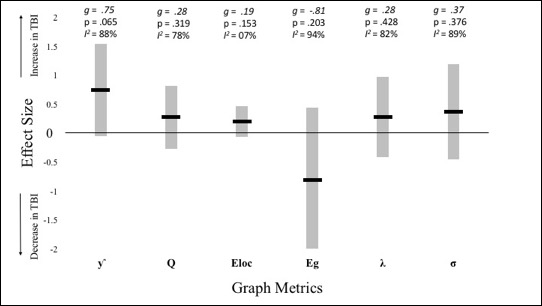
A systematic literature search was conducted on Medline, CINAHL, psycINFO, Web of Science, and SCOPUS using the following search terms: [(“traumatic brain injur*” OR TBI) AND (connectom* OR “structural connect*” OR “graph theor*” OR “graph metric*” OR “graph analys*” OR “network analys*”)]. Any study that did not used diffusion MRI, or did not compare TBI and healthy control (HC) structural networks using graph theoretical analysis, was excluded. Effect sizes were calculated using the Comprehensive Meta-Analysis software (Biostat, USA, v2.2.064), and entered into a random-effects model. Graph metrics estimating global integration (e.g., global efficiency), segregation (e.g., normalised clustering coefficient), and general measures of structural connectivity (e.g., small-worldness) were extracted across studies (see Table 1). Hedge’s g was calculated for each graph metric investigating group differences between TBI and HC. Pooled effect sizes were calculated by combining the mean effect sizes weighted by each study’s sample size, and the 95% confidence intervals (CI). Effect sizes were regarded as small if ≥0.2, medium if ≥0.5 and large if ≥0.88, with p-value of <.05 is significantly different from 0. Effect sizes that demonstrated increases in TBI compared to HC were assigned a positive value, negative effect sizes indicate a decrease in TBI compared to HC. I2 was used to assess what percentage of the variation present was due to heterogeneity rather than random error (whereby 25% was regarded as low, 50% as moderate, and 70% as high)9. All analyses used two-tailed significance level of p<.05. Publication bias was assessed using Egger’s test for asymmetry in a funnel plot10.Results:
Of the 468 articles identified in our systematic search, only 28 articles were deemed eligible after screening of abstract and title. A further 16 were removed after screening full texts, leaving 10 for the final quantitative synthesis. Sixteen different graph metrics were used across all TBI studies, however only six metrics were used in more than three of the 10 studies. As can be seen from Table 1, none of these metrics showed consistent increases or decreases across studies. Both increases and decreases in small-worldness were found across different studies. In all other metrics, differences obtained in one study were undermined by insignificant findings in other studies. The most commonly used metric, local efficiency, showed non-significant differences between TBI and HC across the majority of the studies. The average effect sizes for all metrics ranged from small (0.02) to large (0.97; see Figure 1). The only effect size that reached significance was for eigenvector centrality (g=-0.64, p=.017), however this metric was only used in a single study and as such no firm conclusions can be made. Interestingly, normalised clustering coefficient (used in six studies) approached significance (g=0.75, p=.065). I2 was large for all metrics with degrees of freedom above two, denoting that effect sizes varied due to true heterogeneity between the studies, more so than random error16. This is with the exception of local efficiency (I2 = 7%). Excluding this metric, it is therefore unlikely that the outcomes of the studies share a common effect. Finally, there was no significant effect of publication bias (intercept=0.8, CI:[-3.45, 5.05], p=0.71), indicating that the published studies are a good representation of available evidence.Discussion and conclusions:
This meta-analysis reveals the absence of consistent group differences between TBI and HC networks, even for the few metrics that were commonly used across studies. Heterogeneity in the studied populations hinders definitive statements regarding disconnectivity in TBI. Lack of specificity in injury type (focal vs diffuse) may be impacting the consistency of findings between studies. Damage to a network hub will cause greater interruption to network connectivity, than would the same injury to an area of low degree17. Subgroups according to injury type and lesion location should therefore be pre-determined in future graph theory studies18. To conclude, this meta-analysis shows inconclusive evidence of a disconnection syndrome in TBI, and graph metrics cannot yet be implemented as clinically relevant biomarkers to guide rehabilitation efforts.Acknowledgements
This work was facilitated by an ACURF Program grant awarded to Karen Caeyenberghs by the Australian Catholic University (ACU). Derek K Jones is supported by a Wellcome Trust Investigator Award (096646/Z/11/Z) and a Wellcome Trust Strategic Award (104943/Z/14/Z). The authors have no conflict of interest to declare.References
1. Taylor CA, Bell JM, Breiding MJ, et al. Traumatic brain injury-related emergency department visits, hospitalizations, and deaths – United States, 2007 and 2013. MMWR Surveill Summ. 2017;66(9):1-16.
2. Hannawi Y, Stevens RD. Mapping the connectome following traumatic brain injury. Curr Neurol Neurosci. 2016;16(5):44.
3. Caeyenberghs K, Leemans A, De Decker C, et al. Brain connectivity and postural control in young traumatic brain injury patients: A diffusion MRI based network analysis. NeuroImage-Clin. 2012;1(1):106-115.
4. Caeyenberghs K, Leemans A, Leunissen I, et al. Topological correlations of structural and functional networks in patients with traumatic brain injury. Front Hum Neurosci. 2013;7:726.
5. Caeyenberghs K, Leemans A, Leunissen I, et al. Altered structural networks and executive deficits in traumatic brain injury patients. Brain Struct Funct. 2014;219(1):193-209.
6. Yuan W, Wade SL, Quatman-Yates C, et al. Structural connectivity related to persistent symptoms after mild TBI in adolescents and response to aerobic training: Preliminary investigation. J Head Trauma Rehab. 2017. [Epub ahead of print].
7. Yuan W, Wade SL, Babcock L. Structural connectivity abnormality in children with acute mild traumatic brain injury using graph theoretical analysis. Hum Brain Mapp. 2015;36(2):779-792.
8. Cohen J. Statistical power analysis for the behavioral sciences. Hilsdale. NJ: Lawrence Earlbaum Associates. 1988;2.
9. Higgins JP, Thompson SG, Deeks JJ, et al. Measuring inconsistency in meta-analyses. BMJ Brit Med J. 2003;327(7414):557-560.
10. Egger M, Davey Smith G, Schneider M, et al. Bias in meta-analysis detected by a simple, graphical test. BMJ Brit Med J. 1997;315(7109):629-634.
11. Van der Horn HJ, Kok JG, De Koning ME, et al. Altered wiring of the human structural connectome in adults with mild traumatic brain injury. J Neurotraum. 2017;34(5):1035-1044.
12. Yuan W, Treble-Barna A, Sohlberg MM, et al. Changes in structural connectivity following a cognitive intervention in children with traumatic brain injury. Neurorehab Neural Re. 2017;31(2):190-201.
13. Hellyer PJ, Scott G, Shanahan M, et al. Cognitive flexibility through metastable neural dynamics is disrupted by damage to the structural connectome. J Neurosci. 2015;35(24):9050-9063.
14. Konigs M, van Heurn LWE, Bakx R, et al. The structural connectome of children with traumatic brain injury. Hum Brain Mapp. 2017;38(7):3603-3614.
15. Kim J, Parker D, Whyte J, et al. Disrupted structural connectome is associated with both psychometric and real-world neuropsychological impairment in diffuse traumatic brain injury. J Int Neuropsych Soc. 2014;20(9):887-896.
16. Hedges LV, Ingram O. Statistical methods for meta-analysis. Orlando, FL: Academic Press. 1985;1.
17. van den Heuvel MP, Sporns O. Network hubs in the human brain. Trends Cogn Sci. 2013;17(12):683-96.
18. Caeyenberghs K, Verhelst H, Clemente A, et al. Mapping the functional connectome in traumatic brain injury: What can graph metrics tell us? NeuroImage. 2016. [Epub ahead of print].
Figures
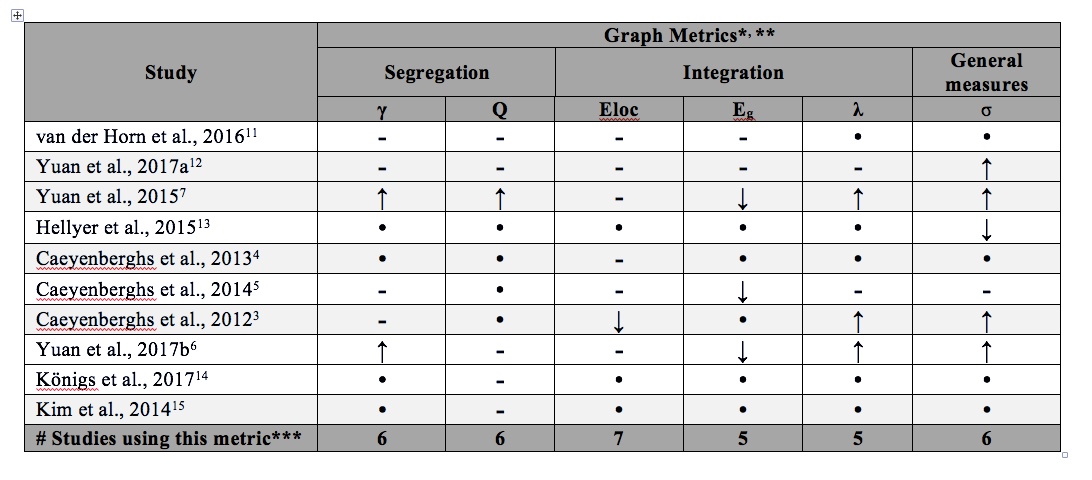
Table 1. Summary of Results from Graph Metric Comparisons between Traumatic Brain Injury Patients and Healthy Controls
* γ = normalized clustering coefficient; Q = modularity; Eloc = local efficiency; Eg = global efficiency; λ = normalized path length; σ = small-worldness **↓ or ↑ is significant decrease/increase in TBI group, compared to HCs; – indicates no significant difference, while • indicates this metric was not calculated. *** only metrics included in more than 3 studies are shown