3276
Resting state functional networks longitudinally correlate with working memory in a transgenic rat model of Alzheimer’s disease1Group of Biomedical Imaging of the University of Barcelona, CIBER de Bioingeniería, Biomateriales y Nanomedicina (CIBER-BBN), Barcelona, Spain, 2Experimental MRI 7T Unit, IDIBAPS, Barcelona, Spain
Synopsis
The TgF344-AD rats represent the most suitable and promising animal model for Alzheimer’s disease (AD) research. Resting-state functional MRI was longitudinally acquired every 3 months in a cohort of transgenic Tg344-AD and control Fisher rats between 5 and 15 months of age, together with cognitive task evaluation. Independent component analysis was applied to rs-fMRI volumes and 10 networks were anatomically identified. Spearman correlation coefficients between functional and cognitive parameters were computed. Our results show that while no differences were observed in the cognitive task between both groups, significant differences were found in the functional networks.
INTRODUCTION
The TgF344-AD rats represent the most suitable and promising animal model for Alzheimer's disease (AD) research1. They show in an age dependent manner all the pathological hallmarks of AD. Our goal was to identify if functional networks analyzed by Independent Component Analysis (ICA) were altered in TgF344-AD rats at different ages in correspondence with their cognitive function.METHODS
rs-fMRI was longitudinally acquired in a cohort of transgenic Tg344-AD (n=9) and control Fisher rats (n=10) between 5 and 15 months of age in a 7T scanner at four different time-points by using a single-shot gradient-echo EPI sequence (TR/TE = 2000/10,75 ms). 600 volumes of 64x64x34 voxels and 0.4x0.4x0.6 mm³/voxel were acquired.
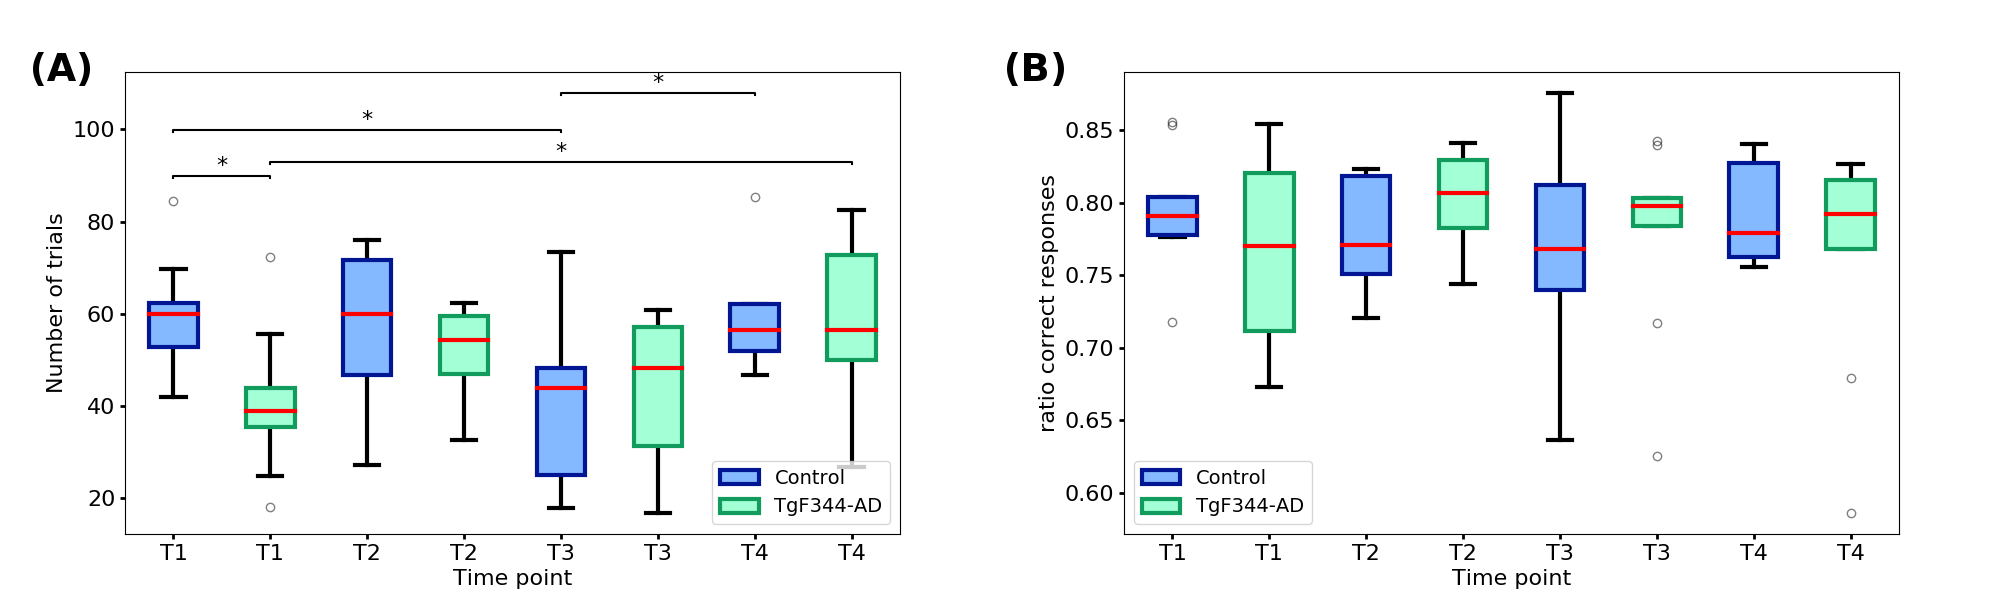
Before each scan the working memory performance of both groups was evaluated by means of a delayed non-matching-to-sample (DNMS) task, following a procedure modified from Callaghan et al., 20122.
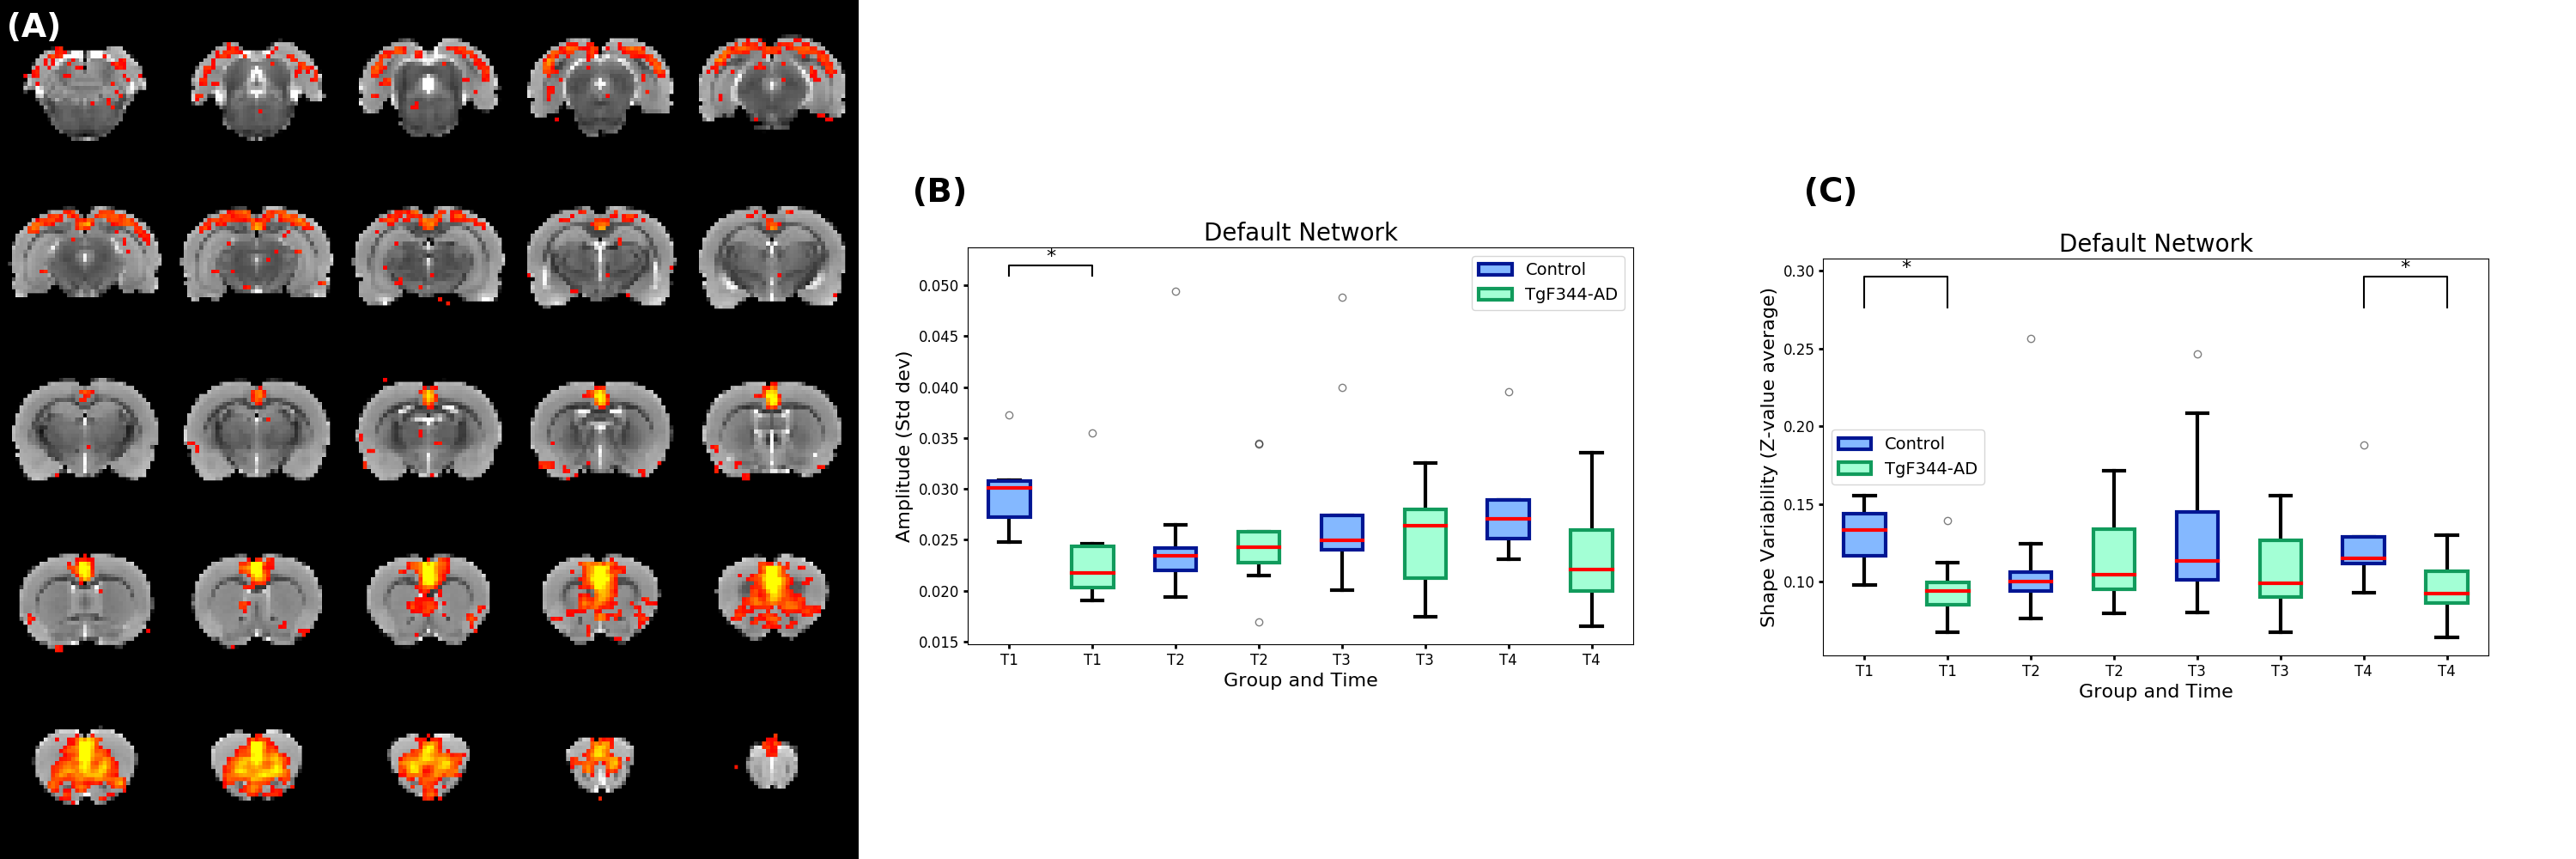
Image preprocessing included: slice-timing, motion correction, skull-stripping, spatial normalization, spatial smoothing, detrending and regression by motion parameters, and temporal filtering (0.01 - 0.1 Hz). 30 independent components were obtained using FSL MELODIC3 considering the whole cohort. 10 components were selected based on the anatomical structures comprising the network and their correspondence to the literature4-8.
Dual regression was performed using these 10 components to find the subject-specific time-series and spatial maps for each network. The standard deviation of the time-series (Amplitude) of each component and the mean of the Z-values in the spatial maps where each network was localized (Shape Variability)9 were computed for each subject and the differences evaluated using Kruskal-Wallis test.
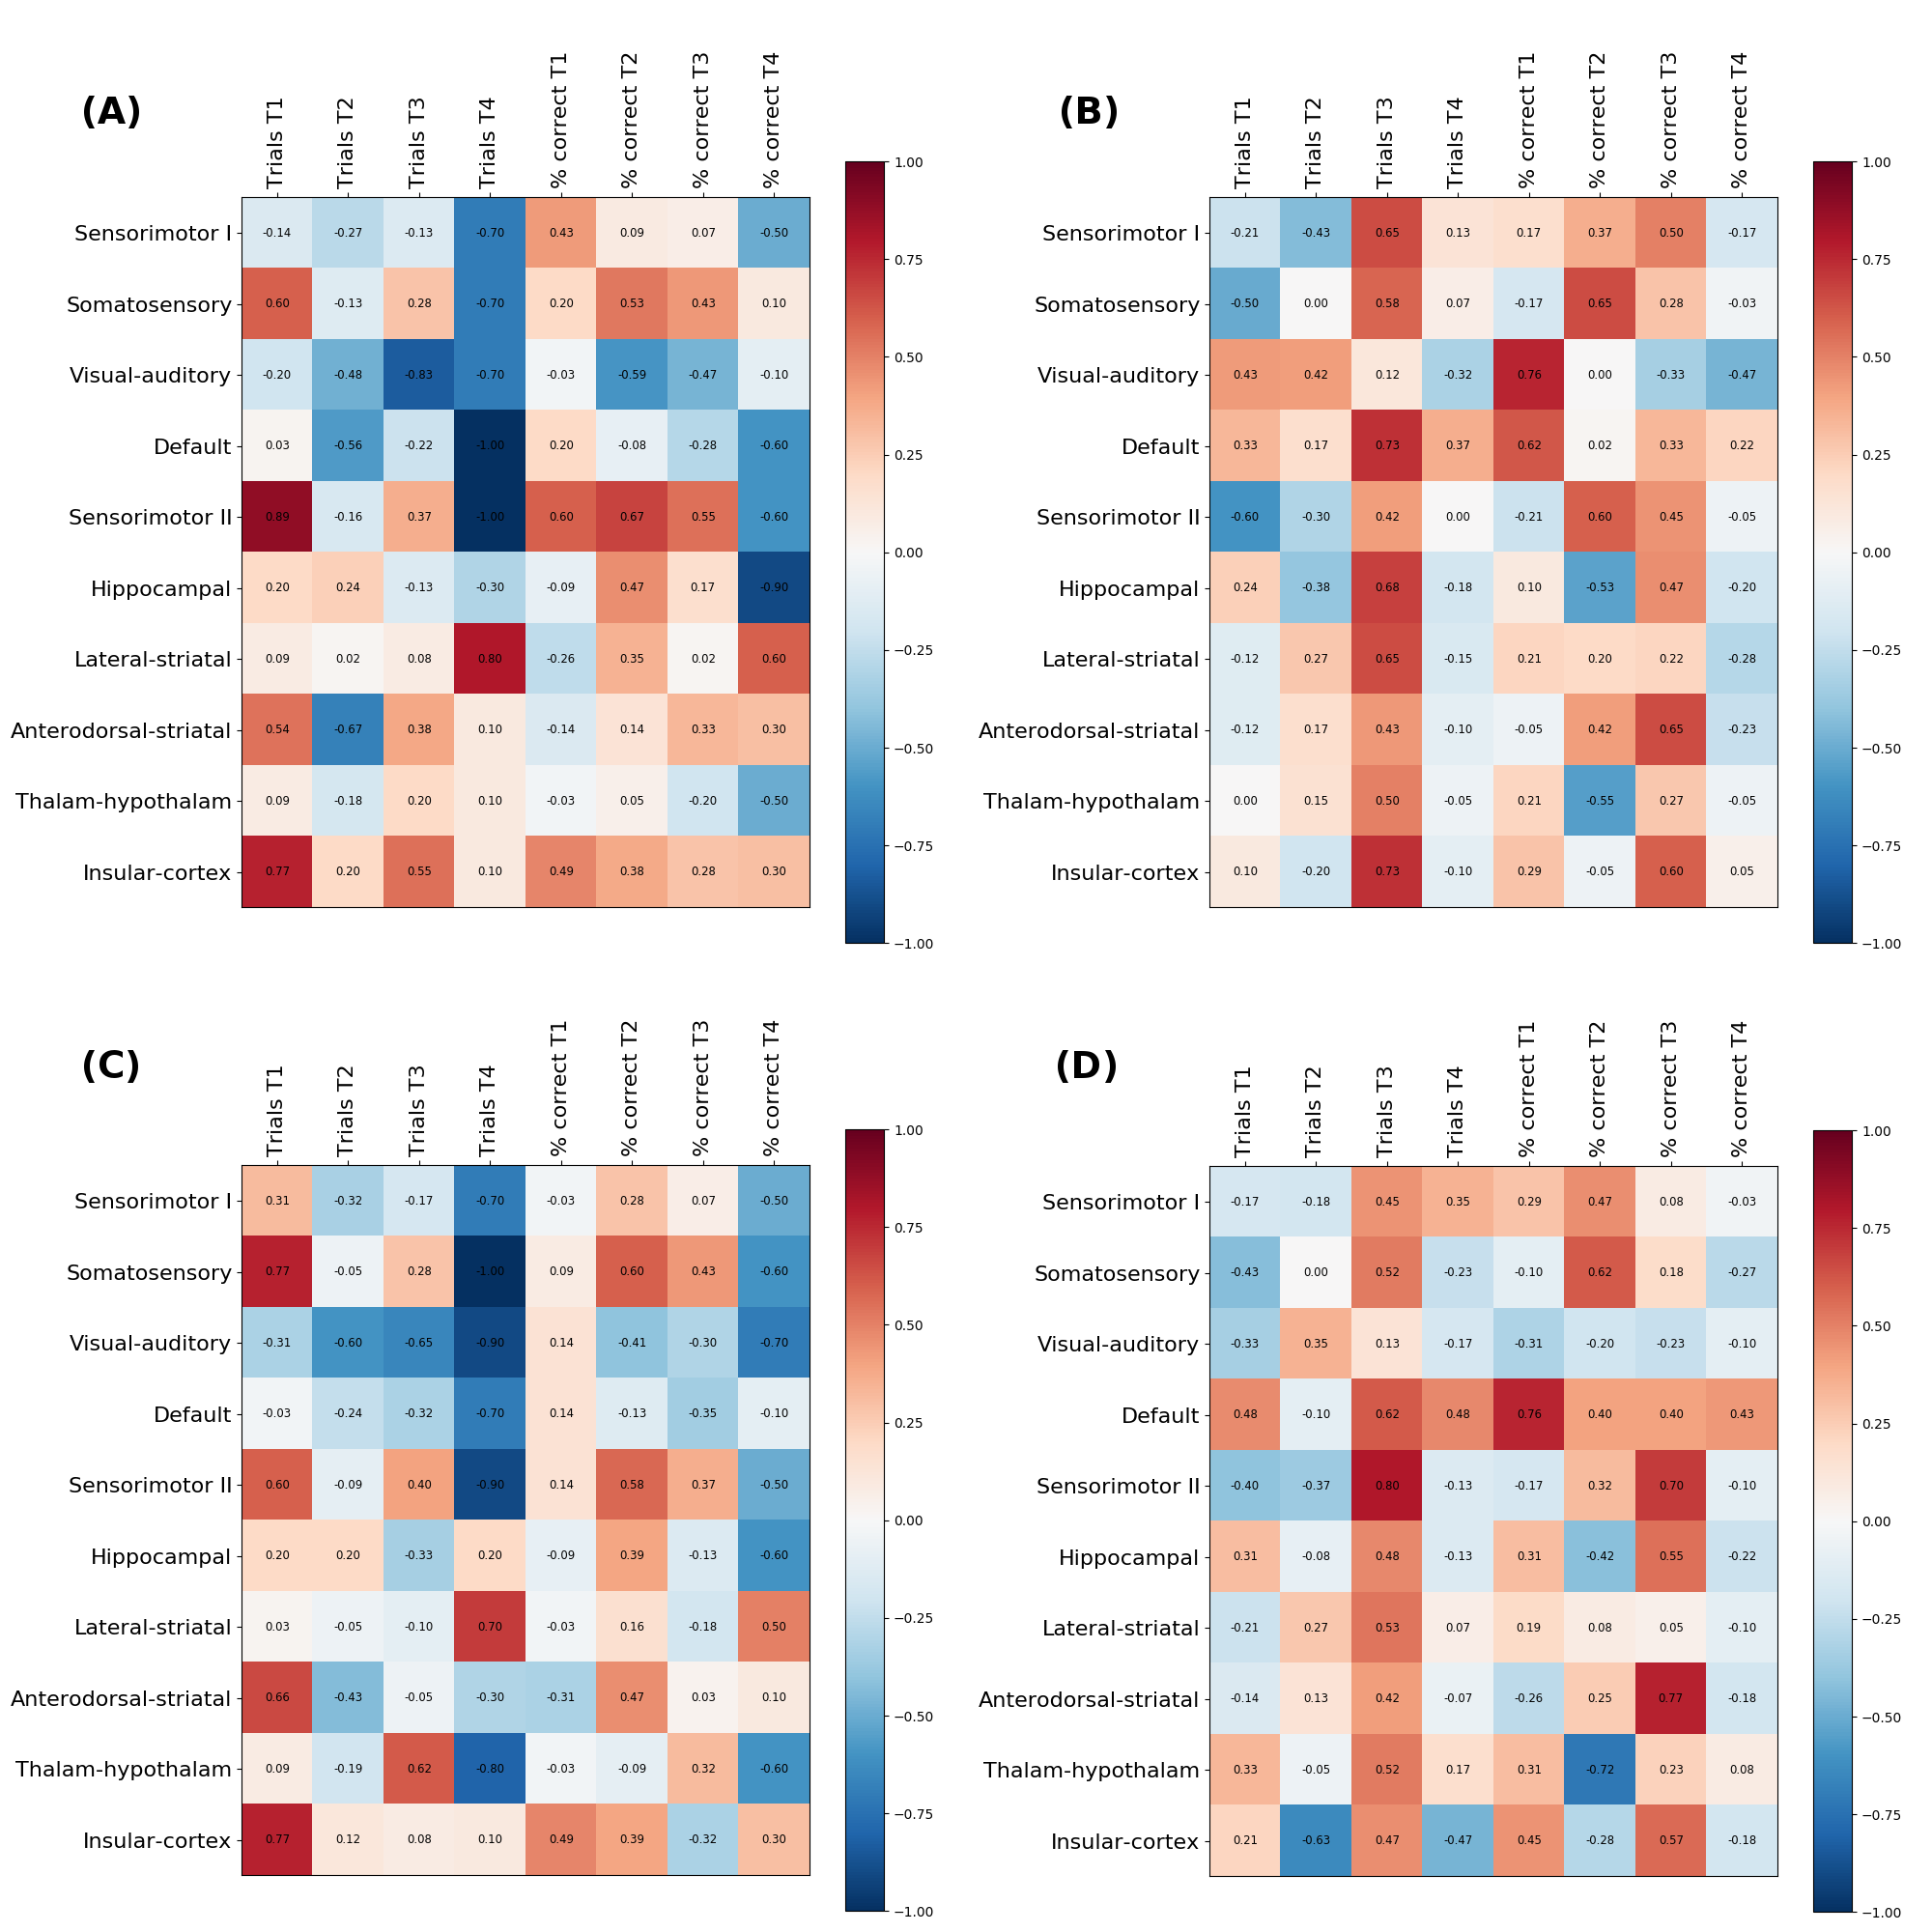
The results of the DNMS test were evaluated considering the total number of trials and the ratio of correct responses per group and time-point. Spearman correlation coefficient was computed between these cognitive function parameters and the Amplitude and Shape Variability for the 10 components of the two groups and the four time-points.
RESULTS
Between t1 and t4 significant differences (uncorrected p<0.05) appeared in the Amplitude for sensorimotor I and II, and somatosensory networks for the control group. There were also significant differences between both groups at t1 in the visual-auditory, default and thalamus-hypothalamus networks and in the somatosensory and sensorymotor II networks at t4. Time-points 2 and 3 were more stable and not significant differences were found in any of the comparisons.
Considering Shape variability there were significant differences between t1 and t4 time-points in the sensorimotor II network for the control group and in the visual-auditory and thalamus-hypothalamus networks for the TgF344-AD group. There were significant differences between both groups at t1 in the default and thalamus-hypothalamus networks and at t4 in the somatosensory and default networks. Again, time-point t2 and t3 showed fewer differences between groups or time-points.
To evaluate the working memory, as assessed by the DNMS task, the number of trials and the ratio of correct responses were considered (Figure 2). At t1 the transgenic group performed significantly less number of trials compared to the controls. Then the number of trials slightly increased over time while in the control group was more stable. The stability between time-points is clearer in the ratio of correct responses where there are not significant differences between groups or time-points.
Figure 3 shows the matrix of Spearman correlation coefficients between the Amplitude and Shape variability of the different networks and the results of the cognitive function. Both Amplitude and Shape variability correlates similarly with the cognitive results. However, at t4 there were more significant Spearman coefficients in the control group, such as in the somatosensory and sensorimotor II, than in the TgF344-AD group.
DISCUSSION
We observed differences between the TgF344-AD and control groups at early and late ages in the Amplitude and Shape Variability of the analyzed networks. Cognitive behavior results showed only significant differences in the number of trials at t1, but regarding the correlations between the behavior and the networks activation differences could be demonstrated between both groups. These results suggest that even if cognitive functions were preserved functional networks could be altered in the TgF344-AD group, where more and less specialized networks were involved in the function contrary to what happens in the control group where the correlation with the cognitive response was more significant in few networks showing more specialization.CONCLUSION
Differences in functional brain networks were shown between control and TgF344-AD rats at different time-points. These differences in the components across time-points demonstrated a different evolution of the networks between both groups while the cognitive function seems conserved. These results suggest the possibility of using biomarkers based on ICA of functional activation for early AD detection.Acknowledgements
This work has been funded by the project PI14/00595, integrated in the Plan Nacional I+D+I and co-funded by ISCIII-Subdirección General de Evaluación and European Regional Development Fund (ERDF); and by the Fundació La Marató de TV3 (201441 10). CIBER-BBN is an initiative financed by the Instituto de Salud Carlos III with assistance from the European Regional Development Fund. We are indebted to the Experimental MRI 7T Unit of the IDIBAPS.References
1. Cohen, R. M., Rezai-Zadeh, K., Weitz, T. M., Rentsendorj, A., Gate, D., Spivak, I., et al. A transgenic Alzheimer rat with plaques, tau pathology, behavioral impairment, oligomeric Aβ and frank neuronal loss. J. Neurosci. 2013; 33:6245–6256.
2. Callaghan, C. K., Hok, V., Della-Chiesa, A., Virley, D. J., Upton, N., and O’Mara, S. M. Age-related declines in delayed non-match-to-sample performance (DNMS) are reversed by the novel 5HT6 receptor antagonist SB742457. Neuropharmacology 2012; 63:890–7.
3. Beckmann, C.F., Smith, S.M. Tensorial extensions of independent component analysis for multisubject FMRI analysis. NeuroImage 2005; 25:294-311
4. Henckens, M.J.A.G., van der Marel, K., vsn der Toorn, A., Pillai, A.G:, Fernández, G., Dijkhuizen, R.M., Joëls, M. Stress-induced alterations in large-scale functional networks of the rodent brain. NeuroImage 2015; 105:312-322.
5. Sierakowiak, A., Monnot, C., Aski, S.N., Uppman, M., Li, T.-Q., Damberg, P., Brené, S. Default Mode Network, Motor Network, Dorsal and Ventral Basal Ganglia Networks in the Rat Brain: Comparison to Human Networks Using Resting State-fMRI. PLoS ONE 2015; 10(3):e0120345-1:20.
6. Hsu, L.-M., Liang, X., Gu, H., Brynildsen, J.K., Stark, J.A., Ash, J.A., Lin, C.-P., Lu, H., Rapp, P.R., Stein, E.A., Yang, Y. Constituents and functional implications of the rat default mode network. PNAS 2016; 113(31):E4541-E4547.
7. Bajic, D., Craig, M.M., Borsook, D., Becerra L. Probing Intrinsic Resting-State Networks in the Infant Rat Brain. Front. Behav. Neurosci. 2016; 10:192.
8. Ma, Z., Perez, P., Ma, Z., Liu, Y., Hamilton, C., Liang, Z., Zhang, N. Functional atlas of the awake rat brain: A neuroimaging study of rat brain specialization and integration. NeuroImage 2016; https://doi.org/10.1016/j.neuroimage.2016.07.007.
9. Nickerson, L.D., Smith, S.M., Öngür, D., Beckmann, C.F. Using Dual Regression to Investigate Network Shape and Amplitude in Functional Connectivity Analyses. Front. Neurosci. 2017; 11:115.
Figures