3269
Effects of intraocular pressure elevation and oral citicoline treatment on resting state functional connectivity in the visual system1Department of Bioengineering, University of Pittsburgh, Pittsburgh, PA, United States, 2Department of Radiology, Mayo Clinic, Rochester, MN, United States, 3Department of Electrical Engineering, University of Hong Kong, Hong Kong, Hong Kong, 4Department of Ophthalmology, University of Pittsburgh, Pittsburgh, PA, United States, 5Department of Chemical and Biological Engineering, Hong Kong University of Science and Technology, Hong Kong, Hong Kong, 6Department of Ophthalmology and Visual Sciences, The Chinese University of Hong Kong, Hong Kong, Hong Kong, 7Department of Radiology, New York University, New York, NY, United States
Synopsis
Glaucoma is a neurodegenerative disease that causes irreversible damage to the visual system. While elevated intraocular pressure (IOP) is a major risk factor, its neurobehavioral effects on the visual system remain unclear. Here we showed that increasing magnitude and duration of IOP elevation resulted in differential effects on the visuomotor behavior and resting-state functional connectivity between visual brain nuclei. In addition, under similar levels of chronic IOP elevation, oral citicoline treatment appeared to ameliorate visual behavioral deficits and functional connectivity decrease in some brain regions. These results suggest new potential mechanistic targets for treatment of glaucoma beyond IOP lowering.
Introduction
Glaucoma is the second leading cause of blindness worldwide that involves irreversible damage to the visual system and vision loss over time. While elevated intraocular pressure (IOP) is a major risk factor for the disease, its neurobehavioral effects on the visual system remain unclear. Currently, the only clinically proven way to intervene in glaucoma progression is by lowering IOP, however glaucomatous neurodegeneration of the visual system may still occur after IOP is reduced1. Therefore, there exists the need for treatment mechanisms that can further decrease the severity of the damage. Citicoline is an endogenous compound that plays an important role in cell membrane synthesis and repair2. Recent studies suggest that citicoline may improve visual outcomes in glaucoma patients3,4, yet its underlying neural mechanisms remain poorly understood. In this study, we examined the neurobehavioral effects of increasing magnitude and duration of IOP elevation on the rat visual system with and without citicoline treatment using resting state functional connectivity MRI (RSfcMRI) and optokinetic assessments.Methods
Animal preparation: Eighty-two adult Long Evans rats were divided into six groups. Acute or chronic IOP elevation and sham operation was performed to the right eyes while left eyes remained uninjured. Acute IOP elevation was induced with physiological saline anterior chamber perfusion at 15mmHg (acute:sham, n=10), 40mmHg (acute:mild, n=12) or 130mmHg (acute:severe, n=12) for 60 minutes5. Chronic IOP elevation was induced with a 20µL intracameral injection of a transparent crosslinking hydrogel6. A subset of animals (chronic:treated, n=19) received daily oral citicoline gavage (500mg/kg) for 7 days prior to hydrogel injection and every 48 hours for 14 days after hydrogel injection, while the remaining animals did not receive any citicoline treatment (chronic:untreated, n=19). Another 10 rats (chronic:sham, n=10) received a 20µL intracameral injection of buffer solution as sham control to hydrogel injection without citicoline treatment. In vivo measurements were performed 35 days after experimental model induction. IOP and visual acuity measurements: IOP was measured in the chronic group with a tonometer (Tonolab, iCare). OptoMotry virtual reality system (CerebralMechanics, Inc.) was used to assess the visuomotor behavior by quantifying the visual acuity (VA) of each eye7, 8. MRI protocol: RSfcMRI scans were acquired using a 9.4T Varian/Agilent scanner with a single-shot gradient-echo echo-planar imaging sequence with 420 repetitions at TR/TE=1000/18ms, FOV=32mmx32mm, acquisition matrix=64x64, slice thickness=1mm, in 6 slices. Images were realigned and smoothed, followed by temporal bandpass filtering with cut-off frequencies of 0.01 and 0.1 Hz. ROIs were manually drawn on the lateral geniculate nuclei (LGN), superior colliculi (SC), and visual cortices (VC). The functional connectivity (FC) was calculated by computing the mean time course in each region, computing the Pearson’s correlation between each pair of time courses, and converting these correlation coefficients to z-scores. The data were represented by a graph where the ROIs define the nodes and the correlation strength between two ROIs defines the edges. For each edge in the graph, effects for group-wise differences were investigated using a linear mixed-effects model with random slopes and intercepts included for each animal. Results were considered significant at p<0.05.Results
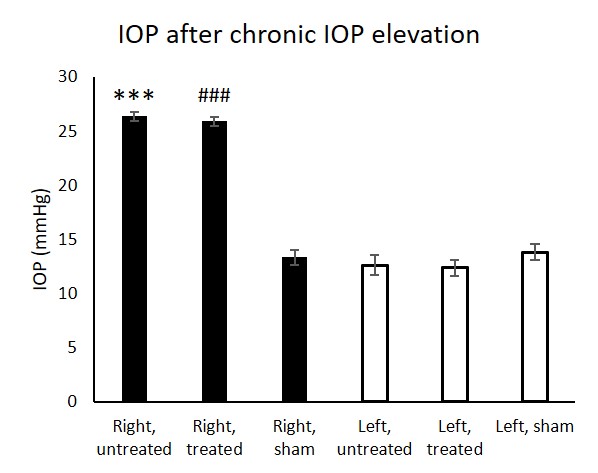
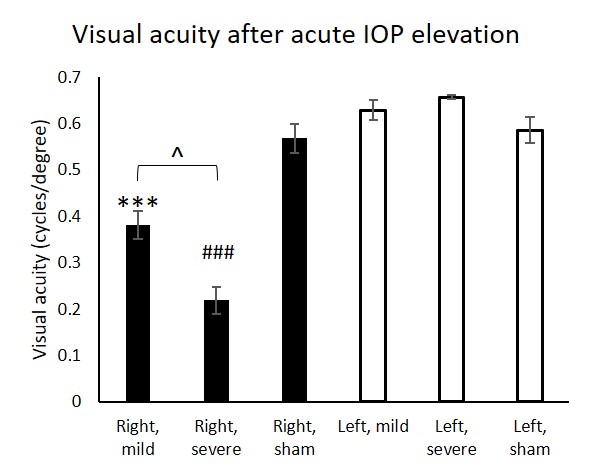
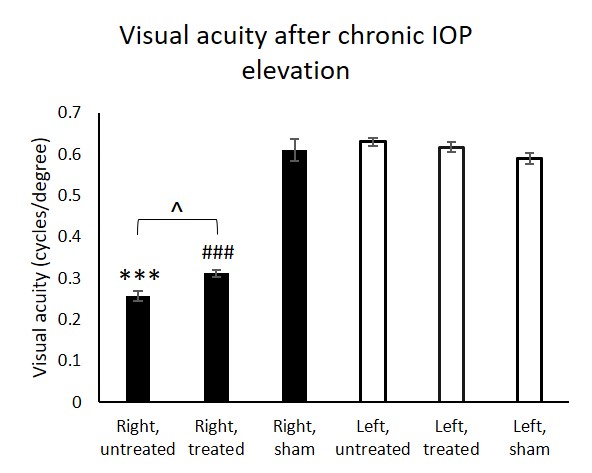
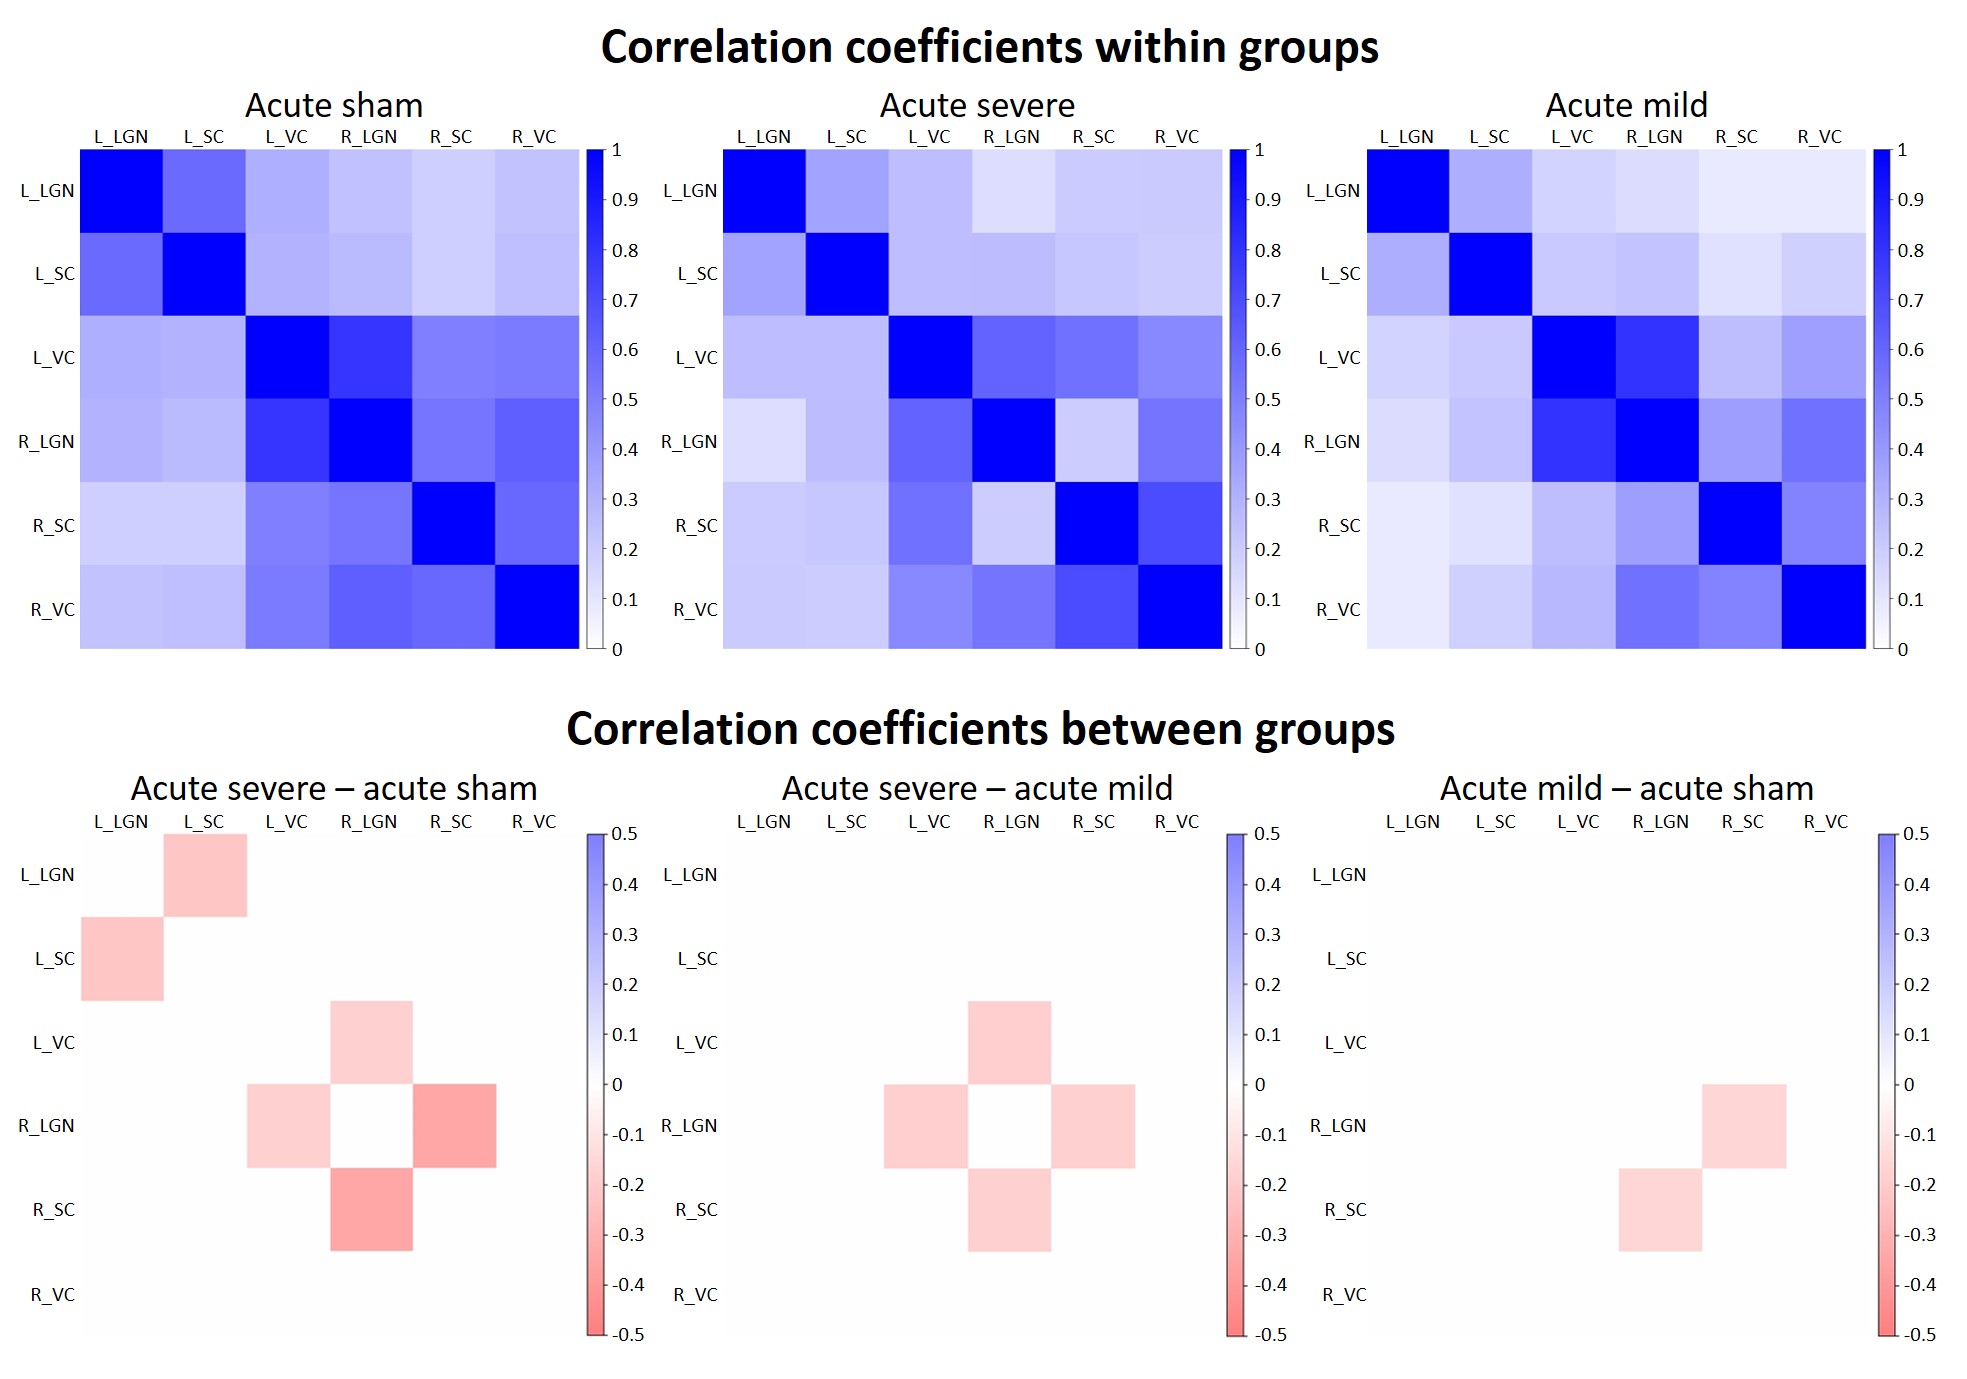
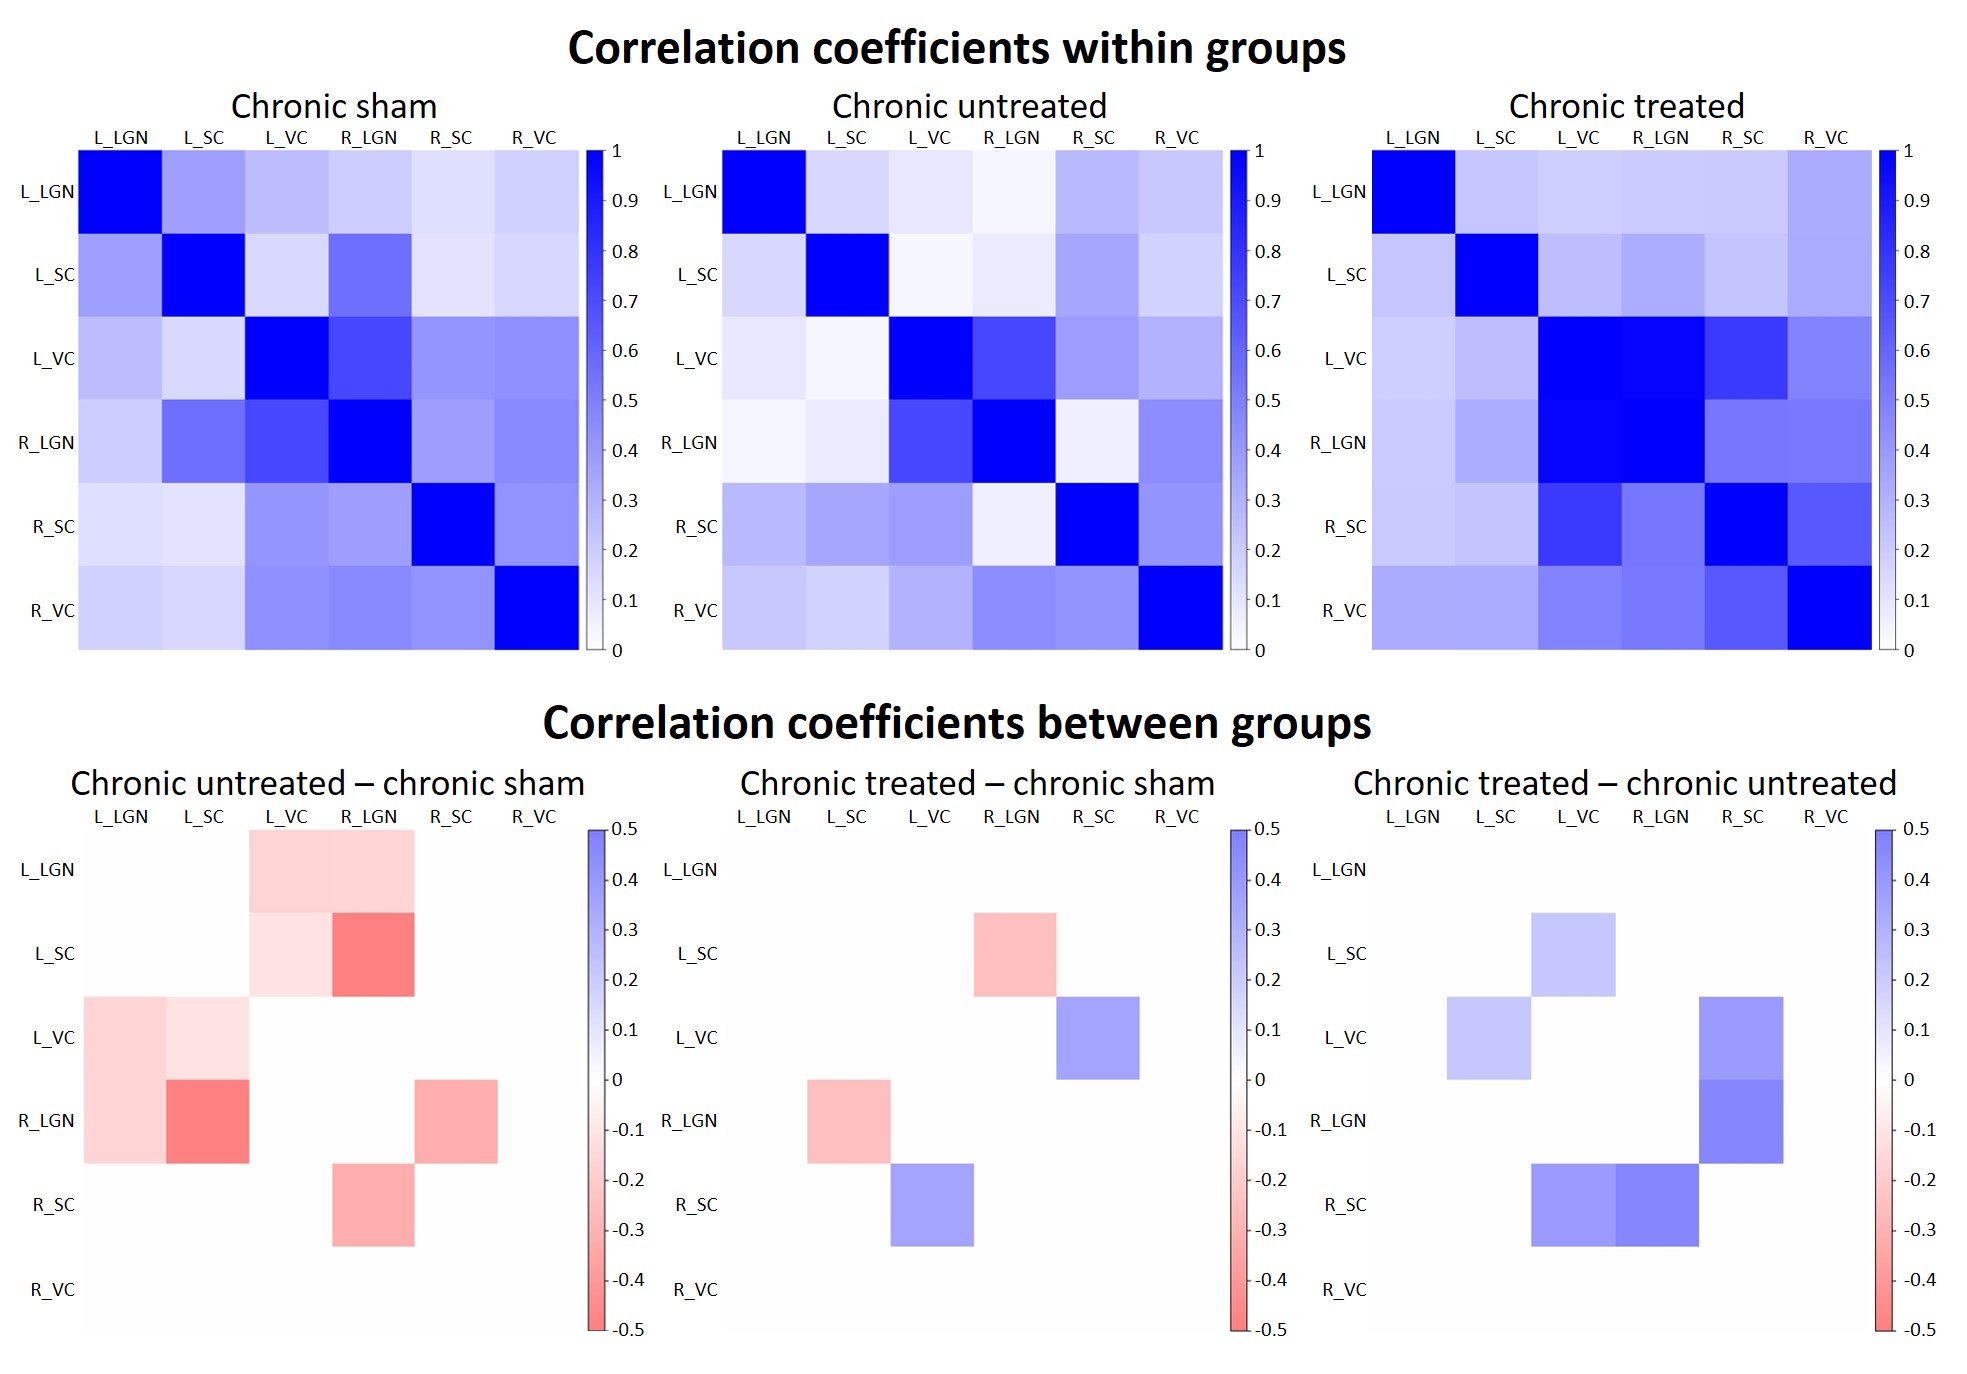
In the chronic groups, IOP of hydrogel-injected right eyes was significantly increased to similar extents in animals with and without oral citicoline treatment (Figure 1). IOP in the left uninjured eyes remained unchanged and was comparable to the right eyes of the sham group. For optokinetic assessments, VA of the right eyes in the acute groups was significantly decreased with increasing magnitude of IOP elevation (Figure 2). In the chronic groups, VA in the hydrogel-injected right eyes of the citicoline-treated group was significantly higher than that of the untreated group (Figure 3). VA in the left eyes of acute and chronic groups remained unchanged and was comparable to right eyes of the sham groups. For RSfcMRI, significant FC differences in subcortical visual nuclei were observed between all three acute groups, with the magnitude of FC differences increasing with the magnitude of IOP elevation (Figure 4). In the chronic IOP elevation groups, animals without citicoline treatment showed significantly decreased cortico-collicular, cortico-geniculate and subcortical FC compared to sham control within and between hemispheres, while oral citicoline treatment appeared to preserve or improve such FC (Figure 5).Discussion and conclusion
Our results indicate that increasing magnitude and duration of IOP elevation caused differential effects on the visuomotor behavior and FC between visual brain nuclei. Furthermore, oral citicoline treatment ameliorated some behavioral and FC changes after chronic IOP elevation.These findings suggest new potential mechanistic targets, and merit further investigation for the treatment of glaucoma beyond lowering IOP
Acknowledgements
This work was supported by the National Institutes of Health P30-EY008098 and R01-EY028125 (Bethesda, Maryland); BrightFocus Foundation G2013077 and G2016030 (Clarksburg, Maryland), Eye and Ear Foundation (Pittsburgh, Pennsylvania); and Research to Prevent Blindness (New York, New York).References
[1] Susanna, R., Jr., De Moraes, C.G., Cioffi, G.A. & Ritch, R. Why Do People (Still) Go Blind from Glaucoma? Transl Vis Sci Technol. Mar 2015. 4(2): 1. [2] Weiss, GB. Metabolism and actions of CDP-choline as an endogenous compound and administered exogenously as citicoline. Life Sci. Jan 1995. 56(9): 637-660. [3] Grieb, P., Rejdak, R. Pharmacodynamics of citicoline relavant to the treatment of glaucoma. J Neurosci Res. Jan 2002. 67(2):143-148. [4] Parisi, V., Coppola, G., Centofanti, M., Oddone, F., Angrisani, AM., Ziccardi, L., Ricci, B., Quaranta, L., Manni, G. Evidence of the neuroprotective role of citicoline in glaucoma patients. Prog Brain Res. 2008. 173:541-554. [5] Li, S., Fang, JH., Jiang, FG. Histological observation of RGCs and optic nerve injury in acute ocular hypertension rats. Int J Ophthalmol, 2010;3(4):311-5. [6] Yu, Y., and Chau, Y. Formulation of in situ chemically cross-linked hydrogel depots for protein release: from the blob model perspective. Biomacromolecules. Jan 2015. 16(1):56-65. [7] Prusky, G.T., Alam, N.M., Beekman, S., Douglas, R.M. Rapid quantification of adult and developing mouse spatial vision using a virtual optomotor system. Invest Ophthalmol Vis Sci. Dec 2004; 45(12):4611-6. [8] Douglas, R.M., Alam, N.M., Silver, B.D., McGill, T. J., Tschetter, W. W., Prusky, G.T. Independent visual threshold measurements in the two eyes of freely moving ras and mice using a virtual-reality optokinetic system. Sept 2005;22(5):677-84.Figures