3268
Resting state fMRI “Epilepsy networks”.1Department of Neuroimaging and Interventional Radiology, National Institute of Mental Health and Neurosciences, Bengaluru, India, 2Coma Science Group, Universitè de Liège, Liège, Belgium, 3Department of Electrical Engineering, Indian Institute of Technology Delhi, New Delhi, India, 4Department of Neurology, National Institute of Mental Health and Neurosciences, Bengaluru, India, 5Department of Neurology, Thomas Jefferson University, Philadelphia, PA, United States, 6Department of Neuropathology, National Institute of Mental Health and Neurosciences, Bengaluru, India, 7Department of Neurosurgery, National Institute of Mental Health and Neurosciences, Bengaluru, India, 8Department of Biostatistics, National Institute of Mental Health and Neurosciences, Bengaluru, India, 9Systems Science and Informatics Unit, Indian Statistical Institute, Bengaluru, India
Synopsis
Resting state functional MRI (rsfMRI) research typically focuses on few well identified networks though many more networks (15-80) are often visualized, in the course of investigating functional networks. It is customary to discard these networks as they are presumed to have no functional relevance. We used machine learning methods to identify “epilepsy networks” in 45 individuals with TLE using FSL derived 88 independent components. In line with evidence from experimental models, the current results indicates that TLE is associated with disease specific “rsfMRI epilepsy networks” which can be visualised in-vivo at individual subject level.
Introduction
Machine learning techniques are finding increasing relevance in providing subject specific predictions with more than 500 publications in the last decade1. These strategies have revealed mean accuracies of around 80 to 90% in predicting Alzheimers disease2,3, Schizophrenia4,5, and depressive disorders6,7.Methods
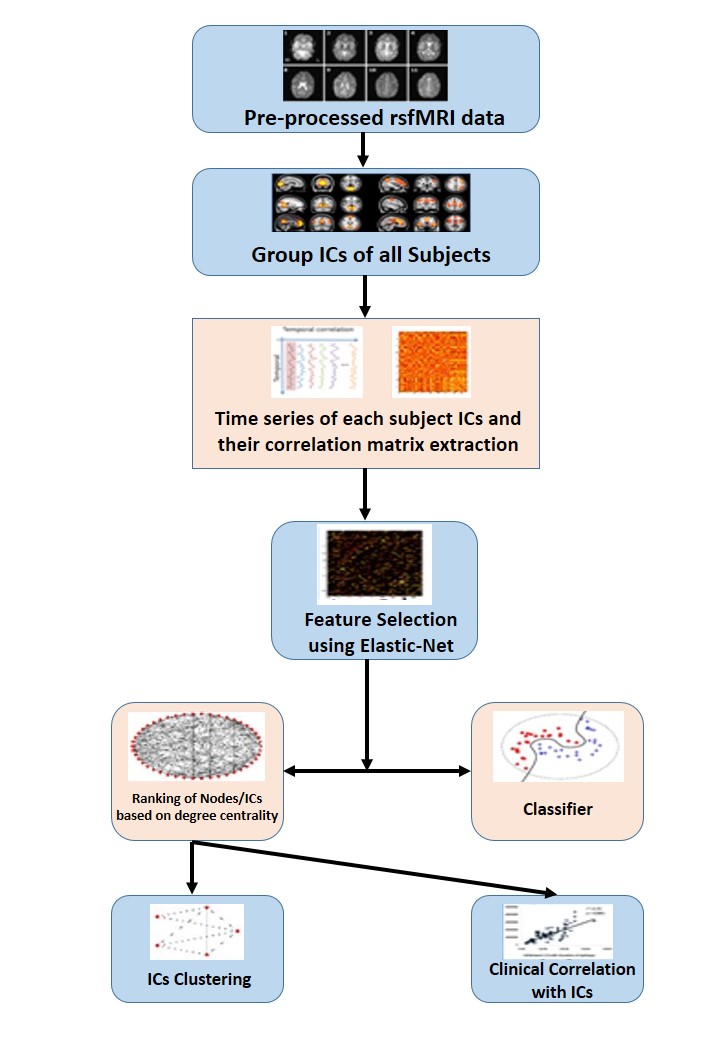
SPM pre-processed resting state fMRI was used for deriving Group ICA using FSL MELODIC. Time series and spatial z-maps of ICs were extracted using dual-regression. 88 noise free independent components were extracted as ‘correlation matrix’ by taking temporal correlation of time series of ICs. These correlation matrixes were taken as input for the classification algorithm. Elastic net was used for dimension reduction. Then the classifier Linear support vector machine (Lin SVM) and deep neural network (DNN) were used to classify the patients. Following this network visualization of ICs were done with edge weights obtained from ElasticNet. Clinical correlation done with the network (ICs) which were in the top 10 ranking.Results
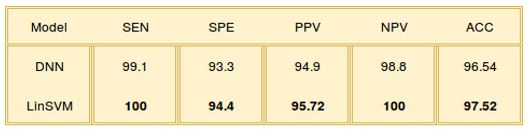
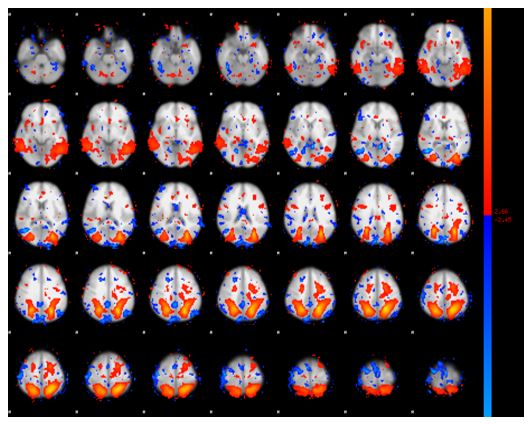
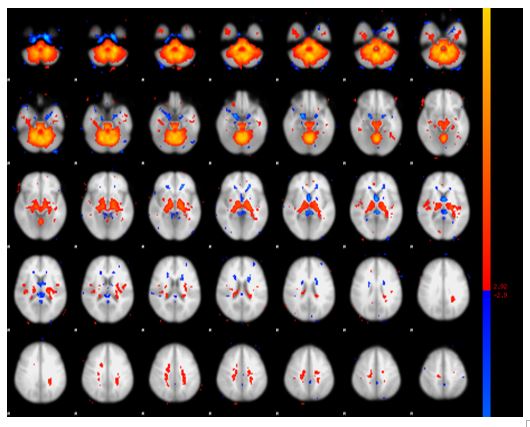
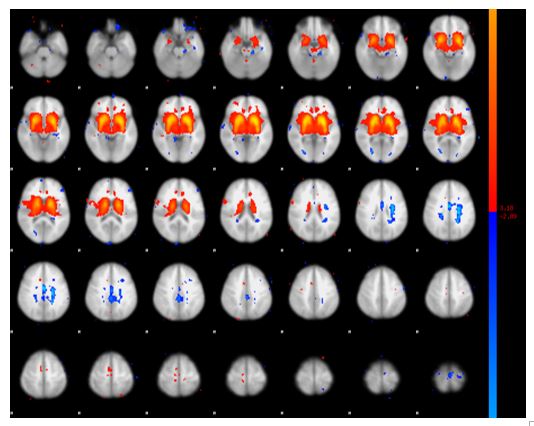
Analysis of rsfMRI IC’s using machine learning algorithms could identify 10 novel disease specific networks in patients with refractory epilepsy capable of predicting epilepsy with an accuracy of 97.5% (Figure 2). These networks in the decreasing order of their ranking involved the posterior quadrant, frontopolar, anterior frontal, thalamic, cerebello-thalamic, anterior tempero-thalamic, perisylvian, and cingulo-insular regions. The strength of posterior quadrant (Figure 3), cerebello-thalamic (Figure 4) and thalamic, (Figure 5) networks correlated with age at onset of seizures (R=0.58), duration of illness (R=0.56).Discussion
This study provides novel proof of concept evidence for the existence of “rsfMRI epilepsy networks” in patients with temporal lobe epilepsy owing to the high classification accuracy of Lin SVM, which is one of the sturdiest and popular machine learning technique. Though the concept of IC based “rsfMRI epilepsy networks” is novel, existence of disease specific metabolic networks is better known in alzheimers disease and parkinsons disease8-11. The spatial organization of these networks involving the areas commonly implicated in temporal plus epilepsy and their correlation with age at onset of seizures and duration of epilepsy further supports the argument for the existence of these epilepsy specific networks. Based on the evidence from the current study it is thus possible that the imaging evidence of “epilepsy networks” could further assist in improving the accuracy of non-invasive methods in the diagnosis of epilepsy, prediction of post-operative seizure freedom etc. Most importantly understanding epileptogenesis in the period before refractory seizures begin in TLE could be the greatest benefit for individuals living with epilepsy.Conclusion
Temporal lobe epilepsy is associated with several disease specific “rsfMRI epilepsy networks” involving the posterior quadrant, thalamic and cerebello-thalamic regions. These networks can be identified at a single subject level using machine learning techniques.Acknowledgements
We would like to acknowledge Aditya Jayashankar and Sujas Bhardwaj Research Fellows from Department of Neuroimaging and Interventional Radiology, NIMHANS, Bengaluru, India and Piyush Swami Research Fellow from Department of Electrical Engineering, IIT Delhi, India for their valuable intellectual input and their interest in the topic.References
1. Arbabshirani, M. R., Plis, S., Sui, J. & Calhoun, V. D. Single subject prediction of brain disorders in neuroimaging: Promises and pitfalls. Neuroimage 145, 137-165, doi:10.1016/j.neuroimage.2016.02.079 (2017).
2. Challis, E. et al. Gaussian process classification of Alzheimer's disease and mild cognitive impairment from resting-state fMRI. Neuroimage 112, 232-243, doi:10.1016/j.neuroimage.2015.02.037 (2015).
3. Jie, B., Zhang, D., Wee, C. Y. & Shen, D. Topological graph kernel on multiple thresholded functional connectivity networks for mild cognitive impairment classification. Hum Brain Mapp 35, 2876-2897, doi:10.1002/hbm.22353 (2014).
4. Fan, Y. et al. Discriminant analysis of functional connectivity patterns on Grassmann manifold. Neuroimage 56, 2058-2067, doi:10.1016/j.neuroimage.2011.03.051 (2011).
5. Su, L., Wang, L., Shen, H., Feng, G. & Hu, D. Discriminative analysis of non-linear brain connectivity in schizophrenia: an fMRI Study. Front Hum Neurosci 7, 702, doi:10.3389/fnhum.2013.00702 (2013).
6. Wei, M. et al. Identifying major depressive disorder using Hurst exponent of resting-state brain networks. Psychiatry Res 214, 306-312, doi:10.1016/j.pscychresns.2013.09.008 (2013).
7. Cao, L. et al. Aberrant functional connectivity for diagnosis of major depressive disorder: a discriminant analysis. Psychiatry Clin Neurosci 68, 110-119, doi:10.1111/pcn.12106 (2014).
8. Habeck, C. et al. Multivariate and univariate neuroimaging biomarkers of Alzheimer's disease. Neuroimage 40, 1503-1515, doi:10.1016/j.neuroimage.2008.01.056 (2008).
9. Eidelberg, D. Metabolic brain networks in neurodegenerative disorders: a functional imaging approach. Trends Neurosci 32, 548-557, doi:10.1016/j.tins.2009.06.003 (2009).
10. Niethammer, M. & Eidelberg, D. Metabolic brain networks in translational neurology: concepts and applications. Ann Neurol 72, 635-647, doi:10.1002/ana.23631 (2012).
11. Tang, C. C. et al. Metabolic network as a progression biomarker of premanifest Huntington’s disease. J Clin Invest. 123, 4076-4088, doi:10.1172/JCI69411 (2013).
Figures