3265
Rostro-caudal architecture of the frontal lobes in humans1BCBlab, Institut du Cerveau et de la Moelle, Paris, France
Synopsis
Functional models of the frontal lobes suggest a
Introduction.
Functional models of the frontal lobes suggest a rostro-caudal organization that is essential for goal-directed behavior and cognitive control, in which higher processing-level anterior regions send control signals to lower processing-level posterior regions 1-5. While these studies support the existence of a set of frontal regions arranged in an anterior-posterior progression of functional specialization, spatial and structural anatomical definition of these regions are unknown. To assess whether an architectural gradient supports this functional organization, we employed diffusion weighted imaging tractography based on Qball imaging 6-7 to segregate frontal areas based on their connectivity. We further examine the microstructural properties of these areas with recent developments in neuroimaging and post-mortem histology to reveal the anatomical signature of the frontal rostro-caudal organization.Material and methods.
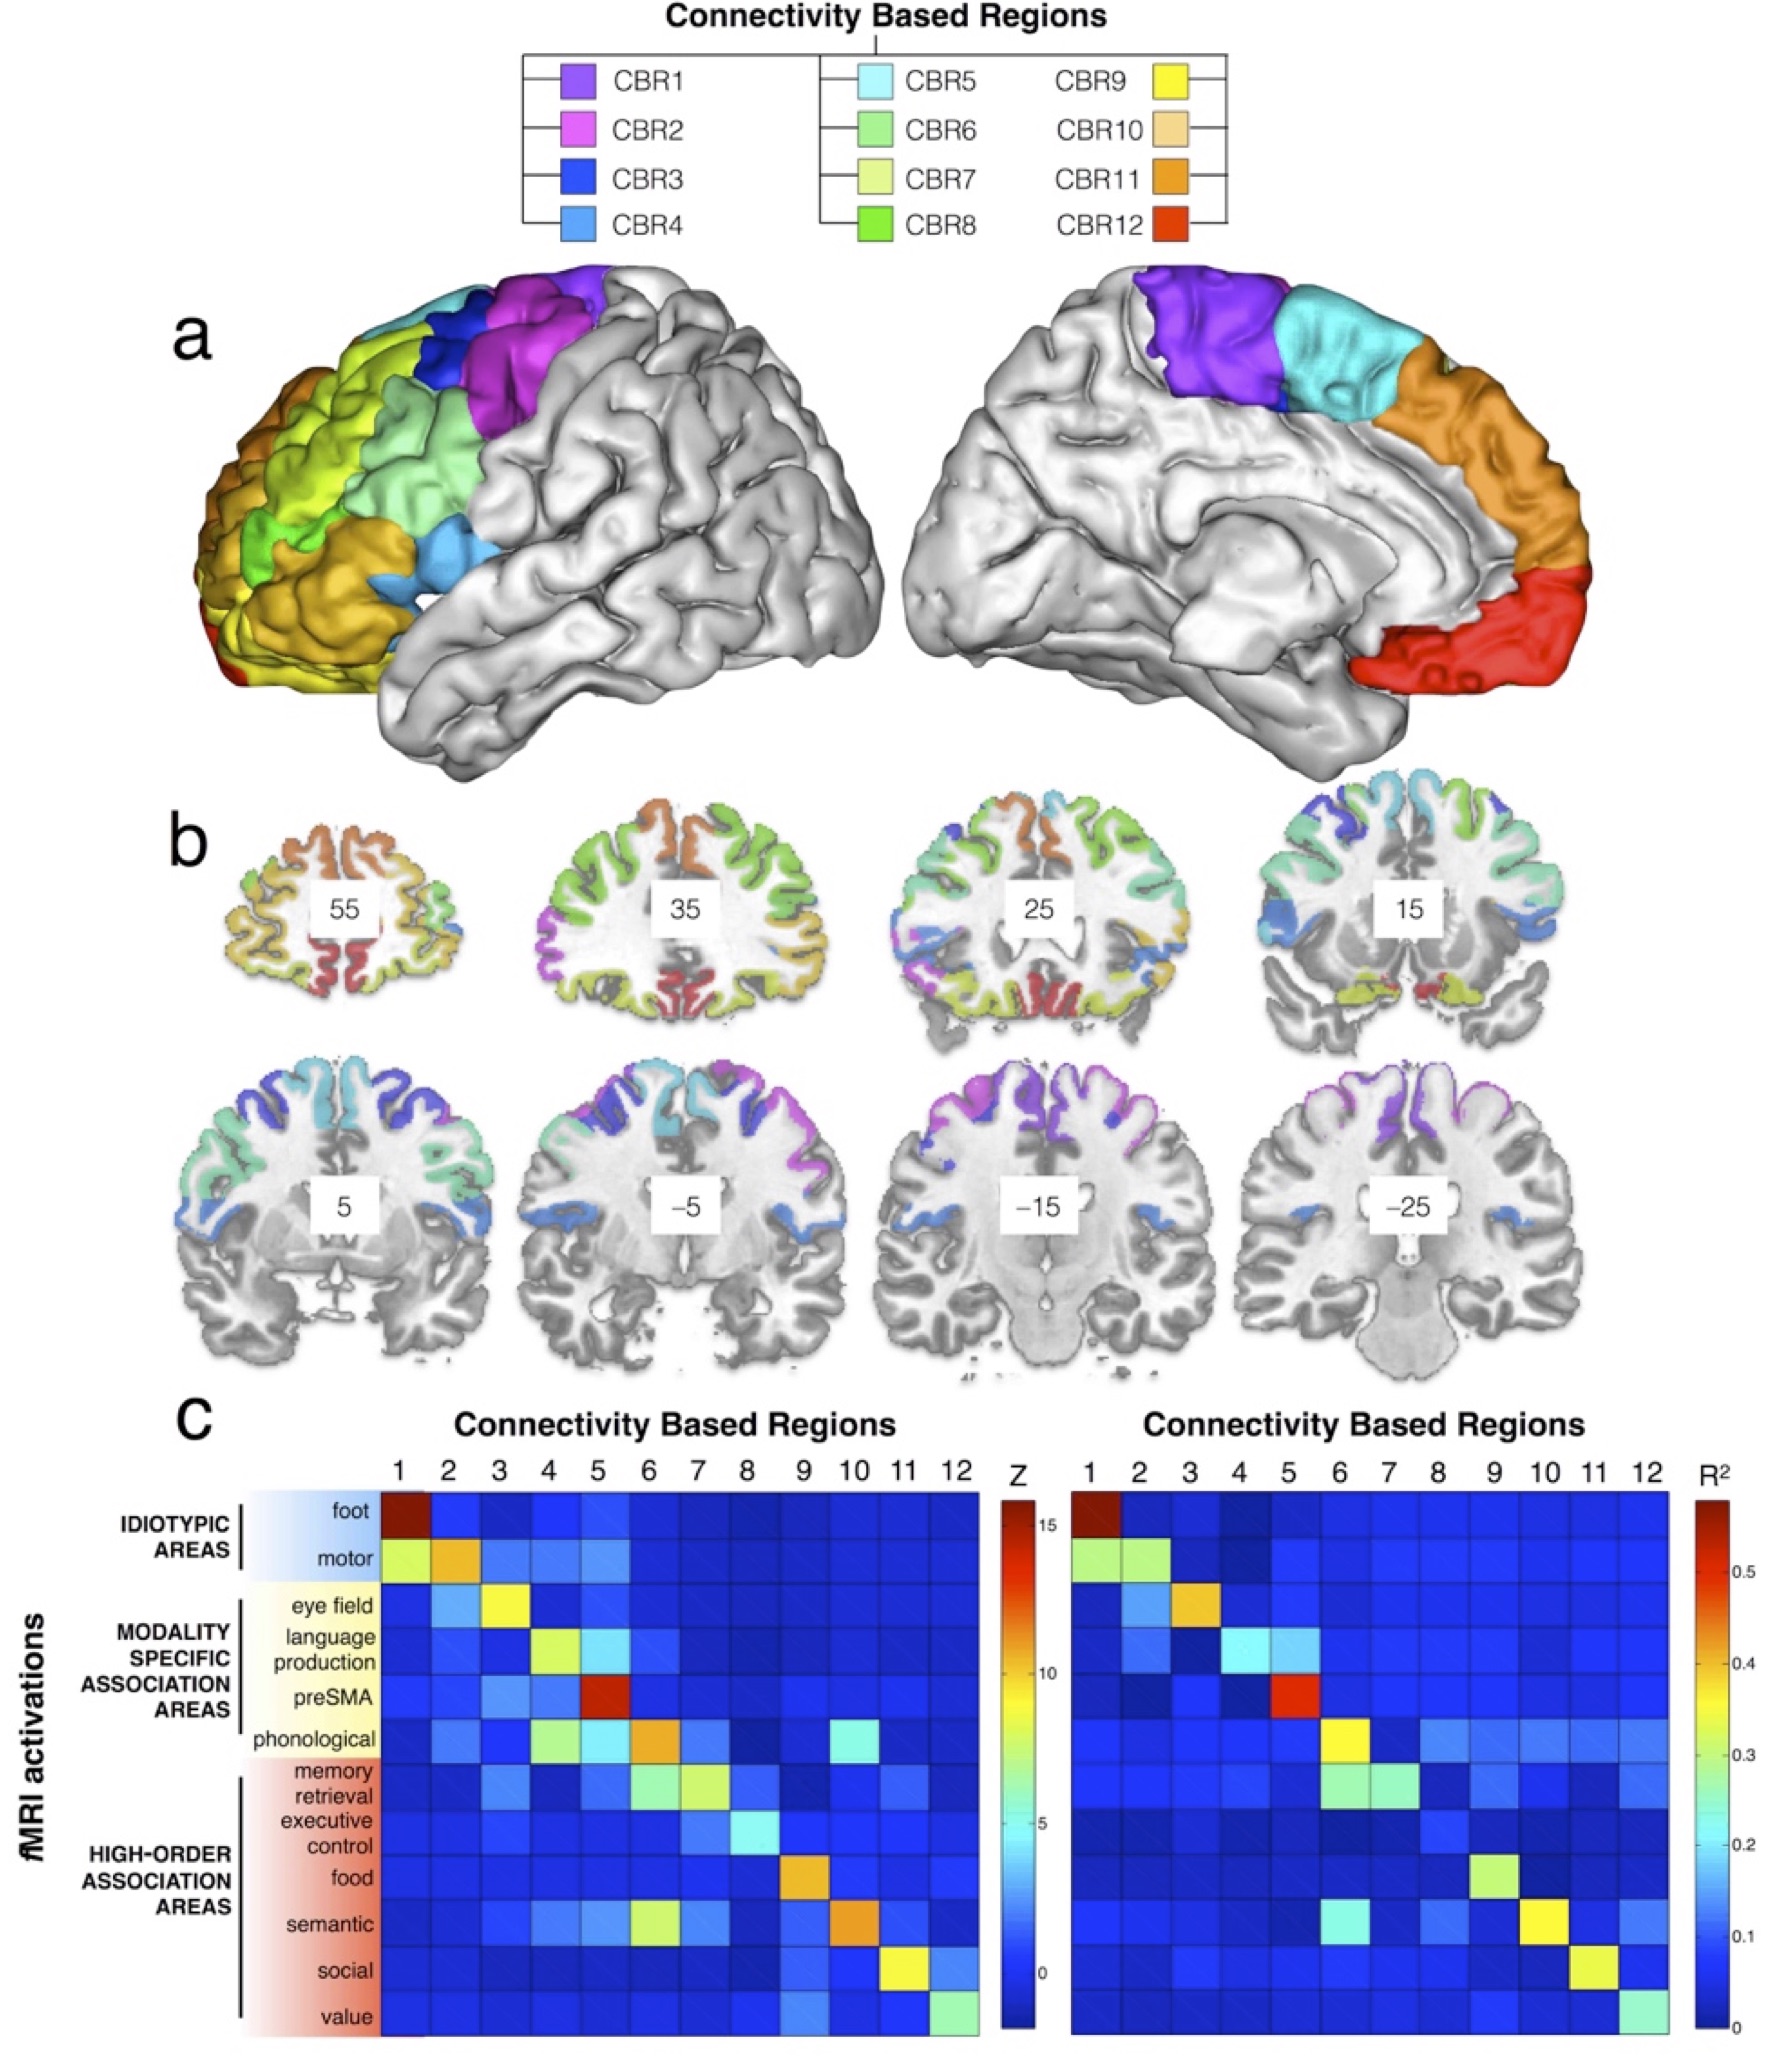
T1w and Diffusion weighted imaging were obtained from 12 healthy controls (2 males and 10 females; 26 to 35 year-old) from HCP (humanconnectome.org). Data was pre-processed using the default HCP pipeline (V.2). A tractography algorithm based on Qball imaging (20,000 samples, step length 0.5 mm, curvature threshold of 0.2) optimized for multishell 6 was used to propagate streamlines from ‘seed’ (in the frontal lobe) to ‘target’ (in the whole left hemisphere) regions of interest (ROIs) situated in the white matter that was the closest to the grey matter. A ‘connectivity’ matrix was fed to a PCA performed using SPSS software 8. Functional specificity across the connectivity based regions (CBR) identified was defined using the decode tool provided in Neurosynth (neurosynth.org). Additionally, each CBR was anatomically characterized extracting cortical thickness, T1/T2 signal, Big Brain silver staining intensity (bigbrain.loris.ca), and entropy measures derived from fix-corrected resting state functional MRI.Results.
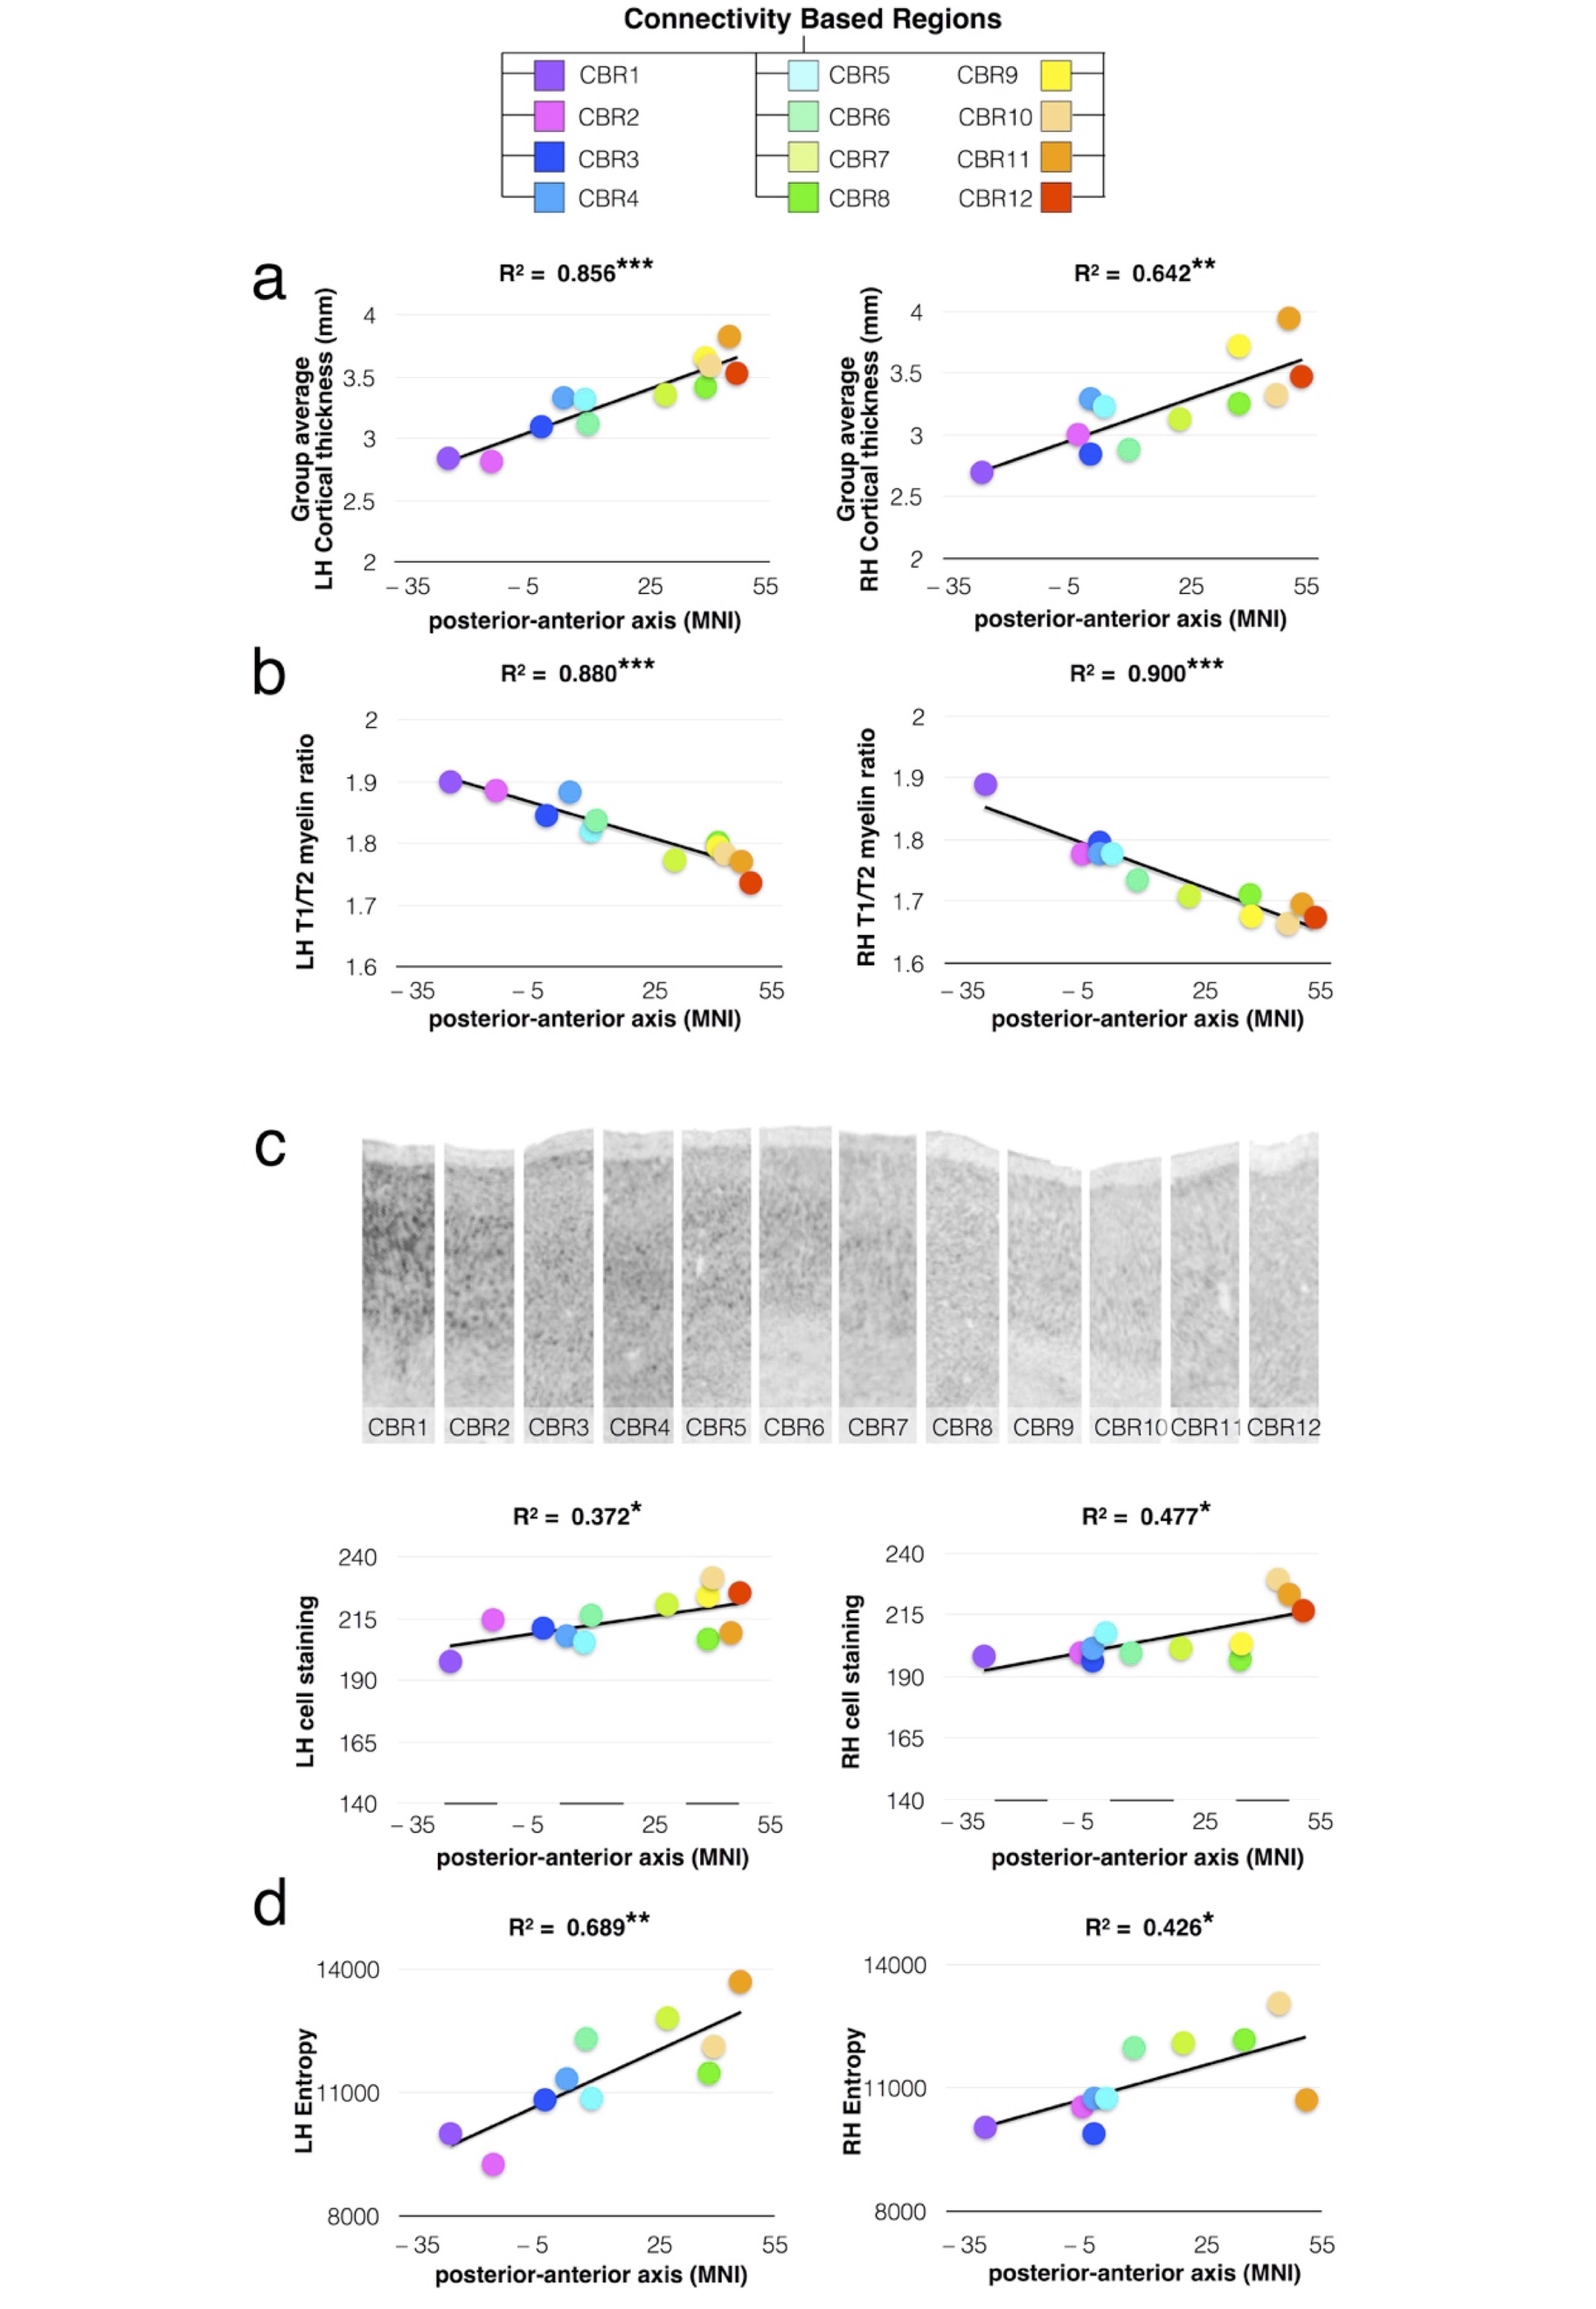
PCA identified 12 connectivity-based regions (CBRs) in the left frontal lobe of each participant (Fig. 1a). The comparison with a meta-analysis of functional imaging studies revealed a functional specialization for each of the identified CBRs (Fig. 1b). Cortical thickness analyses 9-10 revealed that anterior CBRs were progressively thicker than posterior CBRs in the left (LH) an the right (RH) hemispheres (Fig. 2a, LH R2 = 0.856 ; P < 0.001 ; RH R2 = 0.642 ; P = 0.002). Cortical myelin content was progressively lower from posterior to anterior CBRs (Fig. 2b LH R2 = 0.880 ; P < 0.001 ; RH R2 = 0.900 ; P < 0.001). There was also a gradient of cell body density with anterior CBRs containing smaller cells that are less densely packed than in posterior CBRs (Fig. 2c LH R2=0.372; P=0.035, RH R2=0.477 ; P=0.013). Anterior CBRs had a higher entropy than posterior CBRs for the left and right hemispheres (Fig. 2d; LH R2=0.689 ; P=0.003, RH R2=0.426 ; P=0.041)Discussion.
Tractography-based parcellation using the PCA statistical framework divided the frontal lobe into 12 areas corresponding to regions functionally engaged in specific tasks, organized along a rostro-caudal axis from the most complex high-order association areas to the simplest idiotopic areas. The rostro-caudal axis along which the 12 regions were organized also reflected a gradient of cortical thickness, myelination and cell body density. Importantly, across the identified regions, this gradient of microstructural features was strongly associated with the varying degree of information processing complexity.Conclusion.
This work provides a new framework, and subsequently, new hypotheses to test regarding the anatomical bases of frontal functions. This approach may strengthen the prediction or diagnosis of neurodevelopmental and neurodegenerative disorders.Acknowledgements
Data was provided in part by the Human Connectome Project, WU-Minn Consortium (Principal Investigators: David Van Essen and Kamil Ugurbil; 1U54MH091657) funded by the 16 NIH Institutes and Centers that support the NIH Blueprint for Neuroscience Research; and by the McDonnell Center for Systems Neuroscience at Washington University. The BigBrain dataset is the result of a collaborative effort between the teams of Dr Katrin Amunts, Dr Karl Zilles (Forschungszentrum Jülich) and Dr Alan Evans (Montreal Neurological Institute). Additional support comes from the “Agence Nationale de la Recherche” [grants number ANR-09-RPDOC-004-01 and number ANR-13- JSV4-0001-01] and from the Fondation pour la Recherche Médicale (FRM). The research leading to these results received funding from the program “Investissements d’avenir” ANR-10- IAIHU-06.References
1. Badre, D.; D'Esposito, M., Is the rostro-caudal axis of the frontal lobe hierarchical? Nat Rev Neurosci 2009, 10 (9), 659-69.
2. Badre, D., Cognitive control, hierarchy, and the rostro-caudal organization of the frontal lobes. Trends Cogn Sci 2008, 12 (5), 193-200.
3. Badre, D.; D'Esposito, M., Functional magnetic resonance imaging evidence for a hierarchical organization of the prefrontal cortex. J Cogn Neurosci 2007, 19 (12), 2082-99.
4. Christoff, K.; Keramatian, K.; Gordon, A. M.; Smith, R.; Madler, B., Prefrontal organization of cognitive control according to levels of abstraction. Brain Res 2009, 1286, 94-105.
5. Mesulam, M., Behavioral Neuroanatomy: Large-Scale Networks, Association Cortex, Frontal Syndromes, the Limbic System, and Hemispheric Specializations. In Principles of Behavioral and Cognitive Neurology, Second Edition ed.; Mesulam, M., Ed. Oxford University Press: 2000; pp 1-91.
6. Aganj, I.; Lenglet, C.; Sapiro, G.; Yacoub, E.; Ugurbil, K.; Harel, N., Reconstruction of the orientation distribution function in single- and multiple-shell q-ball imaging within constant solid angle. Magn Reson Med 2010, 64 (2), 554-66.
7. Tuch, D.; Wisco, J. J.; Khachaturian, M.; Ekstrom, L.; Ko¨tter, R.; Vanduffel, W., <i>Q</i>-ball imaging of macaque white matter architecture. Philosophical Transactions of the Royal Society B: Biological Sciences 2005, 360 (1457), 869-879.
8. Thiebaut de Schotten, M.; Urbanski, M.; Valabregue, R.; Bayle, D. J.; Volle, E., Subdivision of the occipital lobes: an anatomical and functional MRI connectivity study. Cortex 2014, 56, 121-37.
9. Tustison, N. J.; Cook, P. A.; Klein, A.; Song, G.; Das, S. R.; Duda, J. T.; Kandel, B. M.; van Strien, N.; Stone, J. R.; Gee, J. C.; Avants, B. B., Large-scale evaluation of ANTs and FreeSurfer cortical thickness measurements. Neuroimage 2014, 99, 166-79.
10. Das, S. R.; Avants, B. B.; Grossman, M.; Gee, J. C., Registration based cortical thickness measurement. Neuroimage 2009, 45 (3), 867-79.
Figures