3262
Cerebrovascular Brain Aging Examined with Arterial Spin Labelling and Applied to Age Prediction1University of Calgary, Calgary, AB, Canada, 2McGill University, Montreal, QC, Canada
Synopsis
Changes in both cortical thickness and cerebral blood flow are observed with age. In this work, we look at how these parameters are modulated across the lifespan. T1-weighted and arterial spin labelling data from 146 subjects were analyzed, with 68 cortical regions selected in each subject to obtain mean cortical thickness and cerebral blood flow. We calculated rates of change, correlation, and laterality for both parameters. Finally, we explored predictive modeling using cortical thickness, CBF and a model combining the two. Predictive modelling was slightly improved when both measures were included.
Introduction
Aging is known to have effects on the anatomy and physiology of the brain.[1,2] In fact, age prediction from brain morphology has been investigated by several research groups and has been suggested to be a surrogate measure of brain health.[3-6] However, these studies are usually limited to anatomical T1-weighted MRI data. Chen et al., reported thinning of the cerebral cortex that is associated with cerebral blood flow (CBF) decreases.[7] Thus, we hypothesized that including CBF data for age prediction would improve accuracy. The aim of this study is to assess regional CBF measurements and cortical thickness across the adult lifespan, and incorporate CBF measurements for age prediction to investigate the additional predictive power it can provide to chronological age estimation of healthy subjects.
Methods
A total of 146 subjects (58-M, 88-F; 18 to 87 years) were scanned with a 3T MRI (Discovery 750, GE Healthcare). All subjects included in this analysis had a Montreal Cognitive Assessment score >25 (indicating normal cognition). All subjects self-reported normal neurological and vascular medical history. Among others, T1-weighted anatomical and arterial spin labelling (ASL) were acquired and used for this analysis. The T1-weighted MPRAGE scan with an isotropic image resolution of 1 mm was acquired with TI/TR/TE/α of 650/5.84/2.36 ms/8°. The pseudo-continuous ASL was acquired with 5-mm thick slices and a spiral trajectory with an effective in-plane resolution of 2.33 mm, label duration and post label duration were 1.0 s and 2.0 s, respectively.
FreeSurfer was used to calculate cortical thickness measurements from the anatomical scans for a total of 68 volumes-of-interest (VOIs) using the cortical parcellation from the DK atlas.[8] CBF images were registered to the anatomical data and the same VOIs were used to determine the corresponding mean CBF. CBF data were then registered to the ICBM atlas,[9] and group average and aging regression maps were computed.
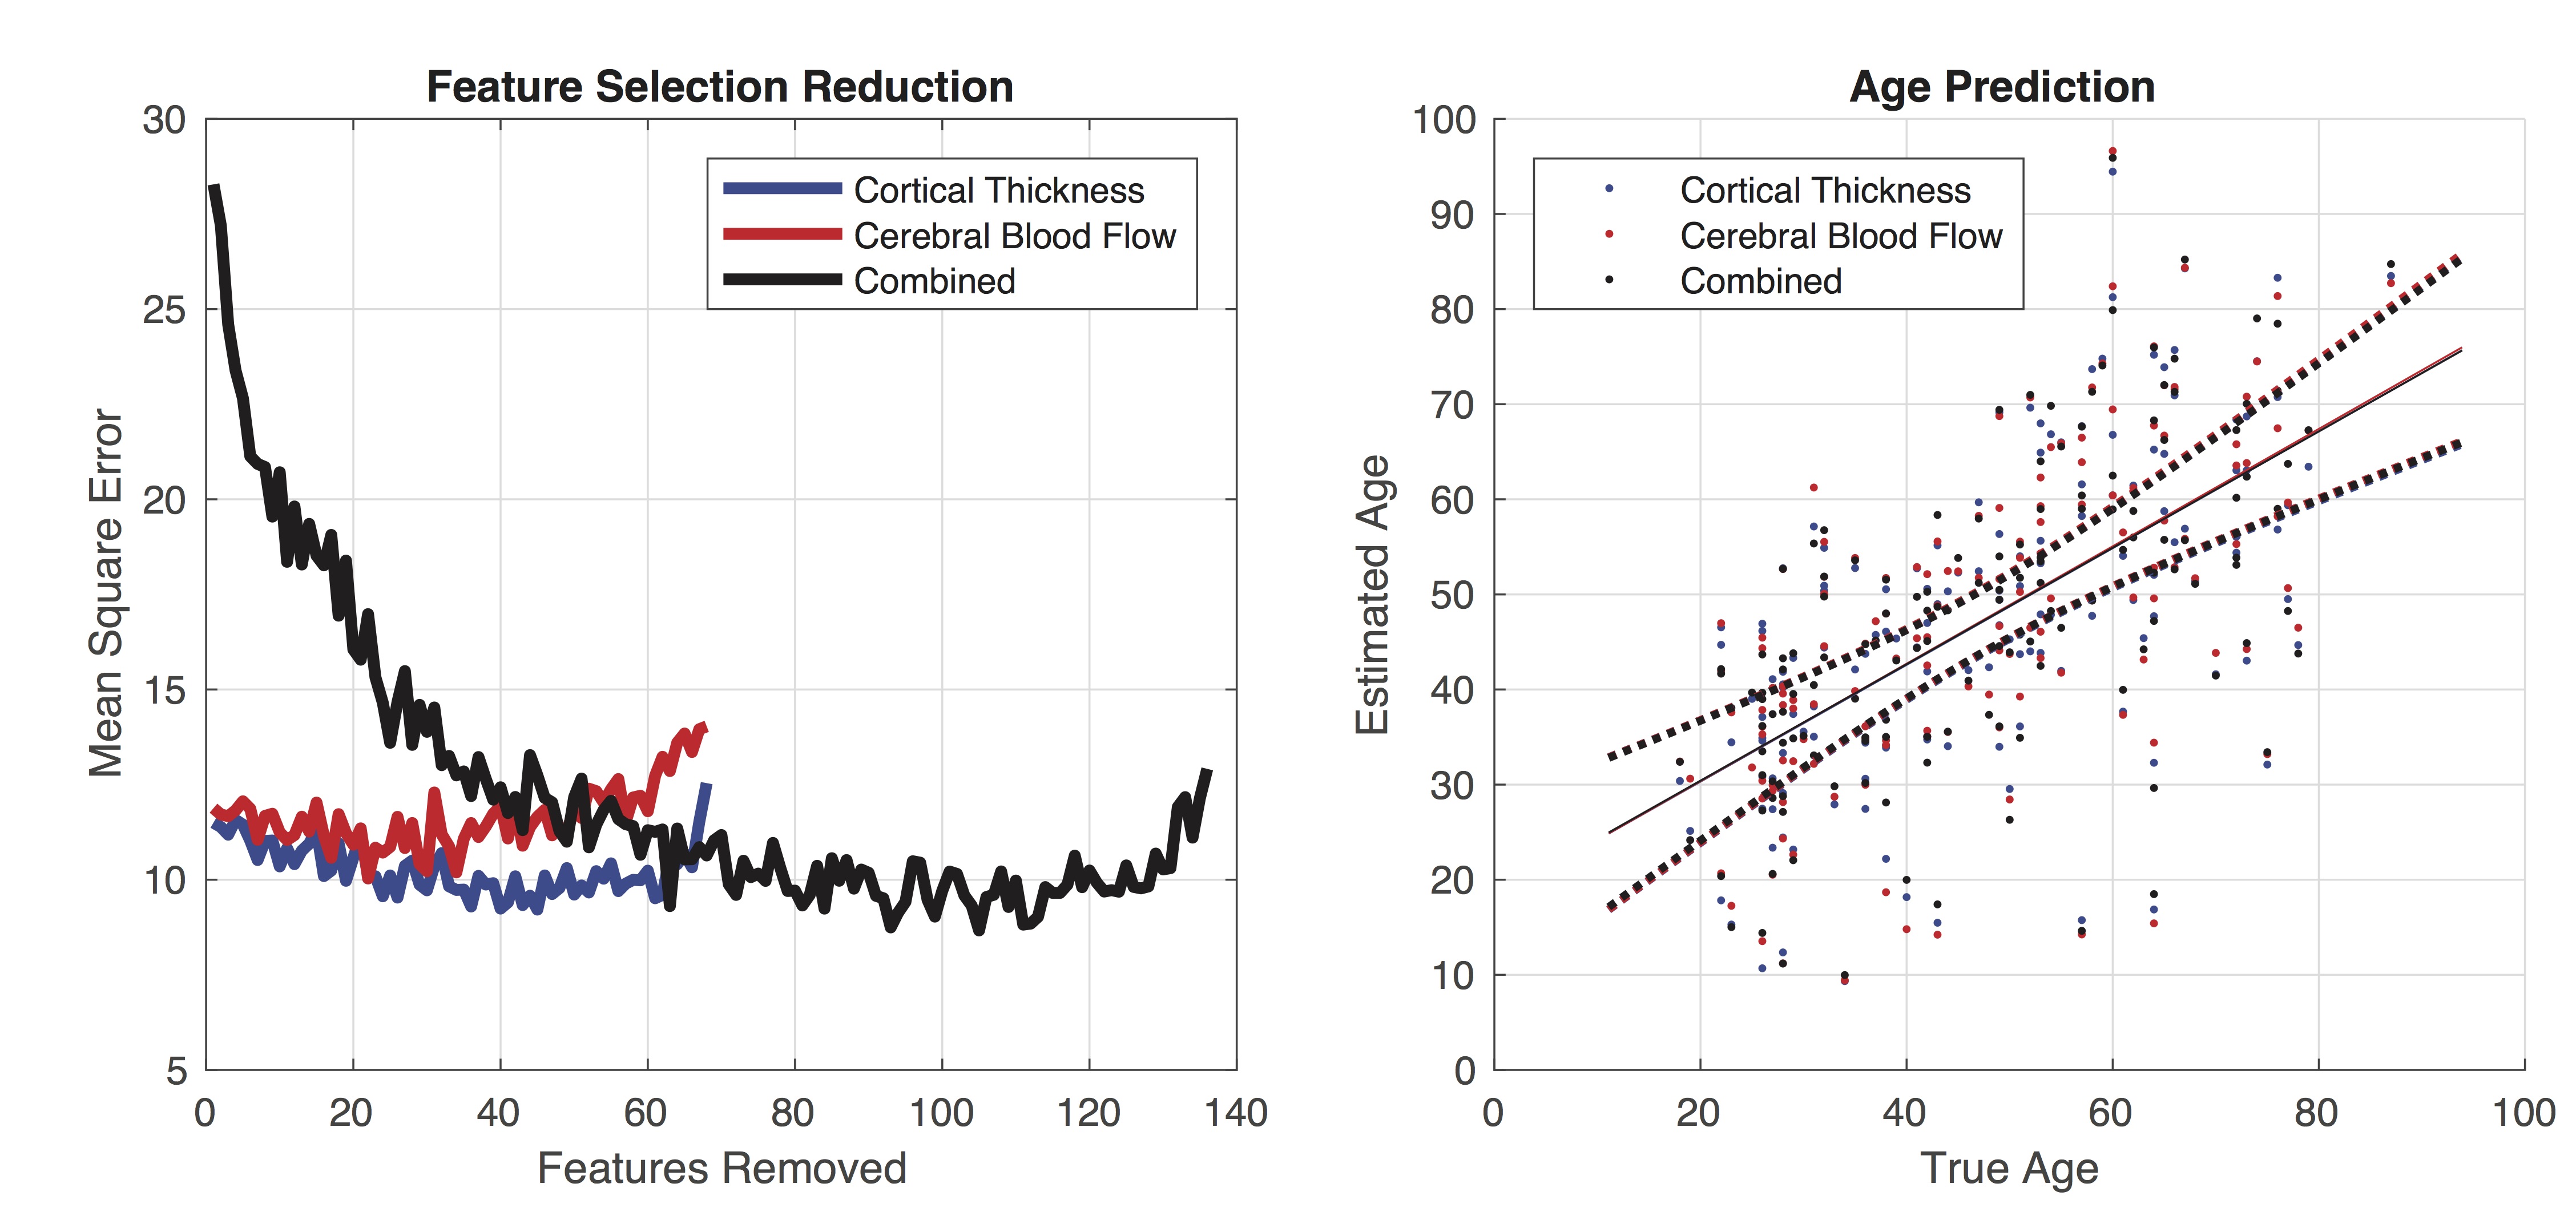
Linear regression with age was calculated for each region on both the cortical thickness and CBF data. Average laterality index and regional correlation matrices were then calculated for each data type. Multiple linear regression with recursive feature selection using the ReliefF algorithm[10] was used for age prediction, in three input setups: 1) cortical thickness, 2) CBF, and 3) both.
Results
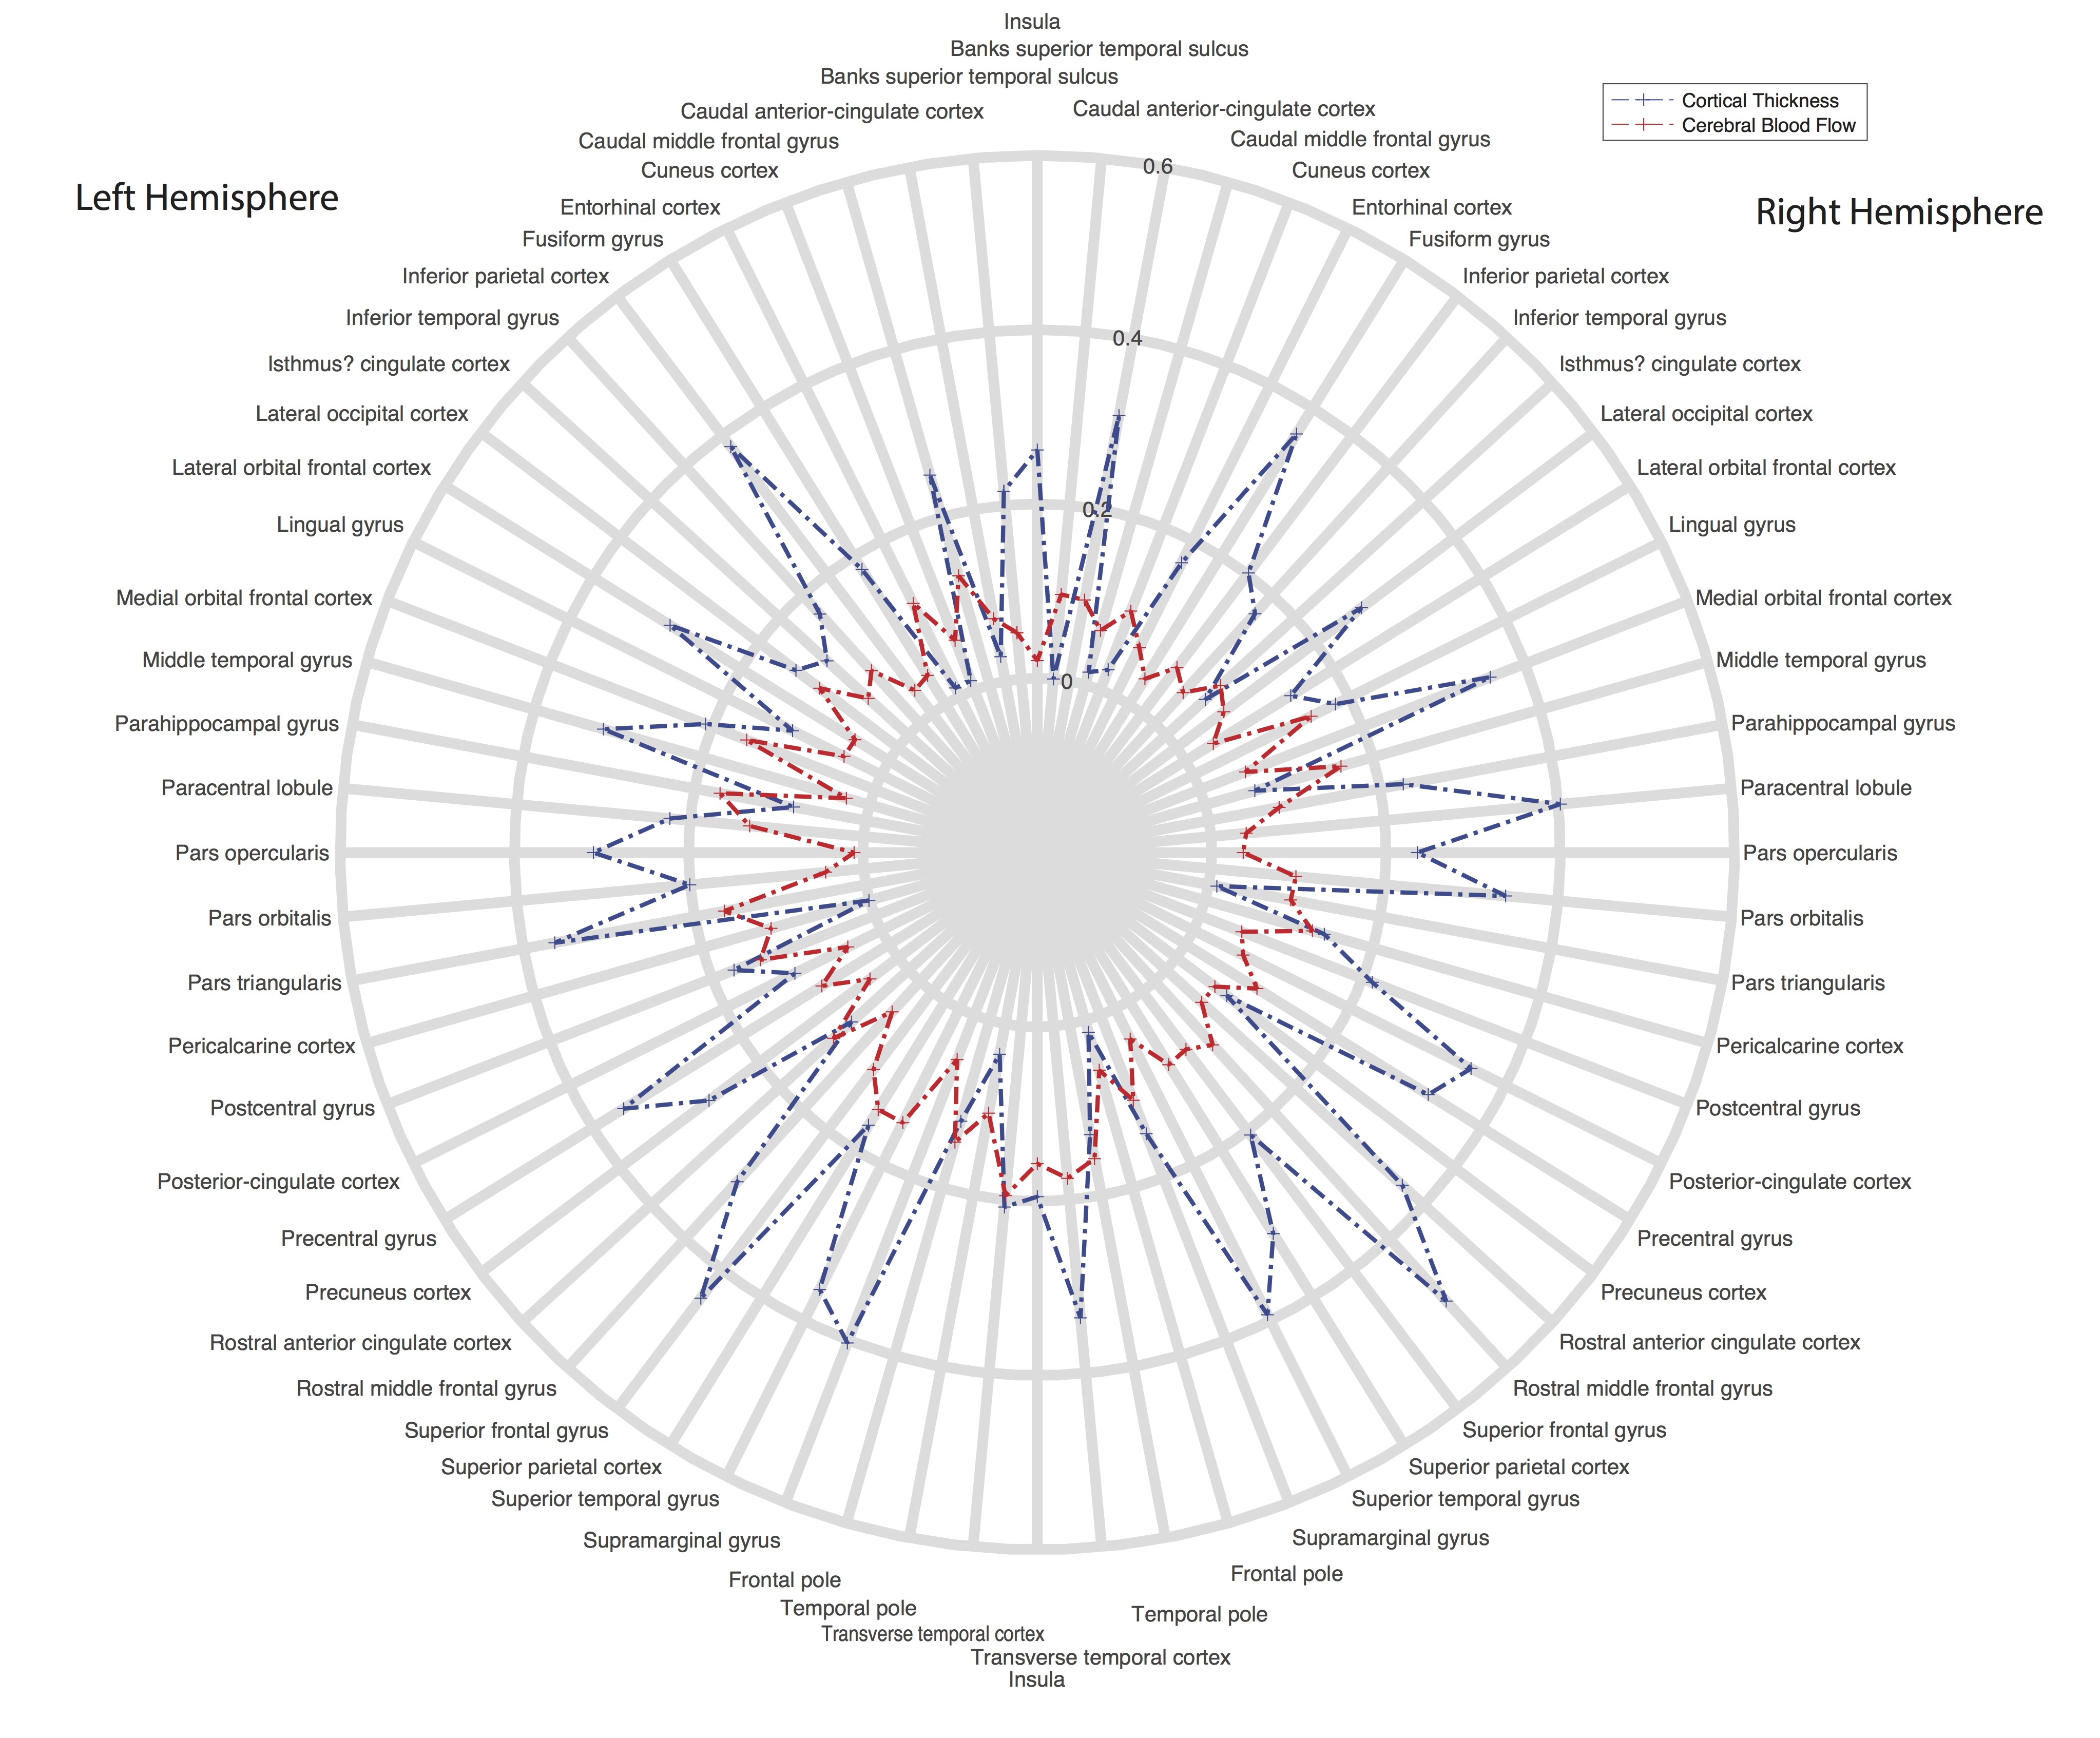
A polar plot is shown in Figure 1 to illustrate the differences in regional regression (R2) with age for the cortical thickness and CBF data. In general, the R2 is lower for the CBF data.
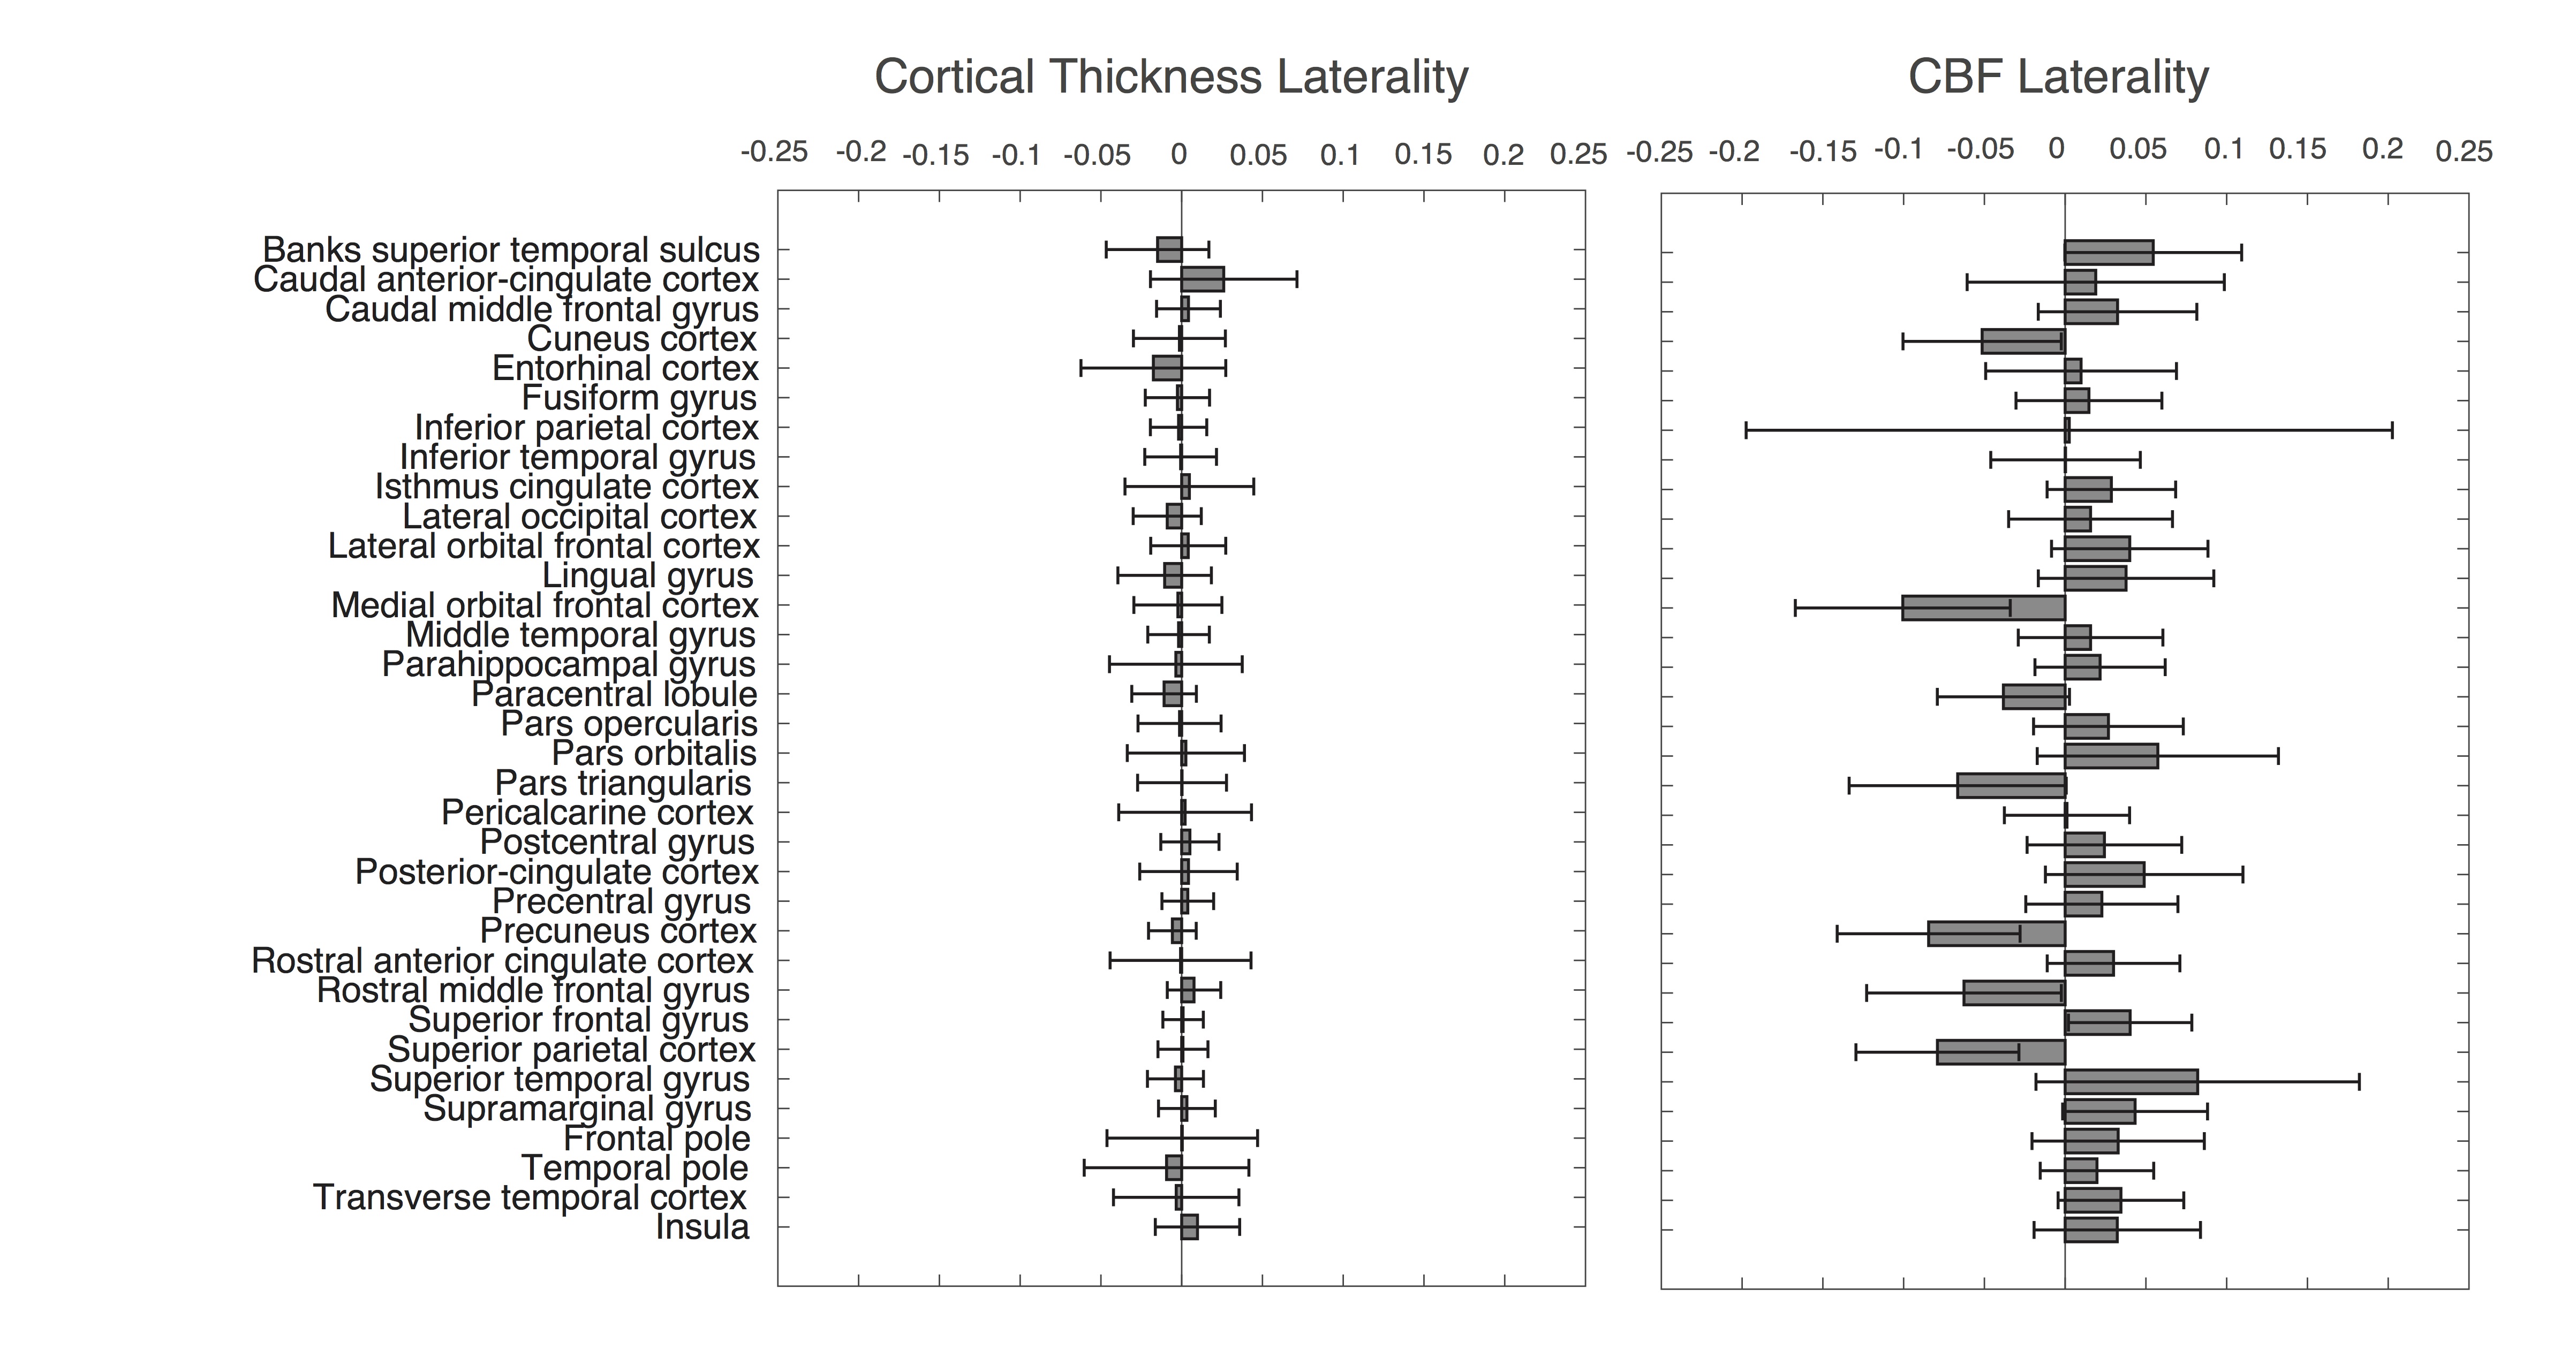
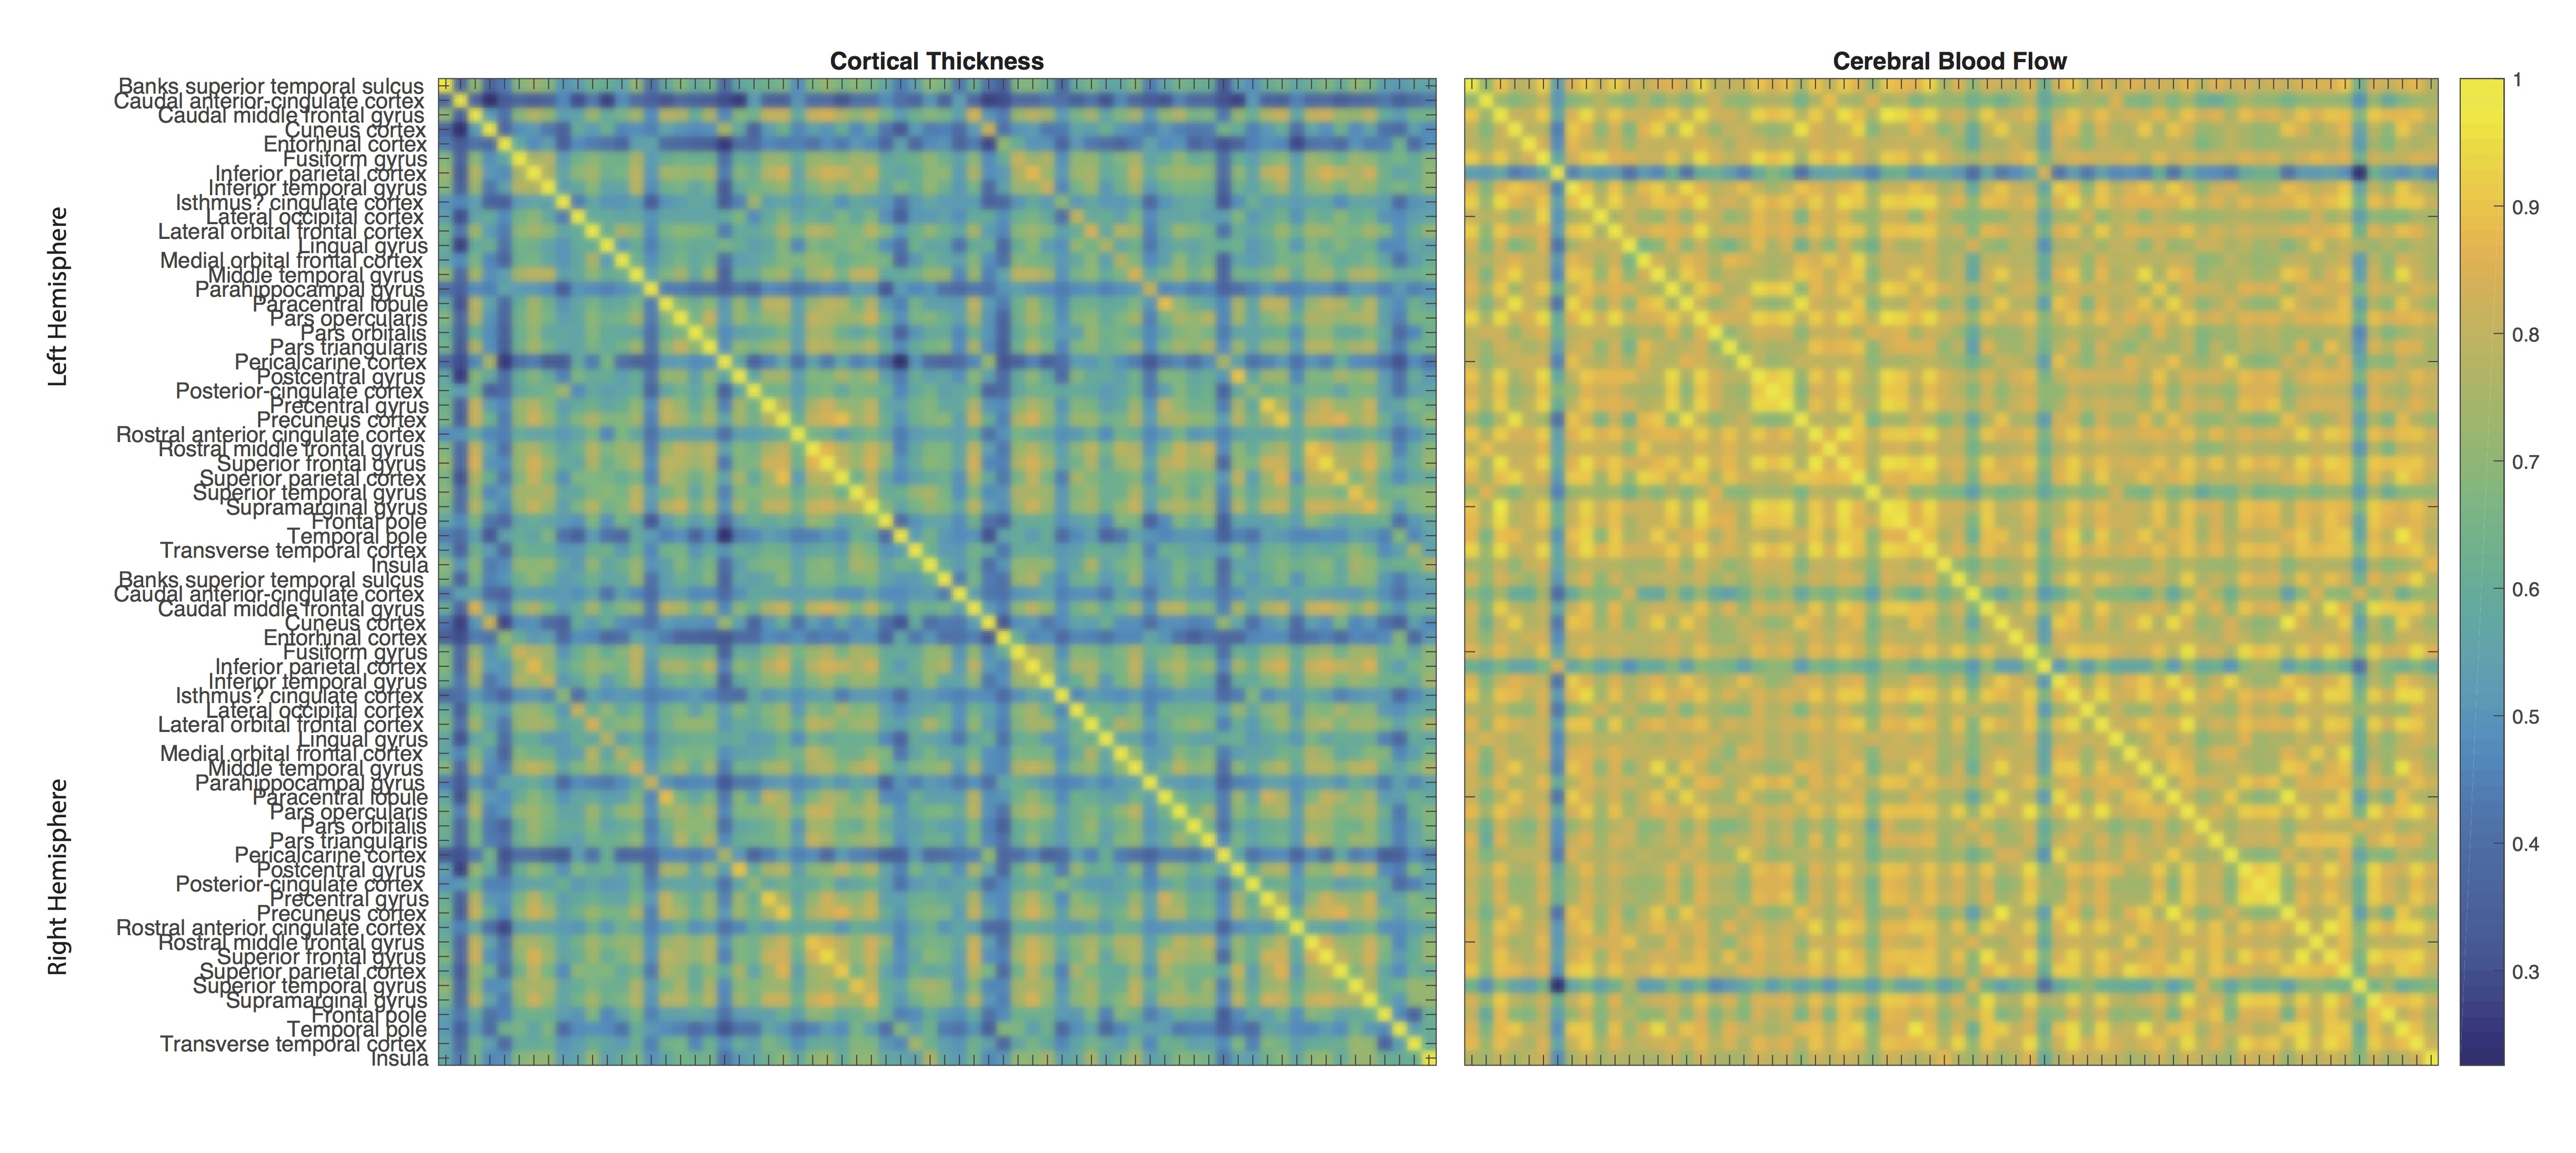
Figures 2 and 3 show the correlation and laterality indices. CBF measurements are more highly correlated across regions than cortical thickness data, while there is more laterality in the CBF data.
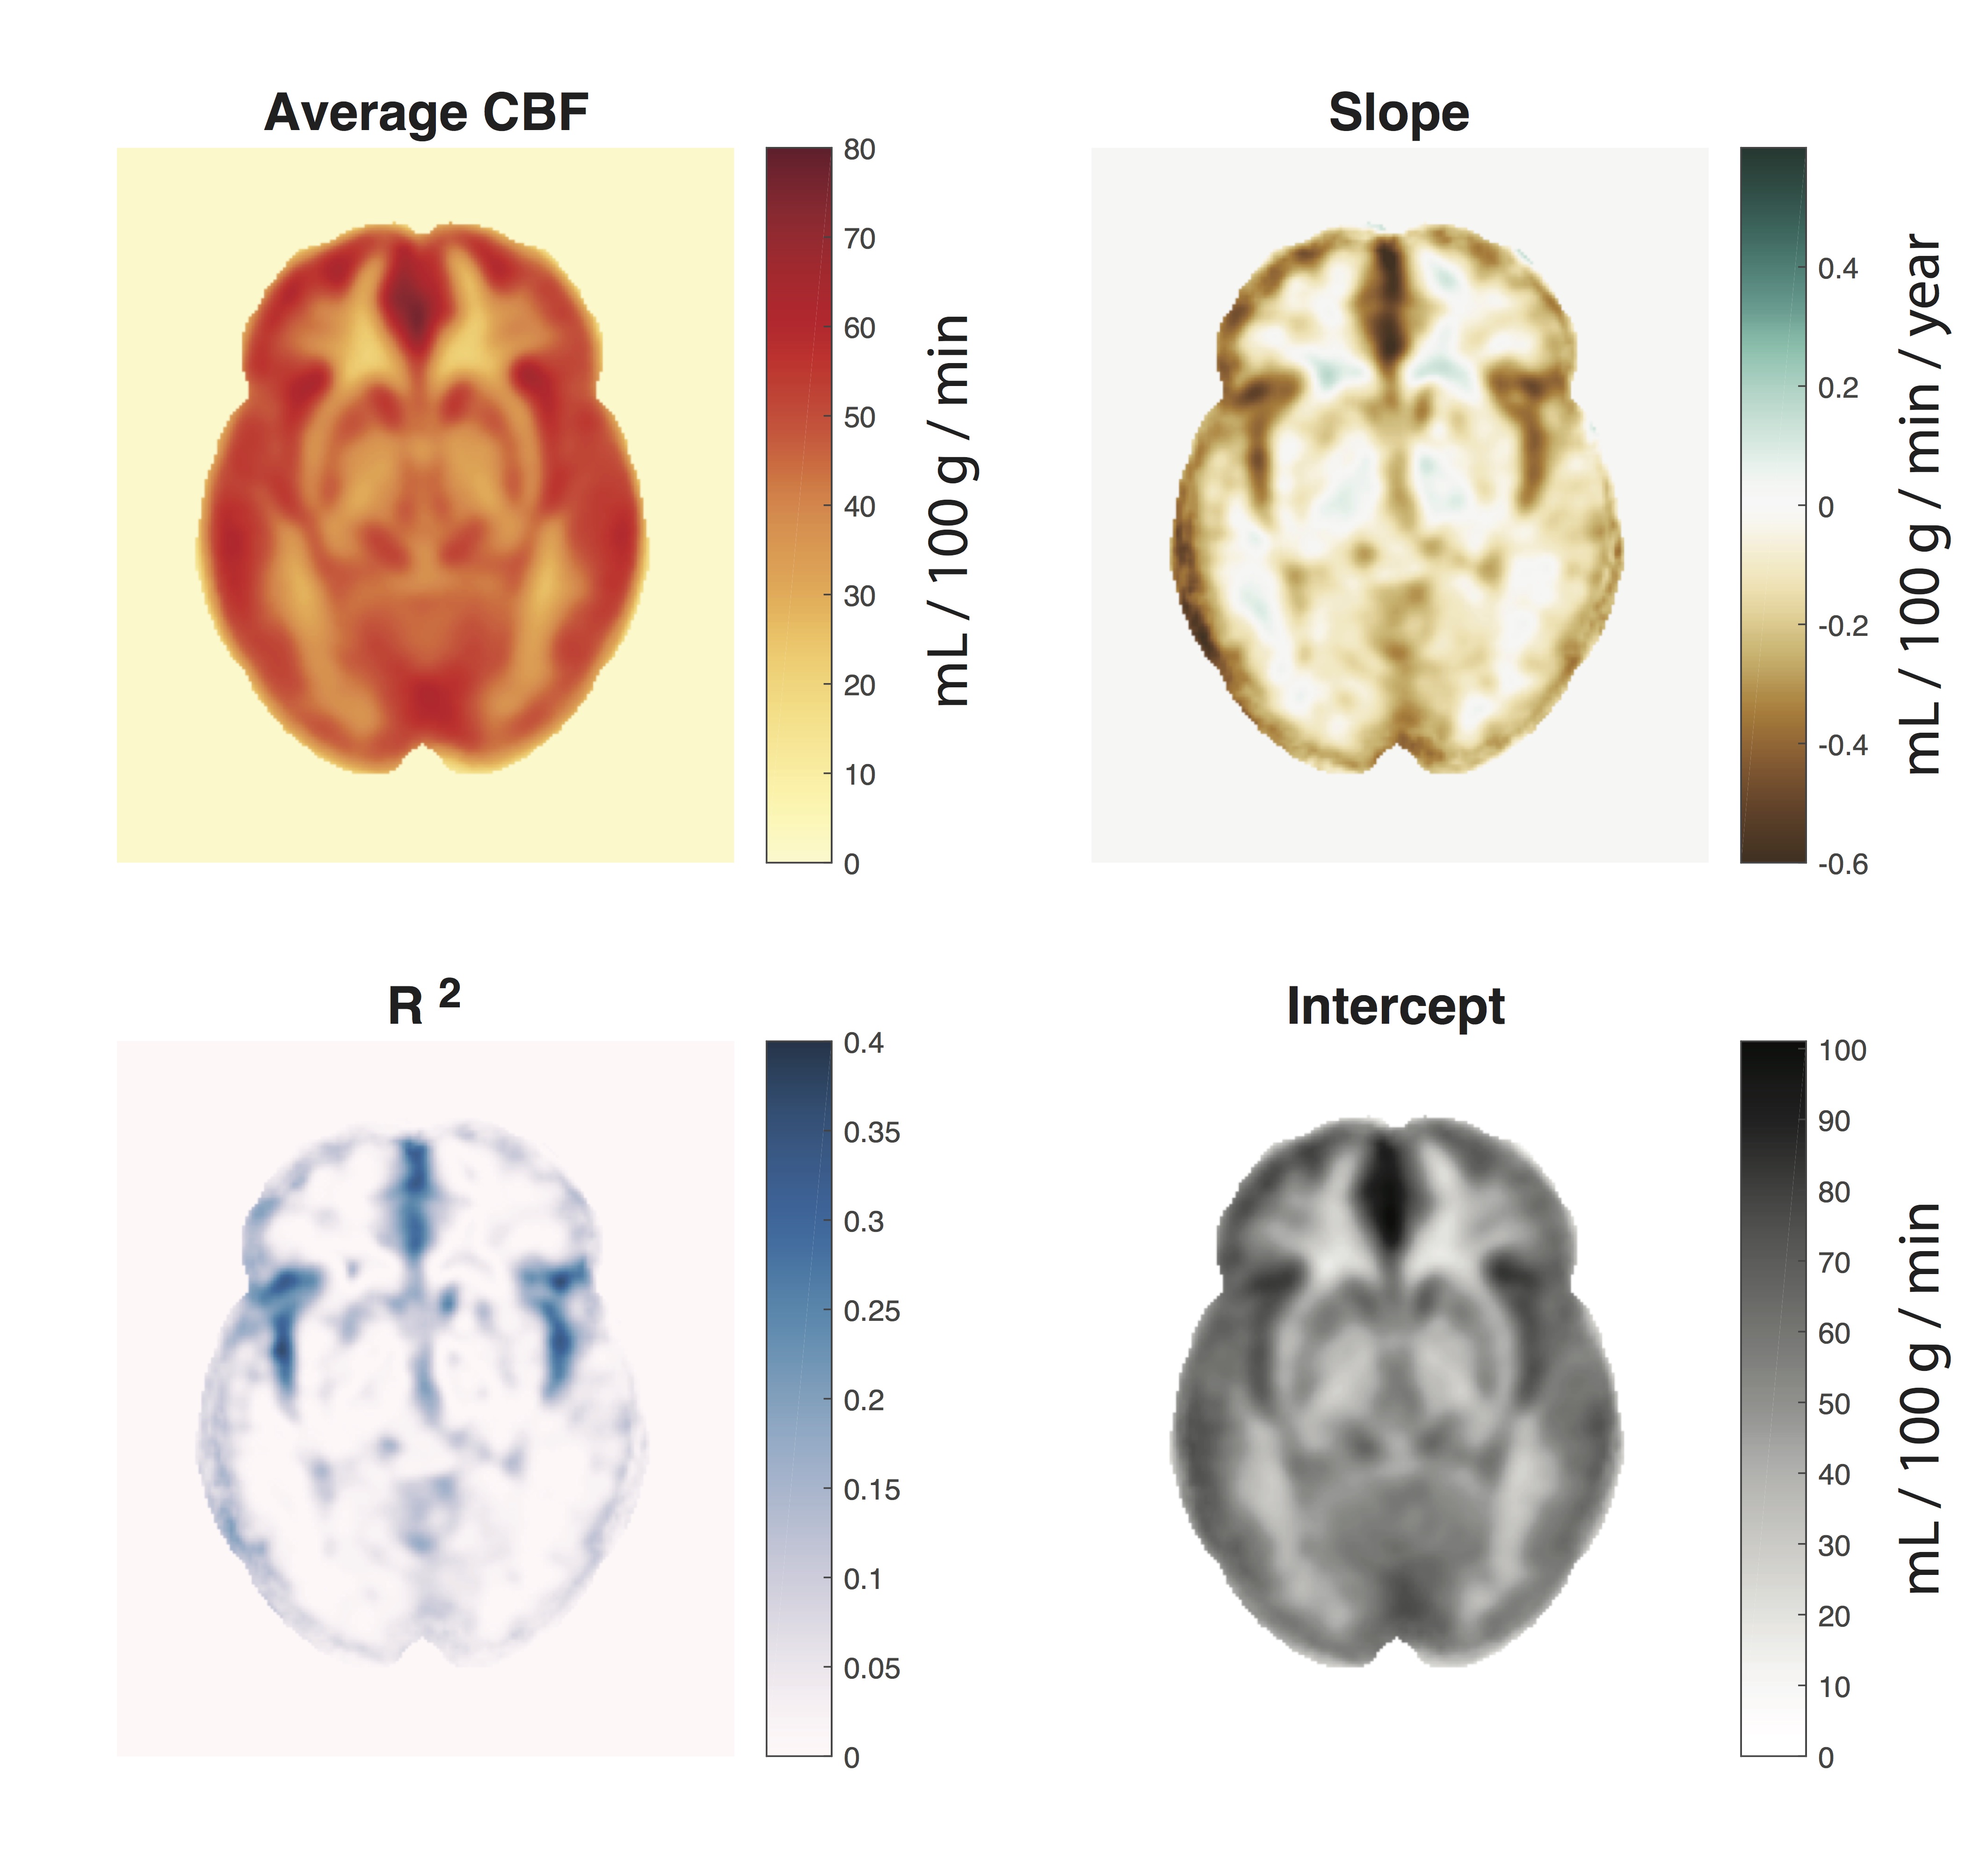
Figure 4 shows the CBF group average and regression maps. Generally, the rate of change is higher in gray matter. R2 was most robust near the feeding vessels (MCA, ACA).
Figure 5 shows the outcome of the multiple regression age prediction for the cortical thickness data alone, CBF alone, and for the combination.
Discussion
While results may vary slightly with different population selection or acquisition parameters, some generalizable observations include: 1) CBF data has lower R2 with age than cortical thickness, 2) there is more laterality in CBF than cortical thickness, 3) cortical thickness is less correlated amongst regions than CBF, 4) group average maps indicate that the reduction of CBF with age is constrained primarily to gray matter with similar rates of change across regions, and 5) age prediction was good for either cortical thickness and CBF alone only, and slightly better with the combination.
Compared to previous similar studies,[11,12] this study adds new information including the laterality analysis. It has been known that cortical thickness changes are typically bilateral, and often only the bilateral average cortical thickness values are reported,[11] while more laterality has been observed in CBF.[12] Structural cortical thickness correlation matrices are often computed,[13] but, to our knowledge, this is the first evaluation of cortical CBF correlation.
Cortical thickness and CBF measurements are not necessarily changing linearly with age, particularly in the younger age ranges. Due to the variability in the data and relatively small sample size, the linear approximation is appropriate. Inclusion of more subjects might allow a more precise piecewise linear regression or non-linear modelling. More advanced techniques, such as support vector machine or random forest modelling, could also improve age prediction based on cortical thickness and CBF.
Conclusion
There is more laterality in CBF than cortical thickness yet high correlation between regional CBF values. While age prediction via cortical thickness or CBF was good, the combination of both provided only a small improvement.Acknowledgements
No acknowledgement found.References
1. Salat DH, Buckner RL, Snyder AZ, et al. Thinning of the Cerebral Cortex in Aging. Cereb Cortex 2004;14(7):721-730.
2. Amin-Hanjani S, Du X, Pandey DK, Thulborn KR, Charbel FT. Effect of age and vascular anatomy on blood flow in major cerebral vessels. J Cereb Blood Flow Metab 2014.
3. Valizadeh SA, Hänggi J, Mérillat S, Jäncke L. Age prediction on the basis of brain anatomical measures. Hum Brain Mapp 2017;38(2):997-1008.
4. Tustison NJ, Cook PA, Klein A, et al. Large-scale evaluation of ANTs and FreeSurfer cortical thickness measurements. Neuroimage 2014;99:166-179.
5. Gaser C, Franke K, Klöppel S, Koutsouleris N, Sauer H, Alzheimer's Disease Neuroimaging I. BrainAGE in Mild Cognitive Impaired Patients: Predicting the Conversion to Alzheimer’s Disease. PLoS ONE 2013;8(6):e67346.
6. Franke K, Ziegler G, Klöppel S, Gaser C. Estimating the age of healthy subjects from T1-weighted MRI scans using kernel methods: Exploring the influence of various parameters. Neuroimage 2010;50(3):883-892.
7. Chen Y, Wang DJ, Detre JA. Test-retest reliability of arterial spin labeling with common labeling strategies. Journal of magnetic resonance imaging : JMRI 2011;33(4):940-949.
8. Desikan RS, Ségonne F, Fischl B, et al. An automated labeling system for subdividing the human cerebral cortex on MRI scans into gyral based regions of interest. Neuroimage 2006;31(3):968-980.
9. Mazziotta J, Toga A, Evans A, et al. A probabilistic atlas and reference system for the human brain: International Consortium for Brain Mapping (ICBM). Philos Trans R Soc Lond B Biol Sci 2001;356(1412):1293-1322.
10. Robnik-Šikonja M, Kononenko I. Theoretical and Empirical Analysis of ReliefF and RReliefF. Machine Learning 2003;53(1):23-69.
11. Lemaitre H, Goldman AL, Sambataro F, et al. Normal age-related brain morphometric changes: nonuniformity across cortical thickness, surface area and gray matter volume? Neurobiol Aging 2012;33(3):617.e611-617.e619.
12. MacDonald ME, Frayne R. Phase contrast MR imaging measurements of blood flow in healthy human cerebral vessel segments. Physiol Meas 2015;36(7):1517–1527.
13. Chen ZJ, He Y, Rosa-Neto P, Gong G, Evans AC. Age-related alterations in the modular organization of structural cortical network by using cortical thickness from MRI. Neuroimage 2011;56(1):235-245.
Figures