3259
Gray matter alterations in childhood obesity1MTA-PTE Clinical Neuroscience MR Research Group, Pecs, Hungary, 2Department of Neurology, University of Pécs, Pecs, Hungary, 3Department of Paediatrics, University of Pécs, Pecs, Hungary, 4Department of Radiology, University of Pécs, Pecs, Hungary
Synopsis
Childhood obesity a is major public health problem. 89 children were selected from a subsample of the I. Family study and investigated the volumes of predefined reward system structures -which are presumed to play crucial roles in body weight regulation- using MR volumetry and voxel-based morphometry. Statistical associations between obesity-related measures and MR based volumetric and morphometric parameters were assessed. Volumes of accumbens and amygdala showed significant positive correlations with obesity, while their gray matter density inversely related to obesity. Our results indicate that obesity is associated with enlarged brain volumes, but decreased gray matter density in the reward system.
INTRODUCTION
The prevalence of childhood obesity more than doubled in the last two decades. Within the framework of an international study aiming childhood obesity and using an experimental design similar to our earlier study 1, we investigated the volume of those predefined reward system structures, which are presumed to play a crucial role in body weight regulation using MR volumetry and voxel-based morphometry.METHODS
Subjects were selected from a subsample of the I.Family study examined in the Hungarian center; study design has been described in detail elsewhere 2. Fifty-one Caucasian children (32 females; mean age: 13.8 ± 1.9, range: 10.2 – 16.5 years) participated in the study. Anthropometric data and obesity related measures were assessed at the day of MRI (T4) and ~1.89 years (mean ± SD: 689 ± 188 days) before the examination (T3). BMI z-scores were calculated for each subject according to the LMS method 3,4. All subjects were measured on the same 3T MRI scanner (MAGNETOM Trio, Siemens AG, Erlangen, Germany). An isotropic T1-weighted 3D MPRAGE image was acquired based on the recommended morphometry protocols for optimal FreeSurfer reconstruction. The investigated subcortical brain structures were automatically segmented by Freesurfer 6.0 image analysis suite, technical details were described previously 5,6. Statistical analyses were performed using IBM SPSS 20. Multiple linear regression analyses were used to assess whether the volumes of predefined subcortical structures were associated with different obesity measures. Voxel-based morphometry was performed using FSL-VBM. The amount of GM (i.e. gray matter mass=GMM) were assessed by introducing a compensation (or "modulation") step for the contraction/enlargement due to spatial registration, thereby correcting for volume changes due to both affine and nonlinear components of the registration. The unmodulated data were used to investigate differences in gray matter density (GMD). Finally, voxelwise GLM was applied using permutation-based non-parametric testing (5000 permutations) with BMI z-score as variable of interest and gender and age as covariates of no interest 7,8. For the GMM data ICV was also considered in the statistical model as a confounding variable. Results were considered significant for P<0.05, corrected for multiple comparisons using “threshold-free cluster enhancement” (TFCE) 9. Based on the observed results with volumetry, VBM analyses for GMM were also repeated using bilateral masks of the amygdala or accumbens.RESULTS
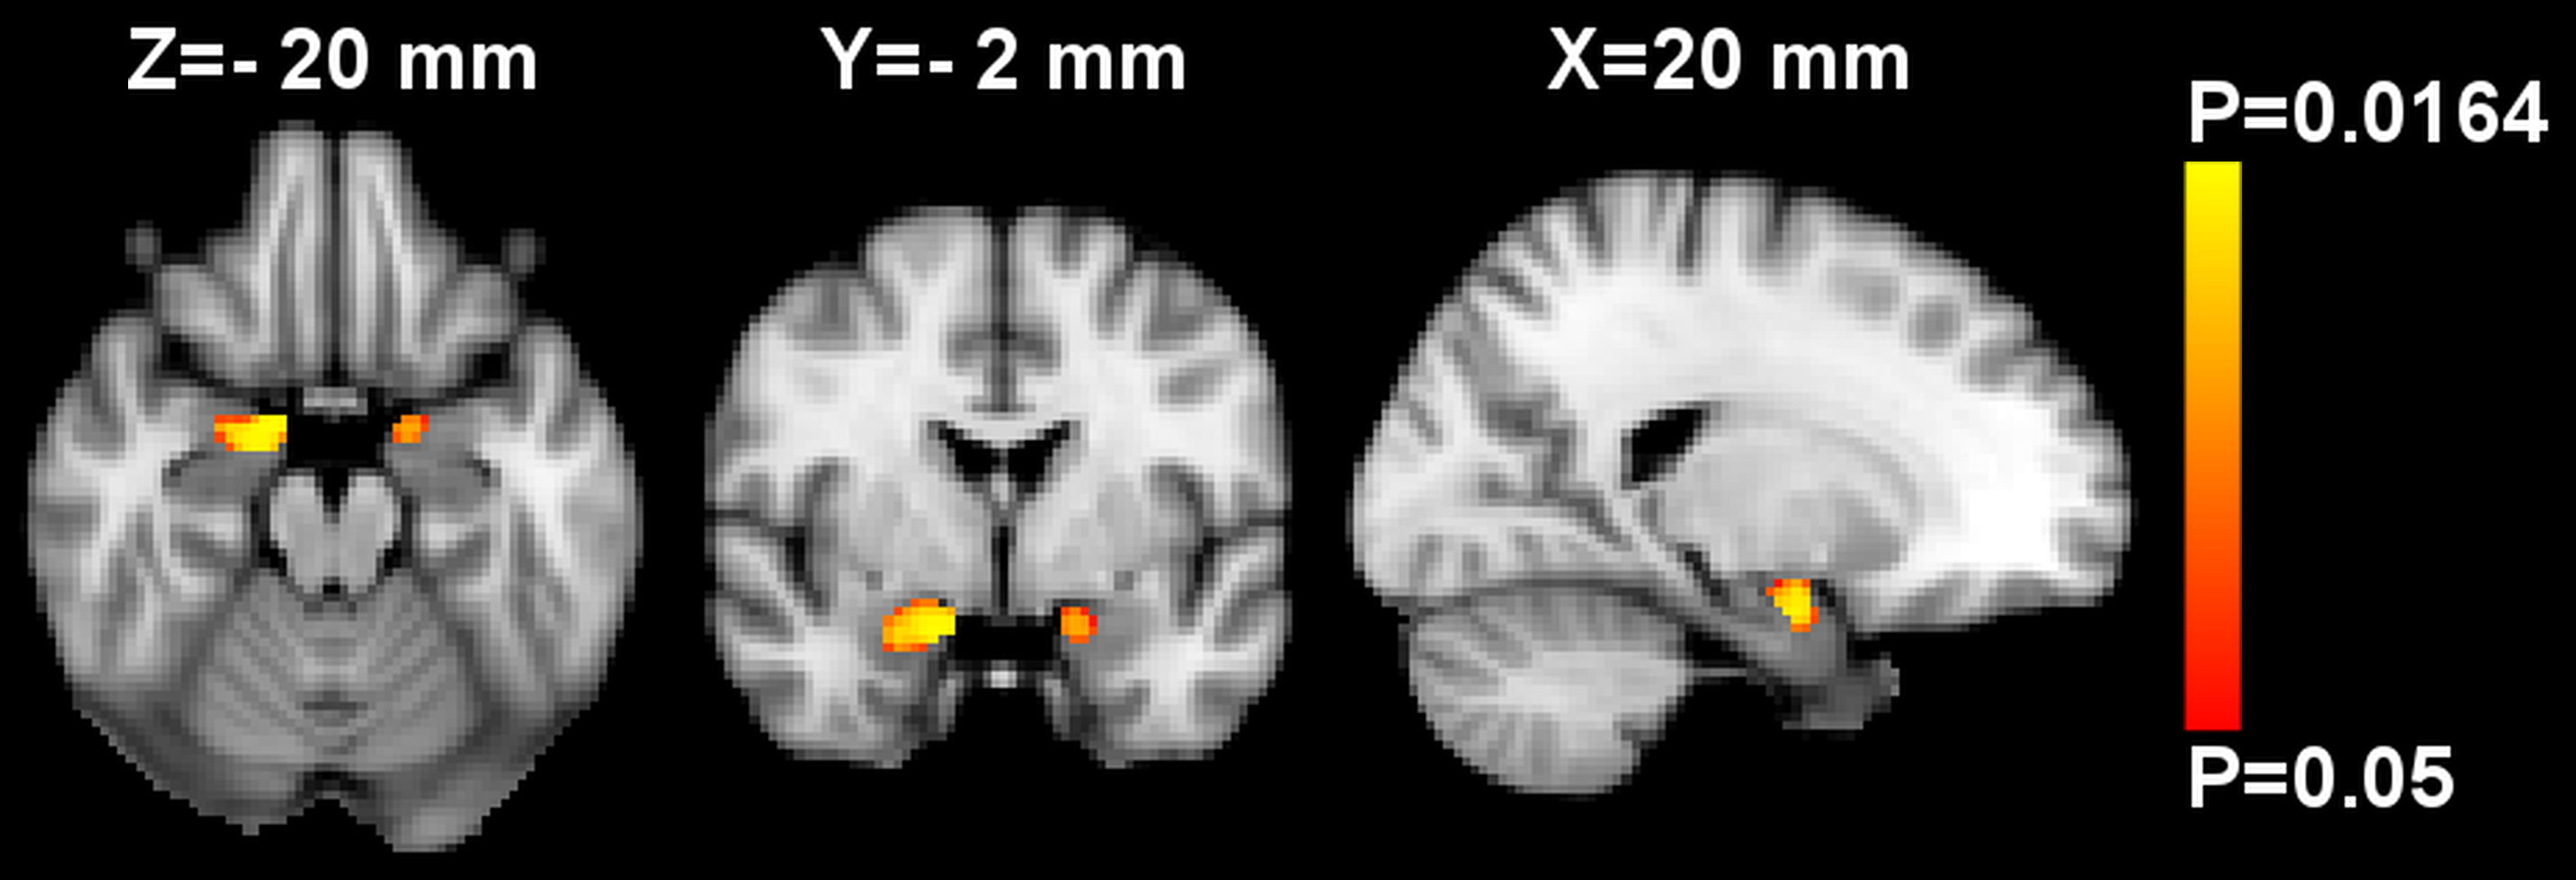
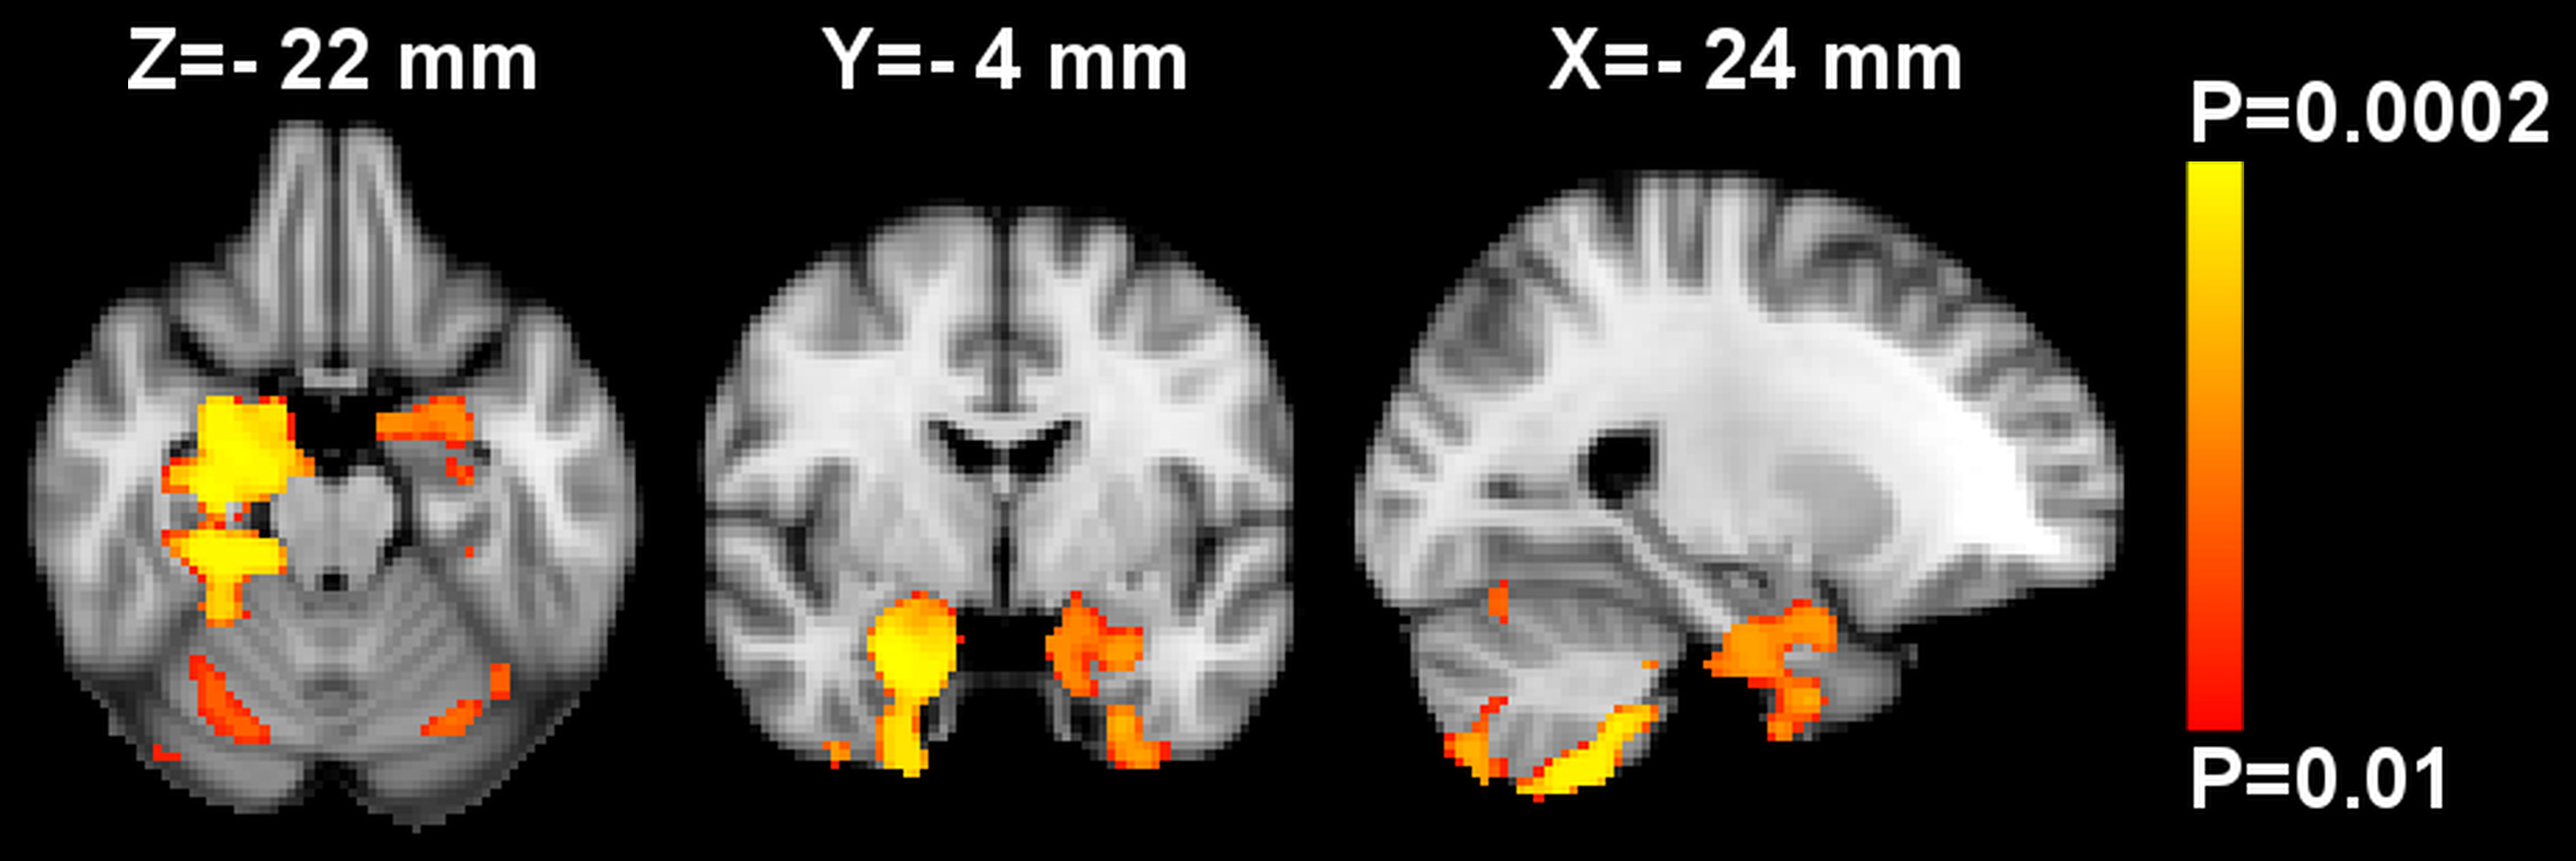
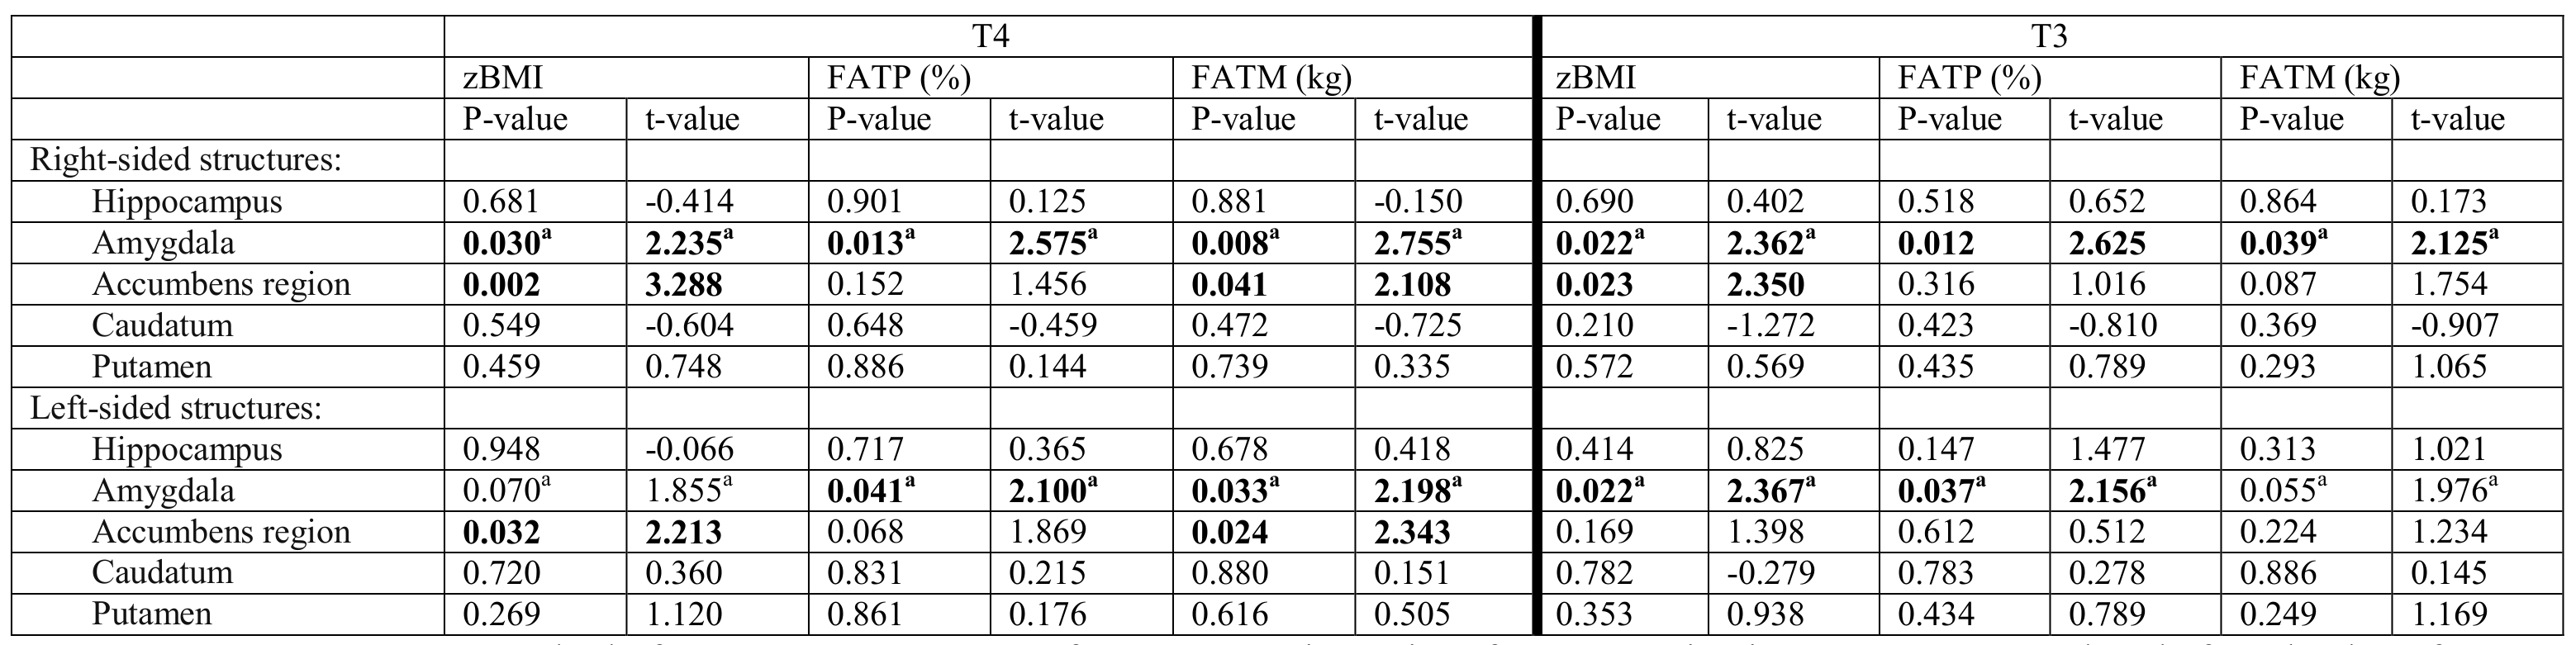
After controlling for the confounding effects of age, gender and ICV, the right amygdala was positively associated with all the examined obesity-related measures (i.e. zBMI; body fat percentage; fat mass) assessed either at the time of MRI (i.e. T4) or ~1.89 years earlier (i.e. T3). Left amygdala showed similar significance pattern, except that the association with zBMI at T4 or fat mass at T3 was only a non-significant trend (P=0.07 and P=0.055, respectively). Left and right accumbens showed significant positive relationship with zBMI and fat mass measured at T4, while using the obesity measures from T3 only the right accumbens and zBMI were positively associated. Table 1 shows the statistical results for all pre-defined brain structures. Using whole-brain VBM analysis controlled for age, gender and ICV, we didn’t find significant association between GMM and zBMI. Performing region of interest VBM analyses in the amygdala and accumbens, a significant inverse relationship between zBMI and GMM was found bilaterally in the amygdala (Figure 1), while the accumbens showed no significant results. However, when the mean GMM extracted from the significant amygdalar voxels were corrected for mean GMD as well, the relationship with zBMI was no further significant. After investigating further, it turned out that GMD was inversely associated with zBMI bilaterally in the amygdala, which was significant when performing whole-brain analysis adjusted for age and gender (Figure 2).DISCUSSION
Our results on the structural correlates of childhood/adolescence obesity indicate that higher adiposity is consistently associated with enlarged structural volumes, but decreased gray matter density in the reward system. Our finding of increased amygdala volume related to obesity is consistent with earlier MR volumetry studies in young adults1, as well as in a large cohort of elderly subjects10.CONCLUSION
Strong evidence has been accumulated showing that altered function of these structures result in modified homeostatic regulation of food intake that promotes the chronic positive energy balance leading to and/or maintaining obesity 11,12. This work also highlights that GMM (which is a complex product of volume and density) is not informative in the context of obesity related volumetric changes and may lead to false conclusions.Acknowledgements
This work was supported by the Janos Bolyai Research Scholarship of the Hungarian Academy of Sciences (G.O. and G.P.), the Hungarian Brain Research Program (KTIA_13_NAP-A-II/9) government-based fund, PTE ÁOK-KA-2017-05, PTE ÁOK-KA-2017-06.
SUPPORTED BY THE ÚNKP-17-4-III-PTE-93, ÚNKP-17-4-I-PTE-76, ÚNKP-17-4-I-PTE-311 NEW NATIONAL EXCELLENCE PROGRAM OF THE MINISTRY OF HUMAN CAPACITIES”.
References
1. Orsi G, Perlaki G, Kovacs N, Aradi M, Papp Z, Karadi K, Szalay C, Karadi Z, Lenard L, Tenyi T, Plozer E, Gabriel R, Nagy F, Doczi T, Komoly S, Jokeit H, Schwarcz A, Janszky J (2011) Body weight and the reward system: the volume of the right amygdala may be associated with body mass index in young overweight men. Brain imaging and behavior 5:149-157.
2. Ahrens W, Siani A, Adan R, De Henauw S, Eiben G, Gwozdz W, Hebestreit A, Hunsberger M, Kaprio J, Krogh V, Lissner L, Molnar D, Moreno LA, Page A, Pico C, Reisch L, Smith RM, Tornaritis M, Veidebaum T, Williams G, Pohlabeln H, Pigeot I (2016) Cohort Profile: The transition from childhood to adolescence in European children-how I.Family extends the IDEFICS cohort. International journal of epidemiology 46: 1394–1395.
3. Cole TJ, Green PJ (1992) Smoothing reference centile curves: the LMS method and penalized likelihood. Statistics in medicine 11:1305-1319.
4. Cole TJ, Lobstein T (2012) Extended international (IOTF) body mass index cut-offs for thinness, overweight and obesity. Pediatric obesity 7:284-294.
5. Fischl B, Salat DH, Busa E, Albert M, Dieterich M, Haselgrove C, van der Kouwe A, Killiany R, Kennedy D, Klaveness S, Montillo A, Makris N, Rosen B, Dale AM (2002) Whole brain segmentation: automated labeling of neuroanatomical structures in the human brain. Neuron 33:341-355.
6. Fischl B, Salat DH, van der Kouwe AJ, Makris N, Segonne F, Quinn BT, Dale AM (2004) Sequence-independent segmentation of magnetic resonance images. NeuroImage 23 Suppl 1:S69-84.
7. Nichols TE, Holmes AP (2002) Nonparametric permutation tests for functional neuroimaging: a primer with examples. Human brain mapping 15:1-25.
8. Winkler AM, Ridgway GR, Webster MA, Smith SM, Nichols TE (2014) Permutation inference for the general linear model. NeuroImage 92:381-397.
9. Smith SM, Nichols TE (2009) Threshold-free cluster enhancement: addressing problems of smoothing, threshold dependence and localisation in cluster inference. NeuroImage 44:83-98.
10. Widya RL, de Roos A, Trompet S, de Craen AJ, Westendorp RG, Smit JW, van Buchem MA, van der Grond J (2011) Increased amygdalar and hippocampal volumes in elderly obese individuals with or at risk of cardiovascular disease. The American journal of clinical nutrition 93:1190-1195.
11. Stoeckel LE, Weller RE, Cook EW, 3rd, Twieg DB, Knowlton RC, Cox JE (2008) Widespread reward-system activation in obese women in response to pictures of high-calorie foods. NeuroImage 41:636-647.
12. Begg DP, Woods SC (2013) The endocrinology of food intake. Nature reviews Endocrinology 9:584-597.
Figures