3258
Hippocampal subfield analysis at 7 tesla in young adults with Down syndrome1Imaging Sciences, The Cleveland Clinic, Cleveland, OH, United States, 2Biomedical Engineering, Hankuk University of Foreign Studies, Yongin, Republic of Korea, 3Case Western Reserve University, Cleveland, OH, United States, 4University Hospitals, Cleveland, OH, United States
Synopsis
This work uses ultra-high resolution at 7 tesla to assess hippocampal subfield volume in young adults with Down syndrome (DS). As compared to matched controls, individuals with DS show decreases in total hippocampal volume and in select regions, particularly on the left.
Introduction
Down syndrome (DS) is the most common non-inherited genetic cause of developmental disability, leading to a range of well-described cognitive and physiological characteristics, including an increased incidence of dementia.1 Neuroanatomical features related to DS have been fairly consistently described, and generally include a decrease in the size of the hippocampus.2-4 Here we report a comparison of hippocampal subfield volumes in young adults with DS and age-matched healthy controls. A more complete understanding of structural changes of the hippocampus has the potential to increase our understanding of the pathophysiology of DS.Methods
10 young adults with DS (mean age 18.8 ± 2.5, 5 males) and 5 age-matched controls (mean age 18.6 ± 3.4, 3 males) were scanned in an IRB-approved protocol. Scans were acquired on a Siemens 7T Magnetom with SC72 gradient (Siemens Medical Solutions, Erlangen) using a single-Tx/32-channel Rx head coil (Nova Medical). Scans included a whole-brain anatomical MP2RAGE (0.75mm3 isotropic voxel size; WIP 900) and a high-resolution GRE scan focusing on the hippocampus (0.375 x 1.0 x 0.375mm3, coronal acquisition).
Data Analysis
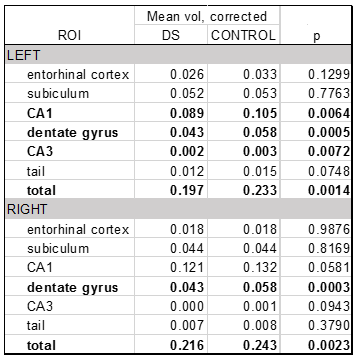
Hippocampal subfield segmentation was performed using the Automated Segmentation of Hippocampal Subfields (ASHS) software.5 Freesurfer was used to measure total grey (GM) and white matter (WM) volumes. All segmentations were visually checked for accuracy and manually corrected if necessary. Volumes were calculated for the right and left entorhinal cortex, subiculum, CA1, CA3, the dentate gyrus, and the total hippocampus. All volumes were corrected for intracranial volume (ICV) ((regional volume/ICV)*100). Unpaired Student’s t-tests were used to compare controls and those with DS and the false discovery rate was used to control for multiple comparisons.
Results
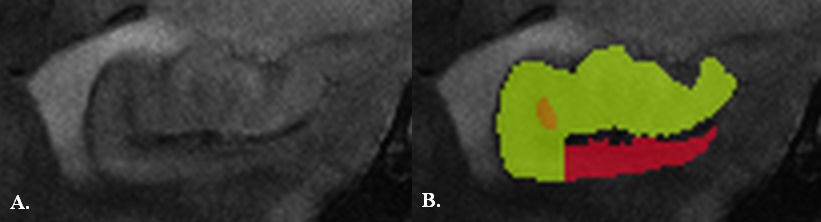
DS and control subjects did not show significant differences in age (p < 0.898). ICV-corrected GM and WM volumes did not differ between groups (p < 0.935), though ICV and uncorrected GM and WM were smaller in those with DS (p < 0.0074). Figure 1 shows a representative segmentation at the head of the hippocampus. Total hippocampal volume and the dentate gyrus were smaller in those with DS on both the right and left (p < 0.002; Figure 2). Additionally, CA1 and CA3 were smaller on the left side only (p < 0.007).Discussion and Conclusion
We find that total hippocampal and dentate volumes are decreased bilaterally in those with DS. This is in agreement with reports of decreased myelin density in the hilus of the dentate gyrus.6 Though ICV-corrected whole-brain measures were not different between groups, ICV and uncorrected GM and WM indicate smaller overall brain volume in those with DS. This work represents the first assessment of hippocampal subfield volume in DS at ultra-high field strength. Additional work is needed to clarify the relationship between imaging measures and cognitive ability.Acknowledgements
This work was supported by The Alana Foundation USA. The authors acknowledge technical support by Siemens Medical Solutions and Dr. Tobias Kober.References
1. Roizen & Patterson. Down’s Syndrome. Lancet. 2003; 361: 1281-1289.
2. Beacher E, Daly E, Simmons A, et al. Alzheimer’s disease and Down’s syndrome: an in vivo MRI study. Psychological Medicine 2009; 39:675-84
3. Kesslak JP, Nagata SF, Lott IT, et al. MRI analysis of age-related changes in the brains of individuals with DS. Neurology 1994; 44:1039-45
4. Raz N, Torres IJ, Briggs SD, et al. Selective neuroanatomic abnormalities in Down’s syndrome and their cognitive correlates: Evidence from MRI morphology. Neurology 1995; 45:356-66
5. Yushkevich PA, Pluta J, Wang H, et al. Automated Volumetry and Regional Thickness Analysis of Hippocampal Subfields and Medial Temporal Cortical Structures in Mild Cognitive Impairment. Hum Brain Mapp. 2014; 36: 258-87
6. Ábrahám H, Vincze A, Veszprémi B, Kravják A, Gömöri É, Kovács GG, Seress L. Impaired myelination of the human hippocampal formation in Down syndrome. Int J Dev Neuroscience. 2012; 30(2): 147-158.
Figures