3254
In-vivo probabilistic structural atlas of the inferior colliculus, superior colliculus, medial geniculate nucleus, and lateral geniculate nucleus based on 7 Tesla MRI1Department of Neurosurgery, Brigham and Women’s Hospital and Harvard Medical School, Boston, MA, United States, 2Department of Radiology, A.A. Martinos Center for Biomedical Imaging, MGH and Harvard Medical School, Boston, MA, United States, 3Medical Physics Section, Department of Biomedicine and Prevention, Faculty of Medicine, University of Rome “Tor Vergata”, Rome, Italy
Synopsis
Brainstem and thalamic nuclei such as the inferior-colliculus, superior-colliculus, lateral-geniculate-nucleus, and medial-geniculate-nucleus modulate visual/oculo-motor and auditory/auditory-motor functions. Dysfunction of these nuclei is implicated in disease states such as auditory-agnosia, pure-word deafness, eye-movement and visual-field deficits, Parkinson’s hallucinations, and glaucoma. However, a stereotaxic probabilistic atlas of these nuclei in humans does not exist. We used segmentation of 1.1mm-isotropic 7Tesla T2-weighted- and diffusion-fractional-anisotropy-images to generate and validate an in-vivo probabilistic neuroimaging-based structural atlas of these nuclei in stereotaxic-MNI space. We constructed this atlas to aid the localization of these nuclei in conventional images for future research and clinical investigations of visual/auditory functions.
Introduction
Brainstem and thalamic nuclei such as the inferior colliculus (IC), superior colliculus (SC), medial geniculate nucleus (MG), and lateral geniculate nucleus (LG) modulate visual/oculo-motor (the SC and LG) and auditory/auditory-motor (the IC and MG) functions. These nuclei are involved in the pathogenesis of disorders such as auditory agnosia, pure-word deafness, eye-movement and visual-field deficits, Parkinson’s hallucinations, and glaucoma1-5. Nevertheless, a stereotaxic probabilistic structural atlas of these nuclei in living humans does not exist.Purpose
To create a stereotaxic neuroimaging-based structural atlas of the left and right (l/r) IC, SC, MG, and LG by the use of: 1) cutting-edge technology (7 Tesla scanner, 32-channel receive coil-array) to maximize MRI detection sensitivity; 2) a high-resolution (1.1 mm isotropic) multi-contrast (T2-weighted and diffusion fractional anisotropy (FA)) echo-planar-imaging (EPI) approach, which provided complementary contrasts for brainstem anatomy with precisely matched geometric distortions and resolution.Methods
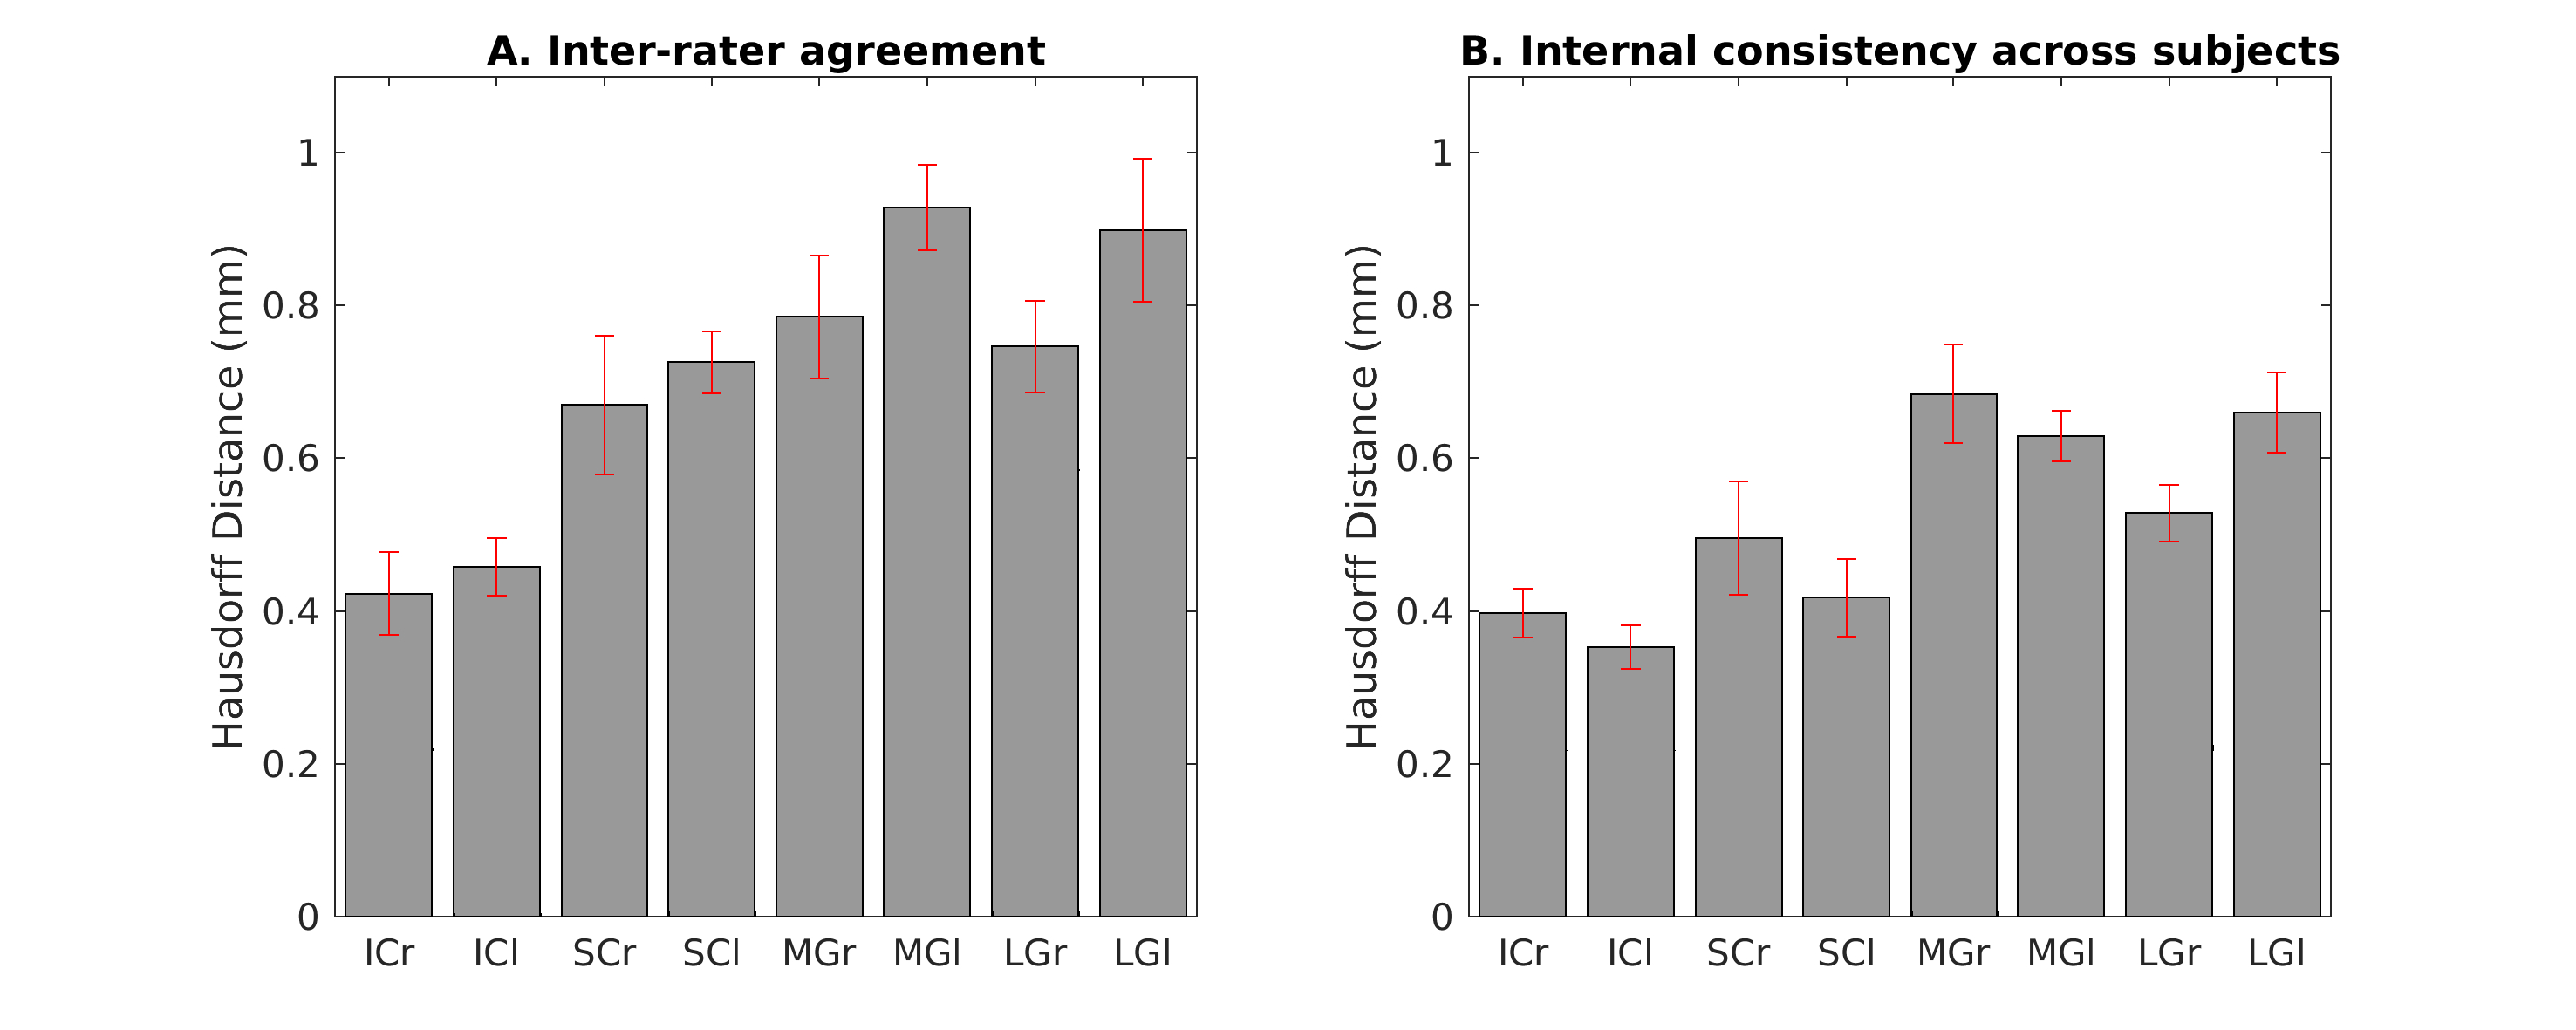
Data acquisition: Twelve subjects (6m/6f, age 28y ± 1y) underwent 7 Tesla MRI under IRB approval. We adopted a common single-shot 2D EPI readout for 1.1 mm isotropic T2 weighted (T2w) and diffusion-tensor (DTI) sagittal images, with matrix size/GRAPPA factor/nominal echo-spacing = 180 × 240/3/0.82 ms. This yielded multi-contrast anatomical images with exactly matched resolution and geometric distortions. Additional MRI parameters were: spin-echo EPI, 61 slices, TE/TR = 60.8 ms/5.6 s, partial Fourier: 6/8, unipolar diffusion-weighting gradients for DTI, 60 non collinear-coplanar diffusion directions (b-value ~ 1000 s/mm2), 7 interspersed “b0” images (non-diffusion weighted, b-value ~ 0 s/mm2, which were also used as T2w MRI), 4 repetitions, acquisition time/repetition 6’43”. Data analysis: After eddy-current distortion correction and motion correction, the diffusion tensor and FA maps were estimated from DTI data; the T2w MRI was computed as the average “b0” image. Single-subject T2w/FA images were coregistered to MNI space through high dimensional non-linear transformations (ANTs6). On a single-subject basis, two independent researchers (C.S., M.B.) performed manual segmentation of T2w/FA images to yield single-subject labels of ICl/r, SCl/r, MGl/r, and LGl/r (nuclei defined as hypointense regions in T2w images; FA images used to identify the borders of IC and SC with the cuneiform nucleus). Only voxels rated by both raters as belonging to a nucleus were included in the final nucleus label. A probabilistic atlas for these nuclei in MNI space was then created by averaging the nuclei labels across subjects (highest probability = 100 % overlap across subjects). Atlas validation: The probabilistic nuclei atlas was validated by computing for each nucleus and subject: (i) the inter-rater agreement, as the modified Hausdorff distance7 between labels delineated by the two raters; (ii) the internal consistency across subjects of the final label, as the modified Hausdorff distance7 between each final label and the probabilistic atlas label (thresholded at 35%) generated by averaging the labels across the other 11 subjects (leave-one-out cross validation). For each nucleus, the modified Hausdorff distance of (i) and (ii) was then averaged across subjects and displayed.Results
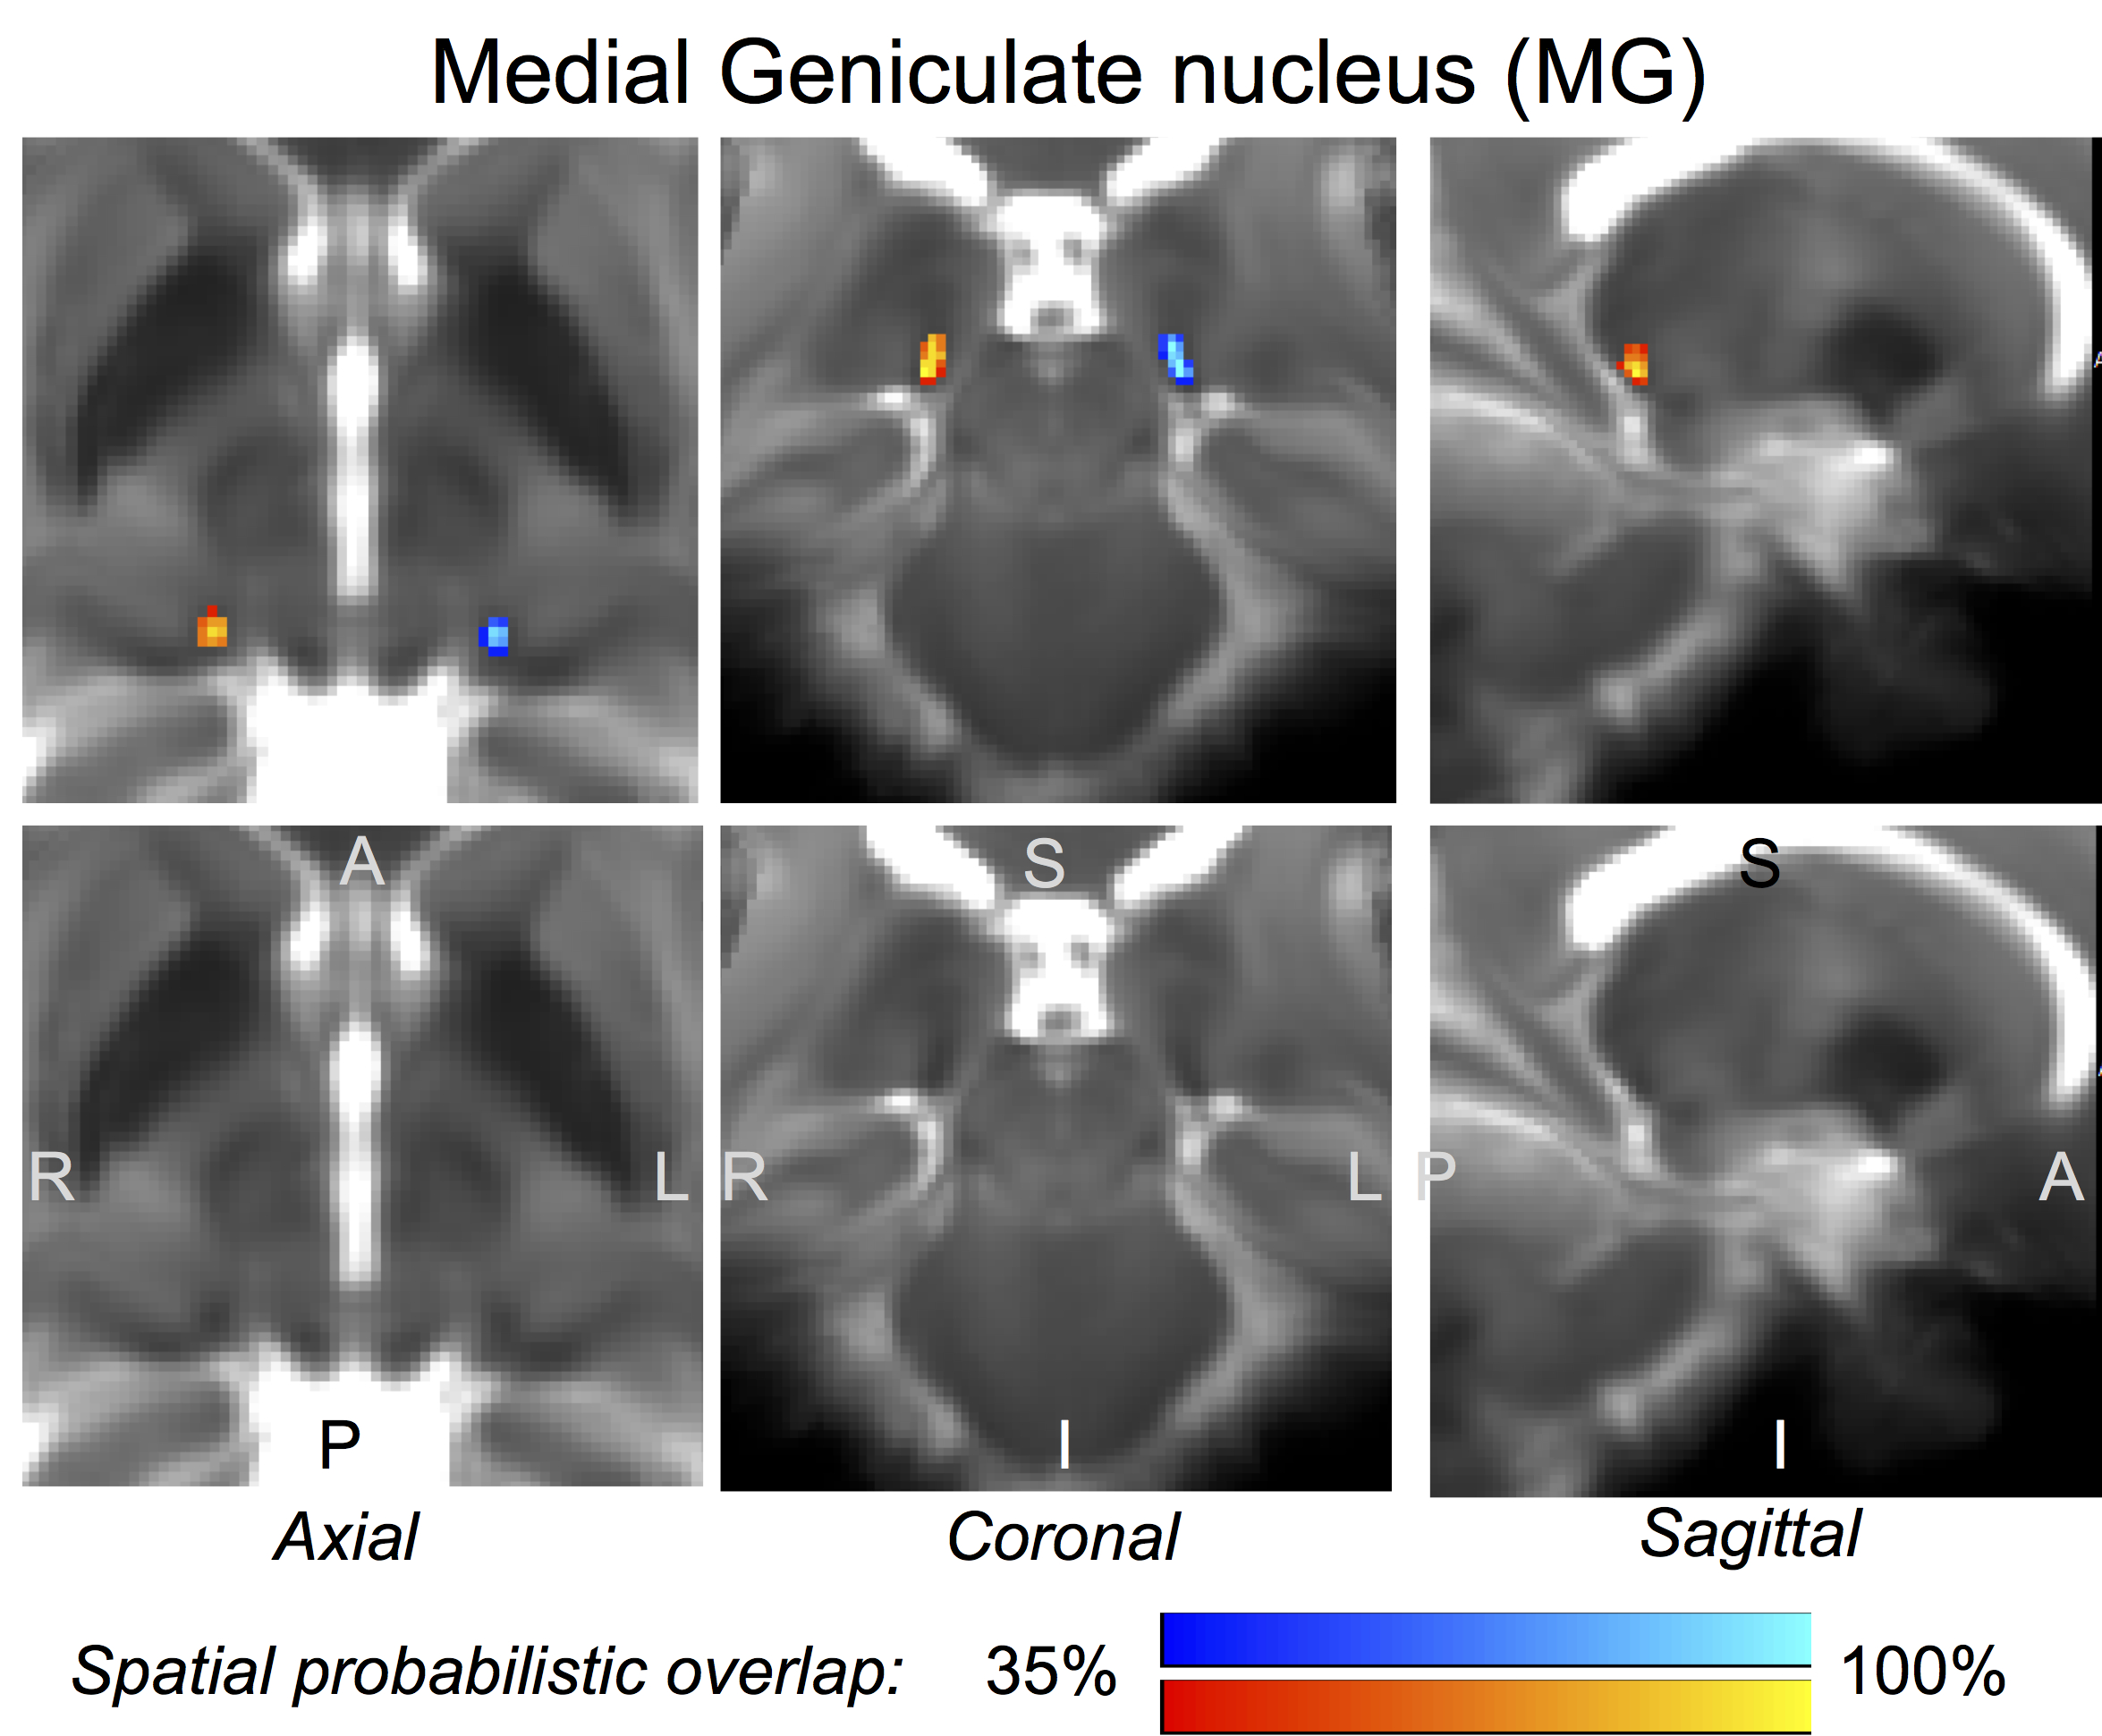
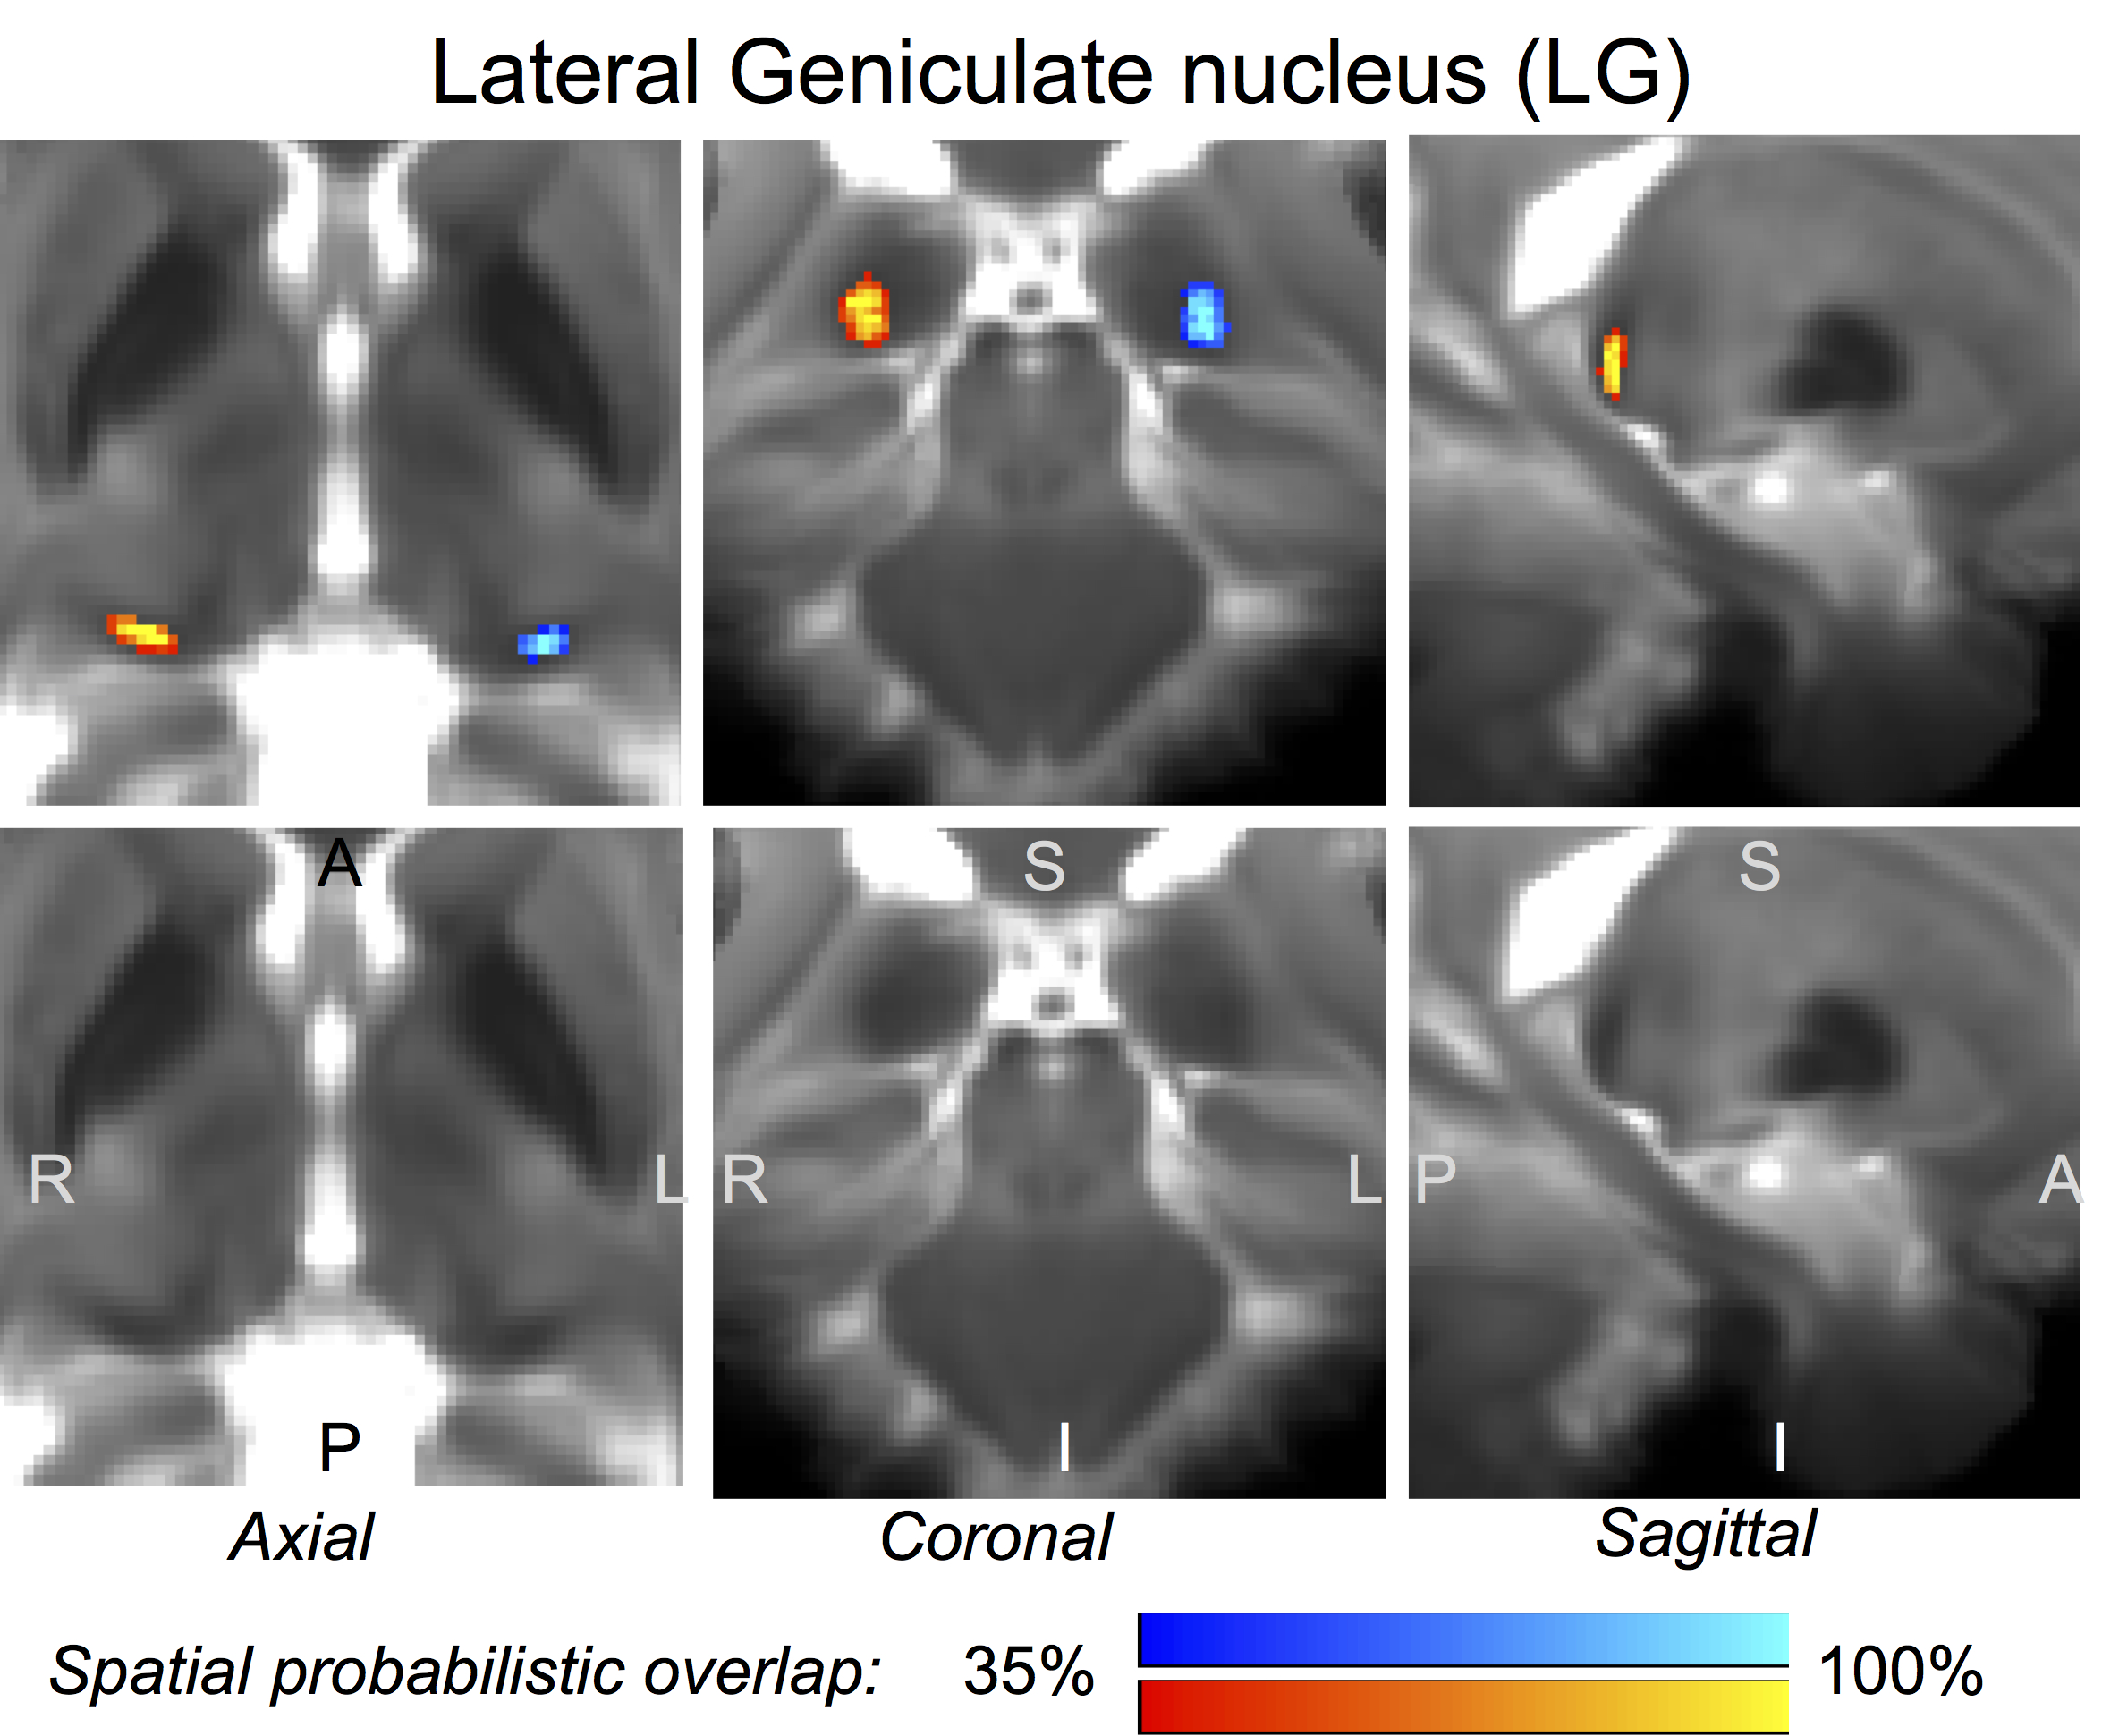
The probabilistic neuroimaging-based structural labels in MNI space of ICl/r, SCl/r, MGl/r and LGl/r are shown in Figures 1-4. For each nucleus, the average modified Hausdorff distance assessing the inter-rater agreement (Figure 5A) and the internal consistency (Figure 5B) of nuclei atlas labels was below (p < 0.05, unpaired t-test) the linear spatial imaging resolution (1.1 mm), thus validating the generated probabilistic nuclei atlas.Discussion
Our findings demonstrated the feasibility of delineating auditory/visual brainstem and thalamic nuclei by segmentation of single-subject high-contrast and high-sensitivity MRIs at 7 Tesla. This extends previous reports8-10 of manual single-subject localization of some of these nuclei in neuroimages of living humans based on the identification of anatomical landmarks. Crucially, our work also demonstrated the feasibility of generating a validated in vivo stereotaxic probabilistic atlas of these structures after precise coregistration to MNI space. This atlas complements existing in vivo neuroimaging atlases of other brain structures11-14.Conclusions
We foresee the use of the generated probabilitic atlas of the IC, SC, MG, and LG to aid the localization of these nuclei in conventional (e.g. 3 Tesla) images in future research studies of auditory and visual functions. Further, this atlas, upon coregistration to clinical MRI, might improve the evaluation of lesions and the assessment of connectivity pathways underlying auditory and visual mechanisms in a broad set of disease populations (e.g. auditory agnosia, pure-word deafness, eye movement and visual field deficits, Parkinson’s hallucinations, and glaucoma).Acknowledgements
NIH-NIBIB K01EB019474; NIH-NIBIB P41EB015896.References
1. Poliva O, Bestelmeyer PE, Hall M, et al. Functional mapping of the human auditory cortex: fMRI investigation of a patient with auditory agnosia from trauma to the inferior colliculus. Cogn Behav Neurol. 2015;28(3):160-180.
2. Joswig H, Schönenberger U, Brügge D, et al. Reversible pure word deafness due to inferior colliculi compression by a pineal germinoma in a young adult. Clin Neurol Neurosurg. 2015;139:62-65.
3. Biotti D, Barbieux M, Brassat D. Teaching Video NeuroImages: Alternating skew deviation with abducting hypertropia following superior colliculus infarction. Neurology. 2016;86(9):e93-94.
4. Pasu S, Ridha BH, Wagh V, et al. Homonymous sectoranopia: asymptomatic presentation of a lateral geniculate nucleus lesion. Neuroophthalmology. 2015;39(6):289-294.
5. Lee JY, Yoon EJ, Lee WW, et al. Lateral geniculate atrophy in Parkinson's with visual hallucination: a trans-synaptic degeneration? Mov Disord. 2016;31(4):547-54.
6. Avants BB, Tustison NJ, Song G, et al. A reproducible evaluation of ANTs similarity metric performance in brain image registration. Neuroimage. 2011;54(3):2033-2044.
7. Dubuisson MP, Jain AK. A modified Hausdorff distance for object matching. Proc IAPR Int Conf Pattern Recognition. Jerusalem, Israel, 1994;1:566-568.
8. Wang J, Miao W, Li J, et al. Automatic segmentation of the lateral geniculate nucleus: application to control and glaucoma patients. J Neurosci Methods. 2015;255:104-114.
9. Renauld E, Descoteaux M, Bernier M, et al. Semi-automatic segmentation of optic radiations and LGN, and their relationship to EEG alpha waves. PLoS One. 2016;11(7):e0156436.
10. Li M, He HG, Shi W, et al. Quantification of the human lateral geniculate nucleus in vivo using MR imaging based on morphometry: volume loss with age. AJNR Am J Neuroradiol. 2012;33(5):915-921.
11. Destrieux C, Fischl B, Dale A, et al. Automatic parcellation of human cortical gyri and sulci using standard anatomical nomenclature. Neuroimage. 2010;53(1):1-15.
12. Desikan RS, Segonne F, Fischl B, et al. An automated labeling system for subdividing the human cerebral cortex on MRI scans into gyral based regions of interest. Neuroimage. 2006;31(3):968-980.
13. Tzourio-Mazoyer N, Landeau B, Papathanassiou D, et al. Automated anatomical labeling of activations in SPM using a macroscopic anatomical parcellation of the MNI MRI single-subject brain. Neuroimage. 2002;15(1):273-289.
14. Bianciardi M, Toschi N, Edlow BE, et al. Toward an in vivo neuroimaging template of human brainstem nuclei of the ascending arousal, autonomic, and motor systems. Brain Connect. 2015;5(10):597-607.
Figures
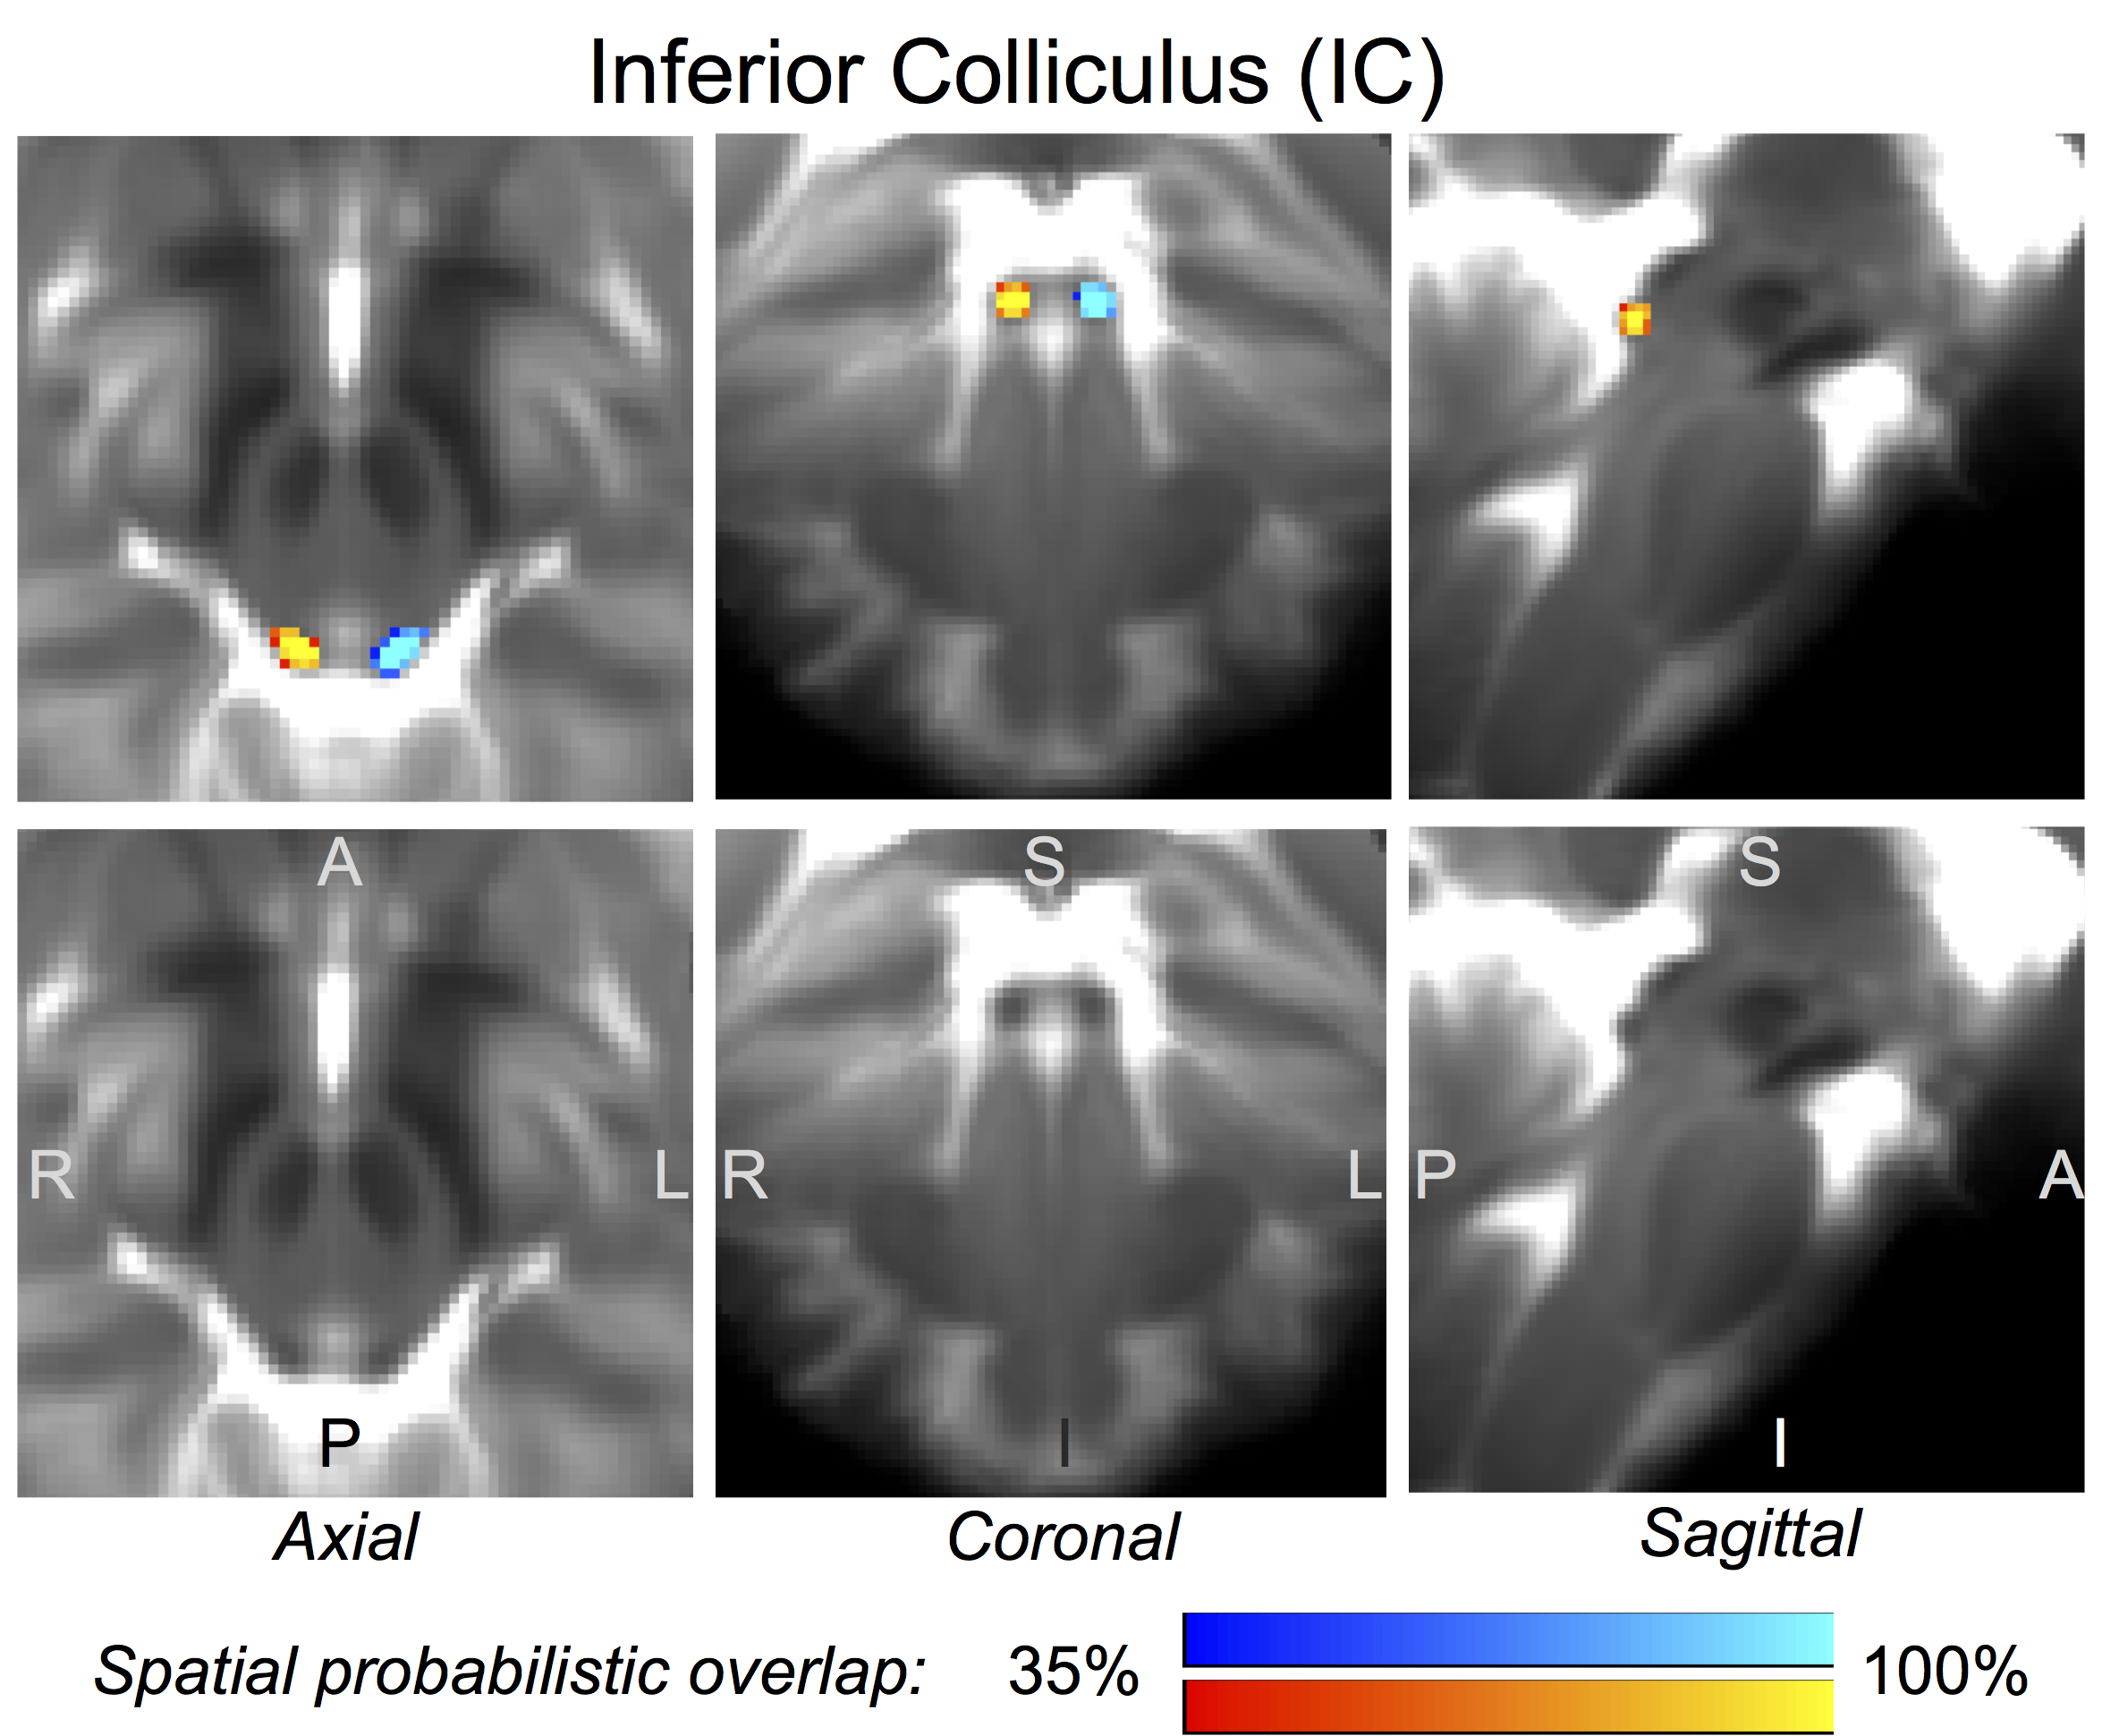
Figure 1 Probabilistic (n = 12) atlas label in MNI space of the inferior colliculus (IC, left: blue-to-cyan; right: red-to-yellow). The IC was hypointense in T2w MRI; its label is overlaid on the group average T2w image. Very good (i.e. up to 100 %) spatial agreement of labels across subjects was observed indicating the feasibility of delineating the probabilistic label of this nucleus involved in auditory and auditory-motor functions.
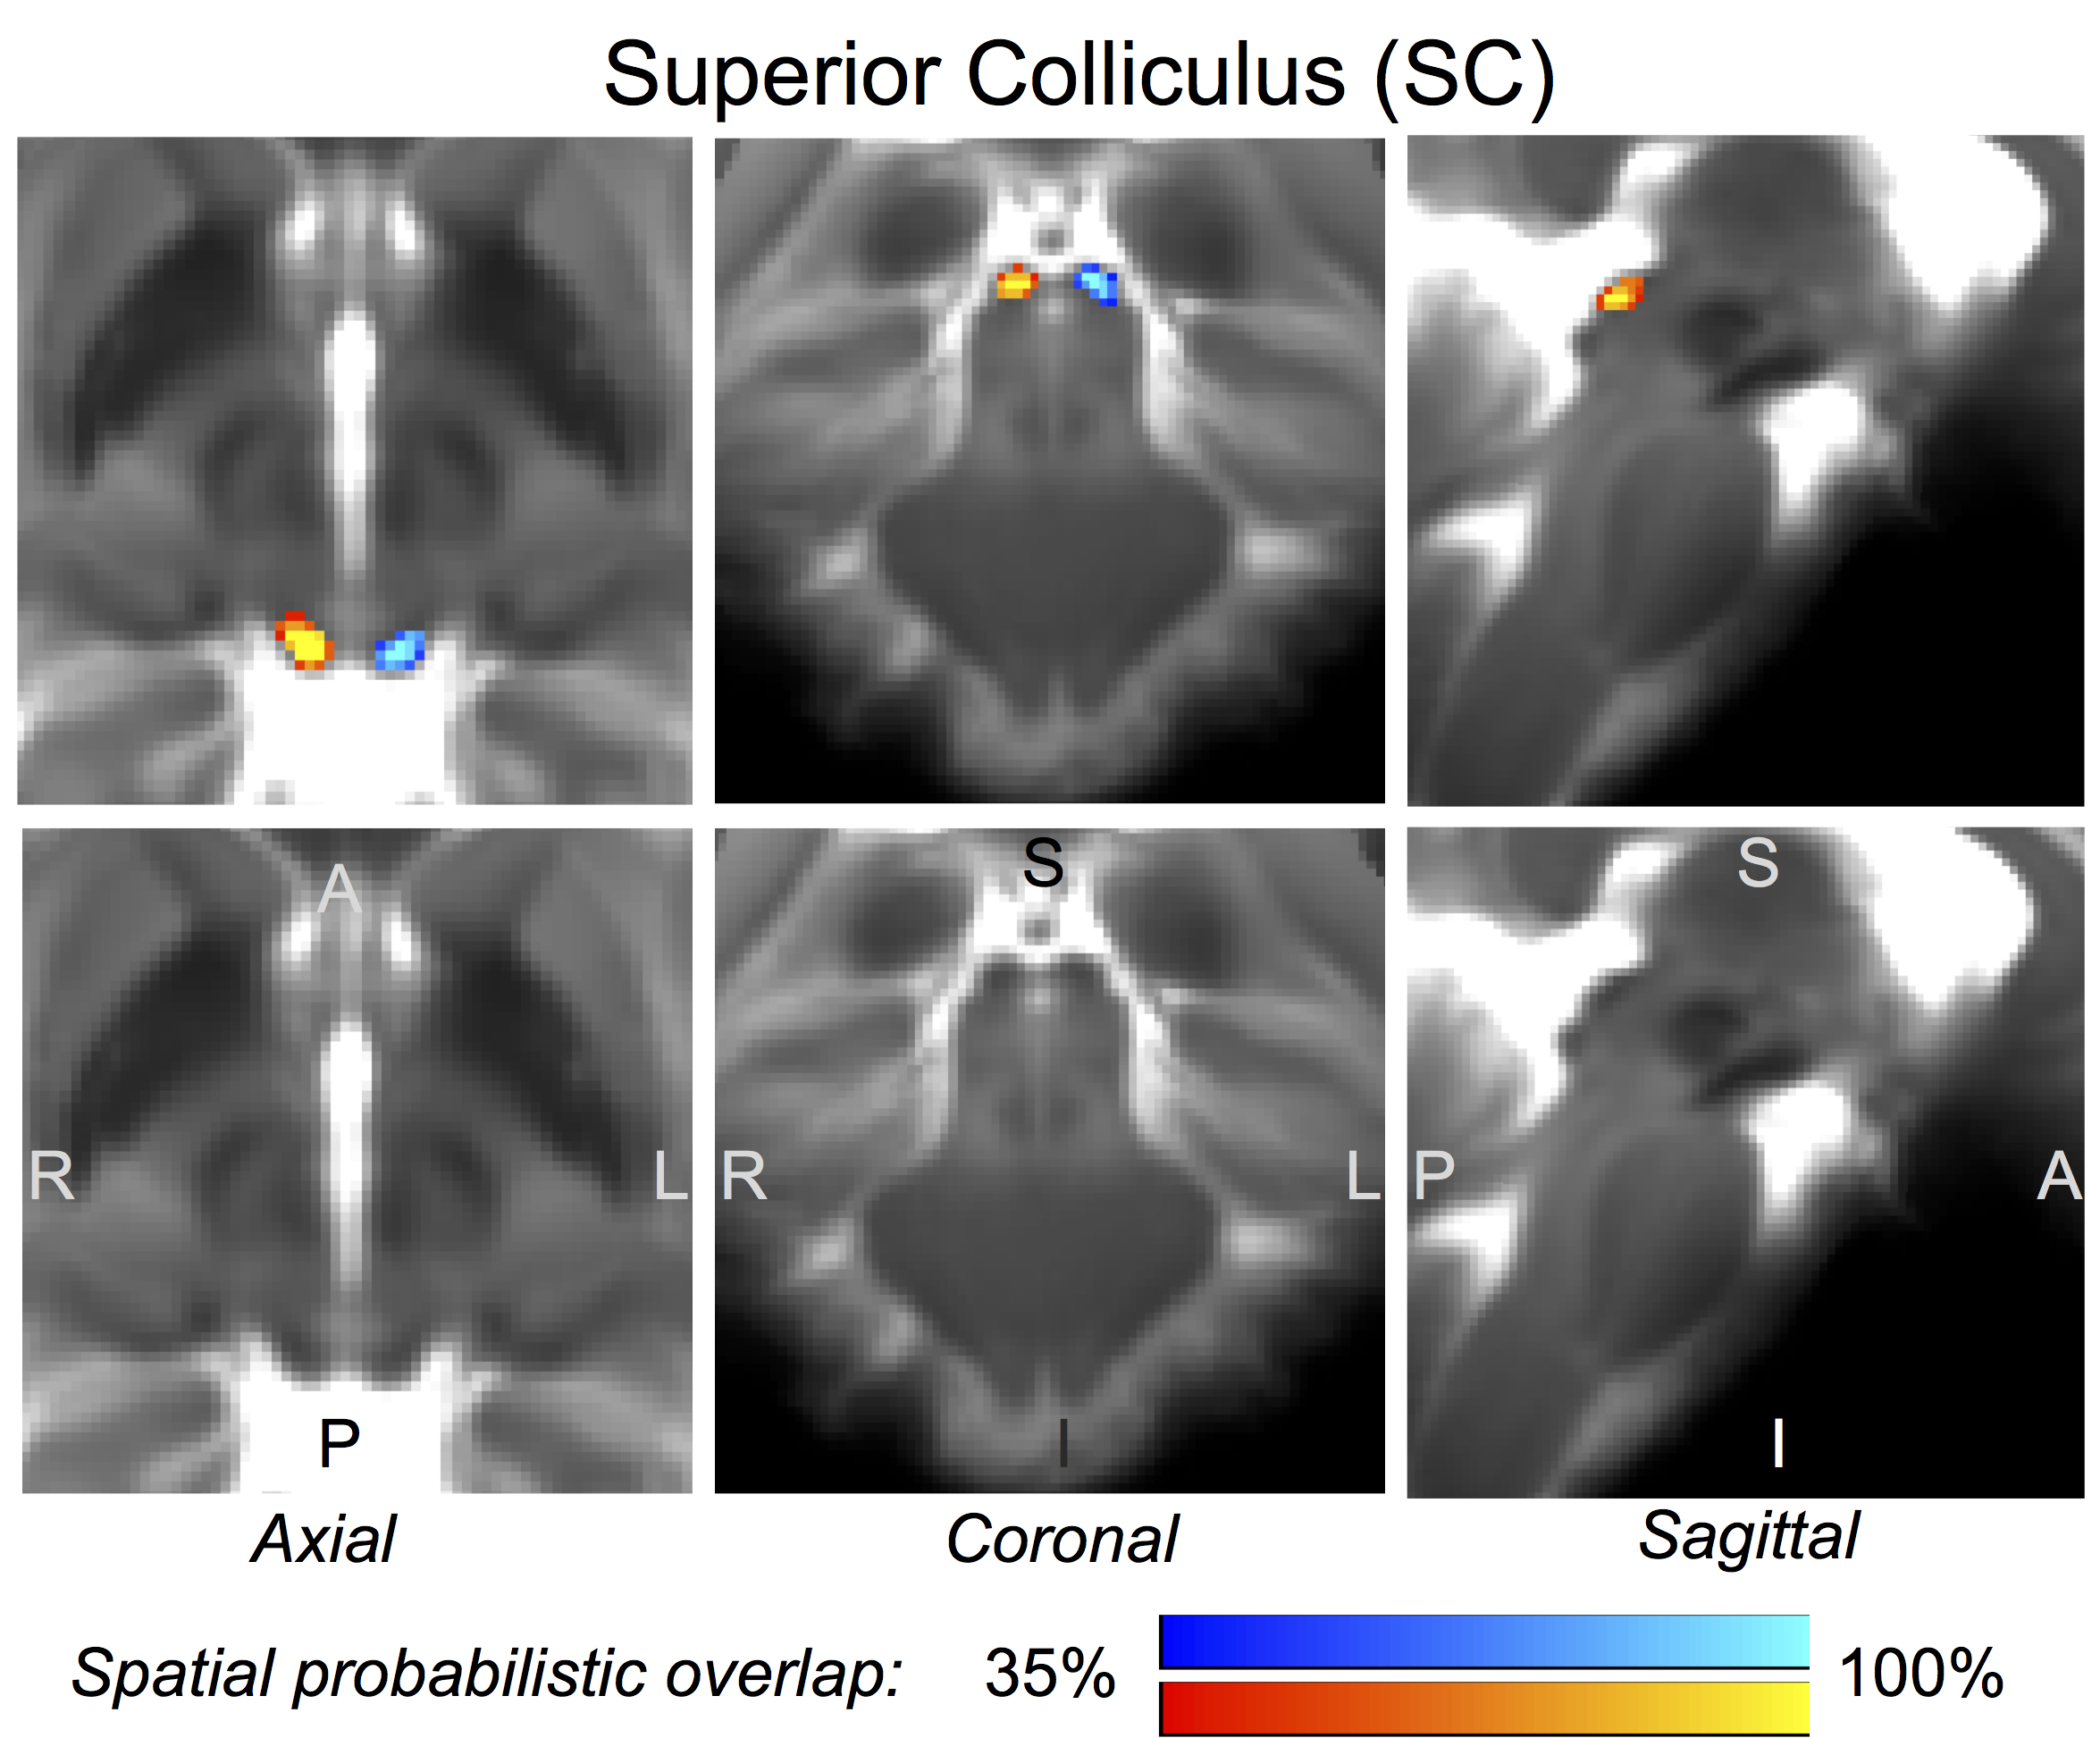
Figure 2 Probabilistic (n = 12) atlas label in MNI space of the superior colliculus (SC, left: blue-to-cyan; right: red-to-yellow). The SC was hypointense in T2w MRI; its label is overlaid on the group average T2w image. Very good (i.e. up to 100 %) spatial agreement of labels across subjects was observed indicating the feasibility of delineating the probabilistic label of this nucleus involved in visual and oculo-motor functions.